Market Wrap: Stocks, Bonds, Commodities
The Wall Street ended sharply higher on Thursday, lifted by gains in Nvidia and other technology-related stocks as investors focused on the Federal Reserve’s Jackson Hole conference for clues about the central bank’s policy outlook.
The Dow Jones Industrial Average rose 322.55 points to 33,291.78, the S&P 500 gain 58.35 points to 4,199.12 and the Nasdaq Composite add 207.74 points to 12,639.26.
MSCI’s index of Asia-Pacific stocks outside Japan is ascend 0.43% to 644.89 levels. Australian index higher 0.79% to 7,104.10. Japanese Nikkei Index ascend 0.57% to 28,641.38.
European stocks were positive on Friday, with the Stoxx Europe 50 Index rose 0.16% to 3,680.55, Germany’s DAX advance 0.03% to 13,275.75, and France’s CAC ascend 0.04% to 6,384.43, and U.K.’s FTSE 100 surged 0.24% to 7,496.10.
Benchmark 10-year U.S. Treasury fell as demand for safe assets ascend again, today 10-year bond yields a positive 1.66% to 3.0740.
Oil prices rose as much as $1 on Friday on signs of improving fuel demand, although further gains were capped as the market awaited clues from the U.S. Federal Reserve chairman on the outlook for rate hikes in a speech later in the day.
Spot Brent crude oil add 0.31% to $99.67 per barrel. US West Texas Intermediate crude is up 0.41% to $92.91 a barrel.
The yellow metal gold is decline 0.45% to 1,763.45 dollars per ounce.
Market Wrap: Forex
The dollar index slipped while the euro was steady on Thursday in choppy trading as investors awaited Federal Reserve Chairman Jerome Powell’s speech on Friday for further clues about the pace of the U.S. central bank’s rate hikes.
Today, the U.S. dollar index measures the Greenback against a trade-weighted basket of six major currencies, which is rose 0.09% to 108.525.
The Euro US Dollar (EUR/USD) is a widely traded pair that is up 0.02% today. This left the pair trading around $0.99750.
The Japanese yen was positive against the U.S. dollar on Friday as the stock up. Today USD/JPY is ascend 0.34% to 136.960 level.
Another commodity-related currency negative against the U.S dollar, AUD/USD lose 0.32% to 0.69580, and NZD/USD down 0.67 to 0.61890 level.
EUR/USD Intraday: In a consolidation zone
Our pivot point is at 0.99820
Preferable Price Action: Take sell positions below pivot level with targets at 0.99410 & 0.99050 in extension.
Alternative Price Action: Above pivot looks for a further upside to 1.00180 & 1.00500.
Comment: RSI at 50 levels and Pairs below 55MA.
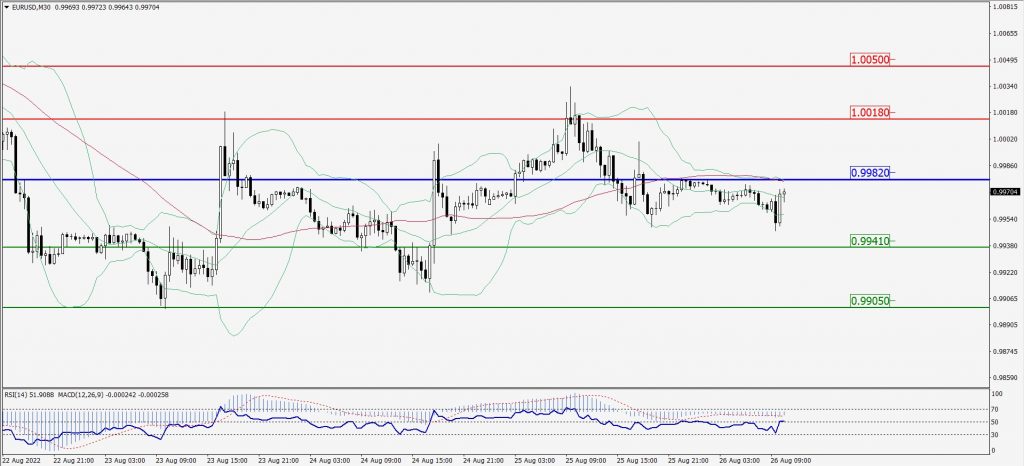
Green Lines Indicate Resistance Levels – Red Lines Indicate Support Levels
Light Blue is a Pivot Point – Black represents the price when the report was produced
GBP/USD Intraday: Trend on the downside
Our pivot point is at 1.18120
Preferable Price Action: Sell positions below pivot with targets at 1.17400 & 1.16790 in extension.
Alternative Price Action: The price above pivot would call for further upside to 1.18760 & 1.19270.
Comment: RSI below 50 levels and Pairs below its 20MA & 55MA.
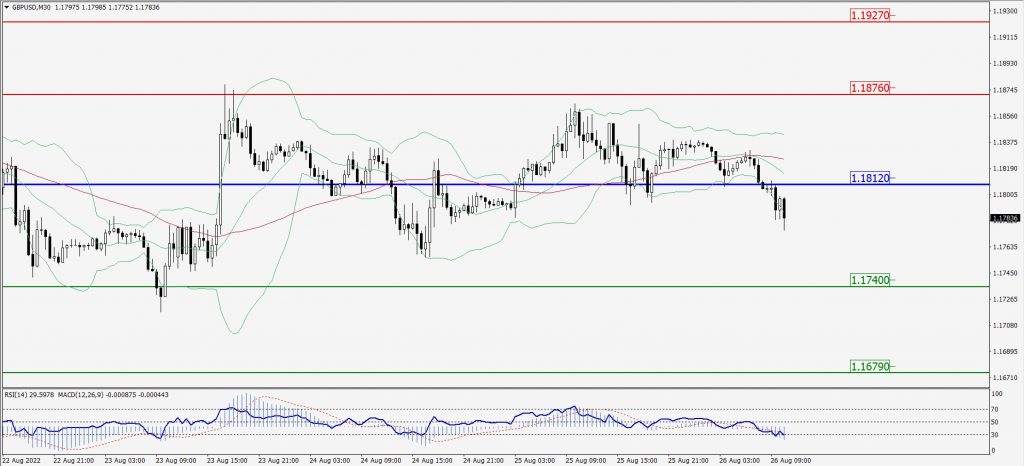
Green Lines Indicate Resistance Levels – Red Lines Indicate Support Levels
Light Blue is a Pivot Point – Black represents the price when the report was produced
USD/JPY Intraday: Major trend on the upside
Our pivot point is at 136.900
Preferable Price Action: Buy position above pivot with the target at 137.540 and 137.940 in extension.
Alternative Price Action: The downside breakout of the pivot would call for 136.390 and 135.970.
Comment: MACD is positive territory and Pairs above its 20MA & 55MA.
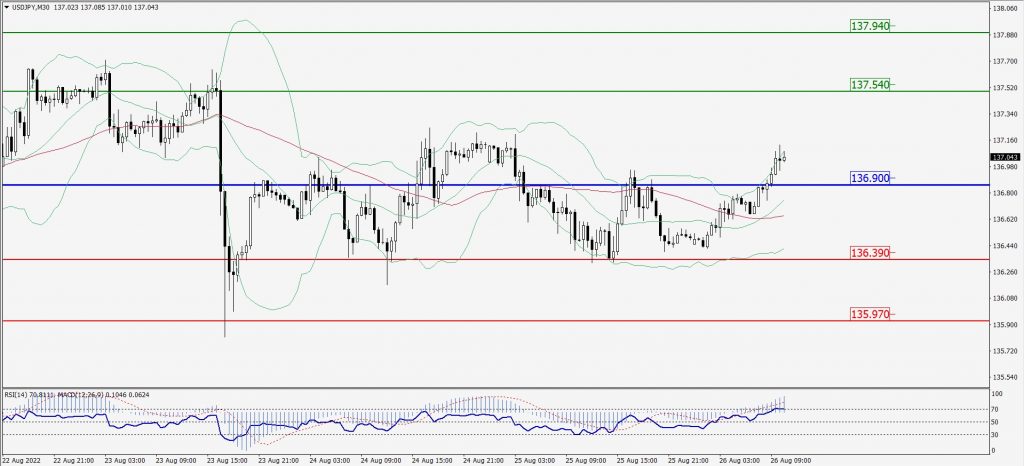
Green Lines Indicate Resistance Levels – Red Lines Indicate Support Levels
Light Blue is a Pivot Point – Black represents the price when the report was produced
AUD/USD Intraday: Trend on the downside
Our pivot point is at 0.69720
Preferable Price Action: Sell Positions below pivot with targets at 0.69330 & 0.69040 in extension.
Alternative Price Action: Above pivot looks for a further upside with 0.70090 & 0.70480 as targets.
Comment: RSI below 50 levels and Pairs below its 20MA & 55MA.
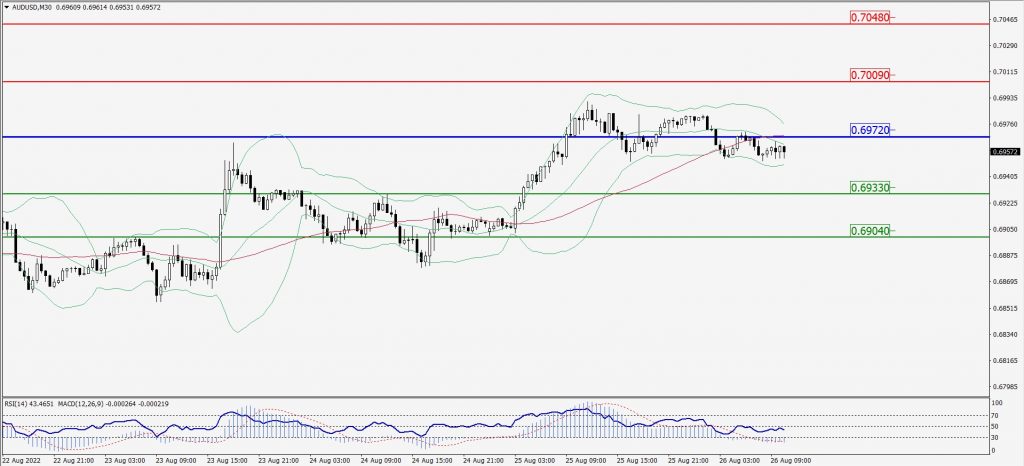
Green Lines Indicate Resistance Levels – Red Lines Indicate Support Levels
Light Blue is a Pivot Point – Black represents the price when the report was produced
CRUDEOIL Intraday: Support level at 93.23
Our pivot point is at 93.23
Preferable Price Action: Above pivots buy oil with 95.06 & 96.47 as targets.
Alternative Price Action: Sell crude below pivot with targets at 91.55 and 90.32 in extension.
Comment: MACD is in the positive territory and Pairs above 20MA.
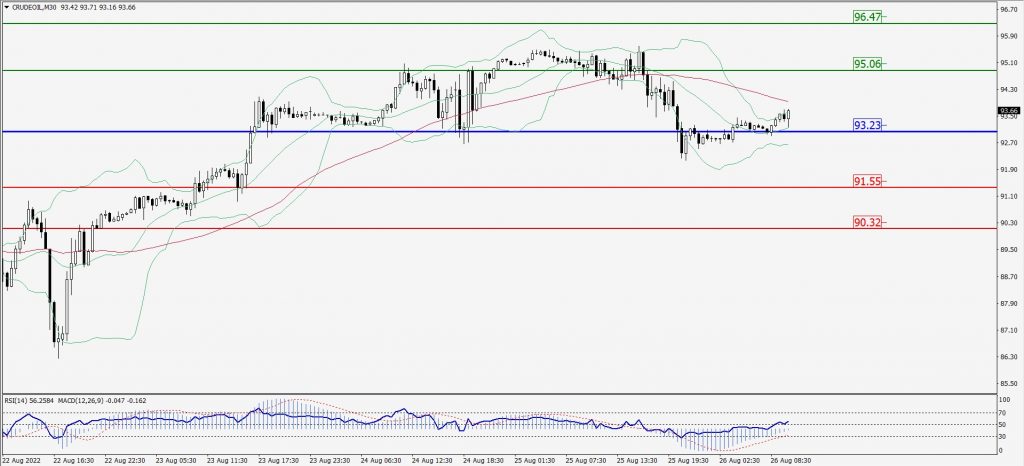
Green Lines Indicate Resistance Levels – Red Lines Indicate Support Levels
Light Blue is a Pivot Point – Black represents the price when the report was produced
XAU/USD Intraday: Trend on the downside
Our pivot point is 1757.70
Preferable Price Action: Further downside to 1747.10 and 1739.60
Alternative Price Action: If the price gives an upside breakout of a pivot, then the price extends to 1767.50 and 1775.70.
Comment: MACD is negative territory and Pairs below its 20MA & 55MA.
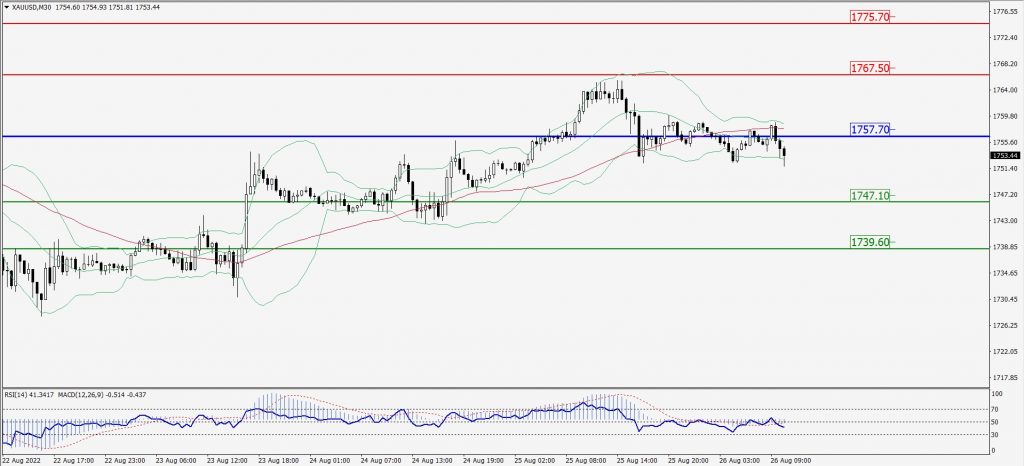
Green Lines Indicate Resistance Levels – Red Lines Indicate Support Levels
Light Blue is a Pivot Point – Black represents the price when the report was produced
Dow Jones Intraday: May trend reverse from 33,305.00
Our pivot point is 33,305.00
Preferable Price Action: Take sell positions below pivot with targets at 33,136.00 & 33,029.00.
Alternative Price Action: Above 33,305.00 looks for further upside to 33,449.00 & 33,571.00.
Comment: RSI at 50 levels and Pairs below 20MA.
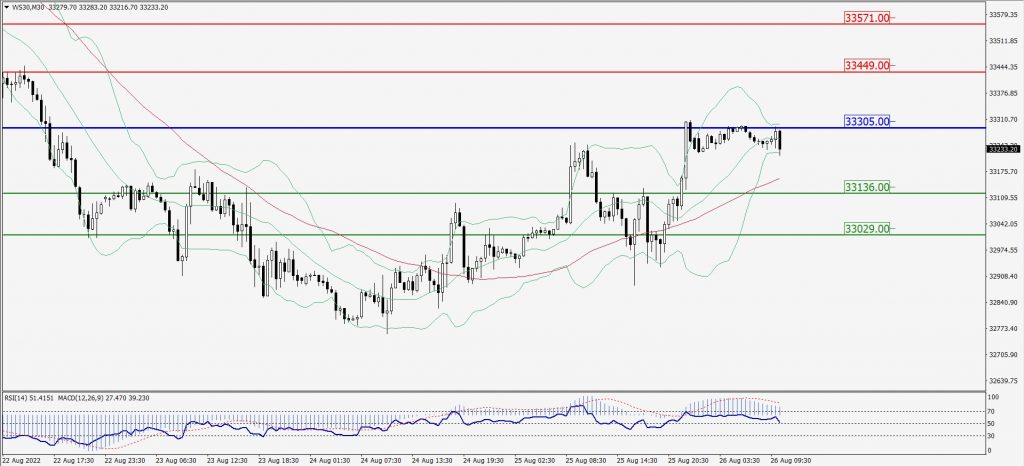
Green Lines Indicate Resistance Levels – Red Lines Indicate Support Levels
Light Blue is a Pivot Point – Black represents the price when the report was produced