Market Wrap: Stocks, Bonds, Commodities
Wall Street ended higher on Wednesday, lifted by gains in energy stocks and Intuit while investors awaited the US Federal Reserve’s Jackson Hole conference this week.
The Dow Jones Industrial Average rose 59.64 points to 32,969.23, the S&P 500 gain 12.04 points to 4,140.77 and the Nasdaq Composite add 50.23 points to 12,431.53.
MSCI’s index of Asia-Pacific stocks outside Japan is ascend 2.03% to 641.98 levels. Australian index higher 0.71% to 7,048.10. Japanese Nikkei Index ascend 0.58% to 28,479.01.
European stocks were positive on Thursday, with the Stoxx Europe 50 Index rose 0.77% to 3,695.65, Germany’s DAX advance 0.84% to 13,330.75, and France’s CAC ascend 0.68% to 6,430.92, and U.K.’s FTSE 100 surged 0.75% to 7,527.05.
Benchmark 10-year U.S. Treasury fell as demand for safe assets ascend again, today 10-year bond yields a negative 0.73% to 3.0840.
Oil prices rose in early Asian trade on Wednesday after Saudi Arabia suggested the Organization of the Petroleum Exporting Countries could consider cutting output, though bearish economic signals from central bankers and falling equities weighed.
Spot Brent crude oil add 0.64% to $101.88 per barrel. US West Texas Intermediate crude is up 0.36% to $95.25 a barrel.
The yellow metal gold is advance 0.80% to 1,775.55 dollars per ounce.
Market Wrap: Forex
The U.S. dollar eased lower in early European trade Thursday, but remained near a two-decade high ahead of the start of the Federal Reserve’s Jackson Hole gathering as traders look for more cues on monetary policy.
Today, the U.S. dollar index measures the Greenback against a trade-weighted basket of six major currencies, which is fell 0.39% to 108.190.
The Euro US Dollar (EUR/USD) is a widely traded pair that is up 0.34% today. This left the pair trading around $0.99990.
The Japanese yen was positive against the U.S. dollar on Thursday as the stock up. Today USD/JPY is drop 0.41% to 136.560 level.
Another commodity-related currency positive against the U.S dollar, AUD/USD gain 1.06% to 0.69780, and NZD/USD up 0.75 to 0.62340 level.
EUR/USD Intraday: Trend on the upside
Our pivot point is at 1.00060
Preferable Price Action: Take buy positions above pivot level with targets at 1.00560 & 1.00830 in extension.
Alternative Price Action: Below pivot looks for a further downside to 0.99650 & 0.99360.
Comment: RSI above 50 levels and Pairs above its 20MA & 55MA.
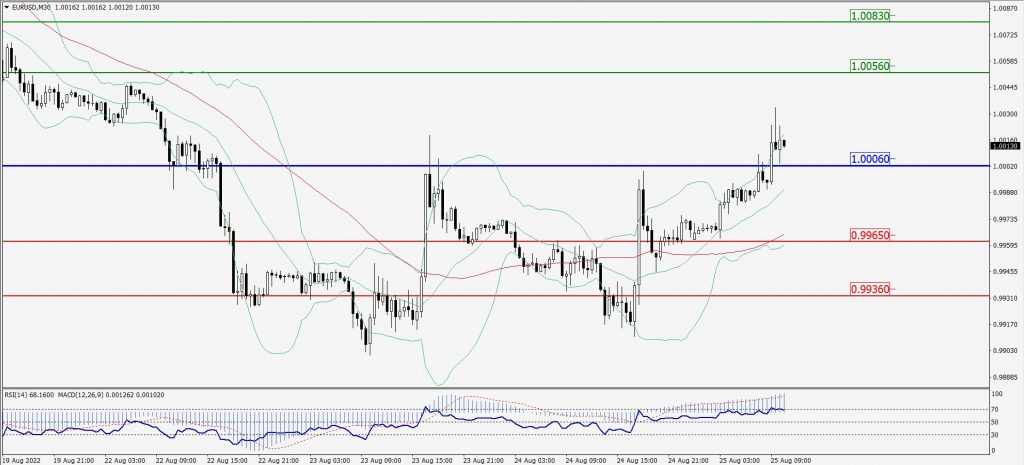
Green Lines Indicate Resistance Levels – Red Lines Indicate Support Levels
Light Blue is a Pivot Point – Black represents the price when the report was produced
GBP/USD Intraday: Support level at 1.18380
Our pivot point is at 1.18380
Preferable Price Action: Buy positions above pivot with targets at 1.19240 & 1.19740 in extension.
Alternative Price Action: The price below pivot would call for further downside to 1.17720 & 1.17230.
Comment: RSI above 50 levels and Pairs above its 20MA & 55MA.
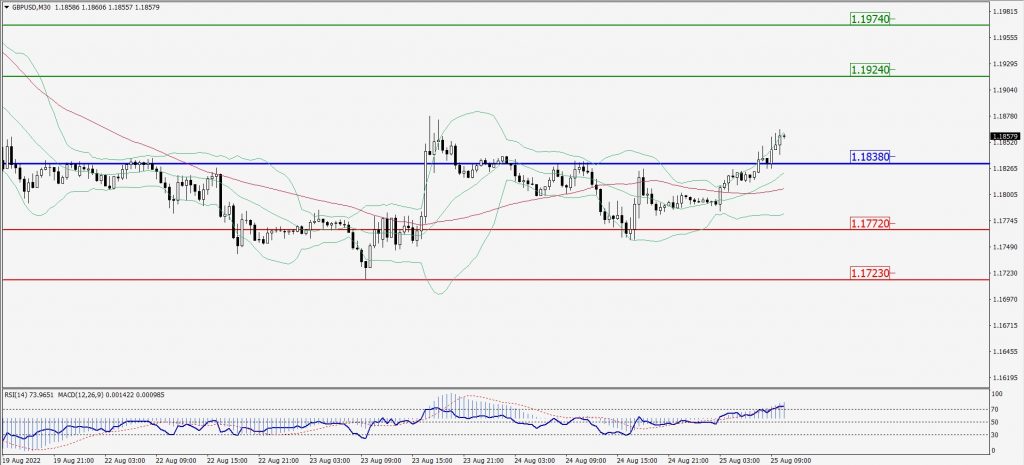
Green Lines Indicate Resistance Levels – Red Lines Indicate Support Levels
Light Blue is a Pivot Point – Black represents the price when the report was produced
USD/JPY Intraday: Trend on the downside
Our pivot point is at 136.750
Preferable Price Action: Sell position below pivot with the target at 136.190 and 135.770 in extension.
Alternative Price Action: The upside breakout of the pivot would call for 137.200 and 137.550.
Comment: MACD is negative territory and Pairs below its 20MA & 55MA.
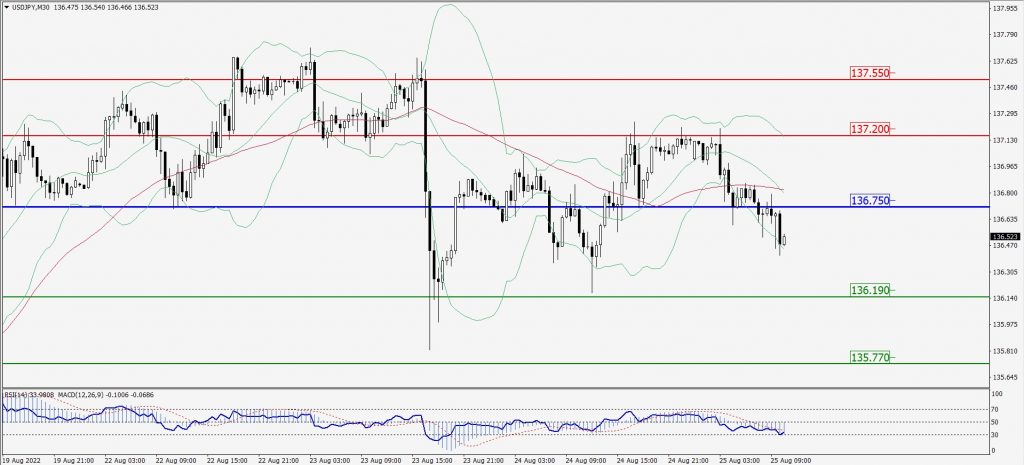
Green Lines Indicate Resistance Levels – Red Lines Indicate Support Levels
Light Blue is a Pivot Point – Black represents the price when the report was produced
AUD/USD Intraday: Major trend on the upside
Our pivot point is at 0.69700
Preferable Price Action: Buy Positions above pivot with targets at 0.70150 & 0.70500 in extension.
Alternative Price Action: Below pivot looks for a further downside with 0.69330 & 0.69010 as targets.
Comment: RSI above 50 levels and Pairs above its 20MA & 55MA.
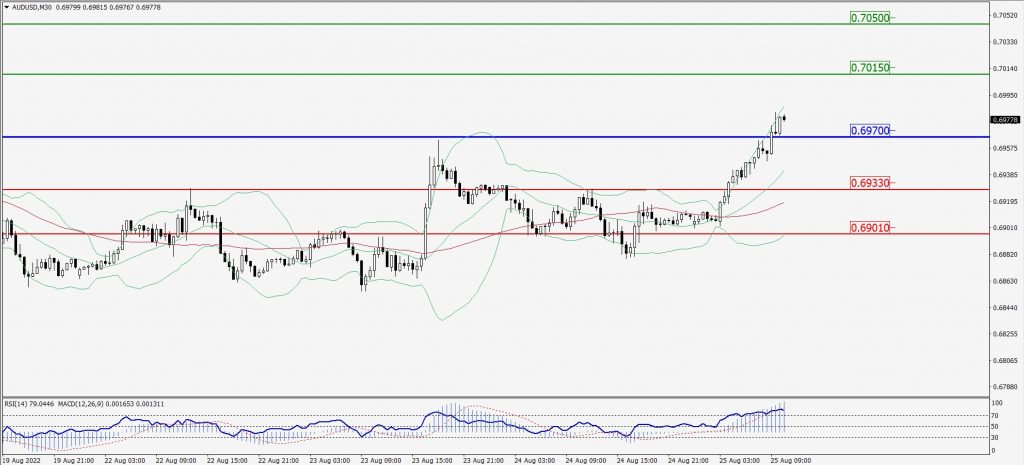
Green Lines Indicate Resistance Levels – Red Lines Indicate Support Levels
Light Blue is a Pivot Point – Black represents the price when the report was produced
CRUDEOIL Intraday: Trend on the upside
Our pivot point is at 94.93
Preferable Price Action: Above pivots buy oil with 96.95 & 98.64 as targets.
Alternative Price Action: Sell crude below pivot with targets at 93.12 and 91.63 in extension.
Comment: MACD is in the positive territory and Pairs above 55MA.
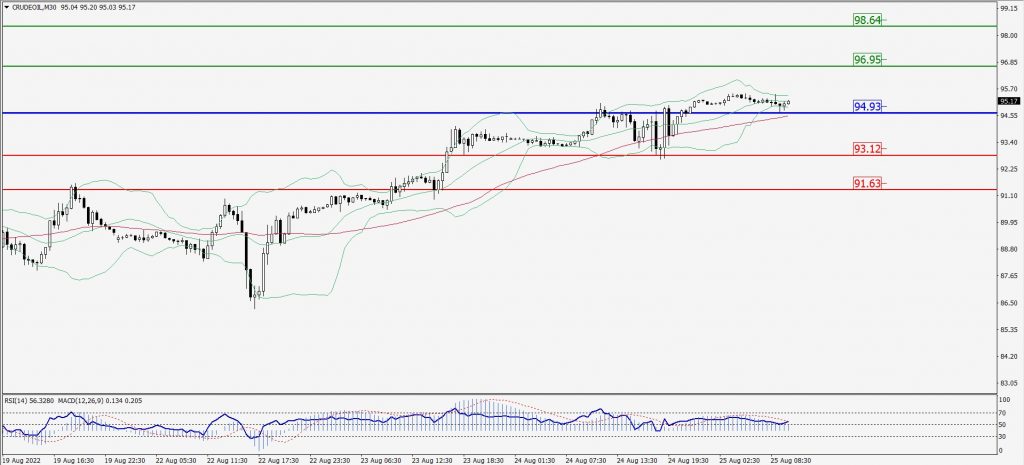
Green Lines Indicate Resistance Levels – Red Lines Indicate Support Levels
Light Blue is a Pivot Point – Black represents the price when the report was produced
XAU/USD Intraday: Trend on the upside
Our pivot point is 1759.20
Preferable Price Action: Further upside to 1771.40 and 1780.60
Alternative Price Action: If the price gives a downside breakout of a pivot, then the price extends to 1749.10 and 1741.20.
Comment: MACD is positive territory and Pairs above its 20MA & 55MA.
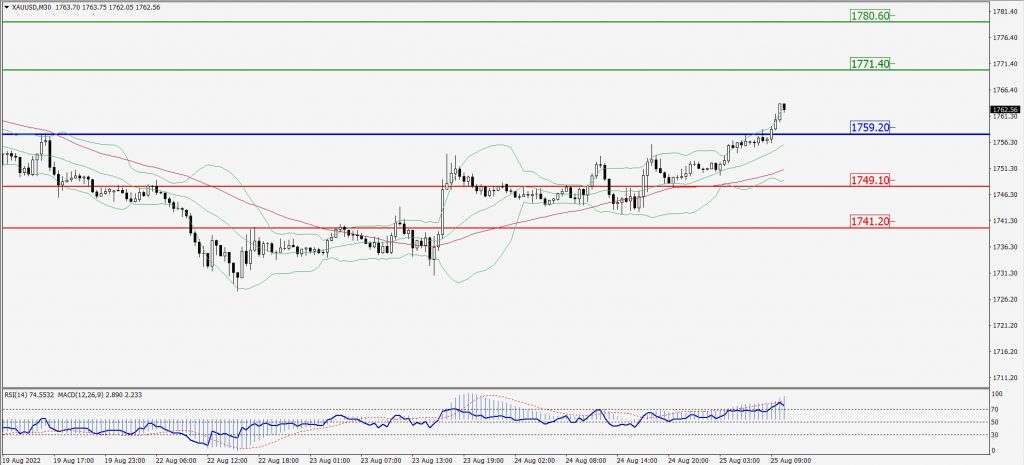
Green Lines Indicate Resistance Levels – Red Lines Indicate Support Levels
Light Blue is a Pivot Point – Black represents the price when the report was produced
Dow Jones Intraday: Support level at 33,120.00
Our pivot point is 33,120.00
Preferable Price Action: Take buy positions above pivot with targets at 33,380.00 & 33,562.00.
Alternative Price Action: Below 33,120.00 looks for further upside to 32,906.00 & 32,710.00.
Comment: RSI above 50 levels and Pairs above its 20MA & 55MA.
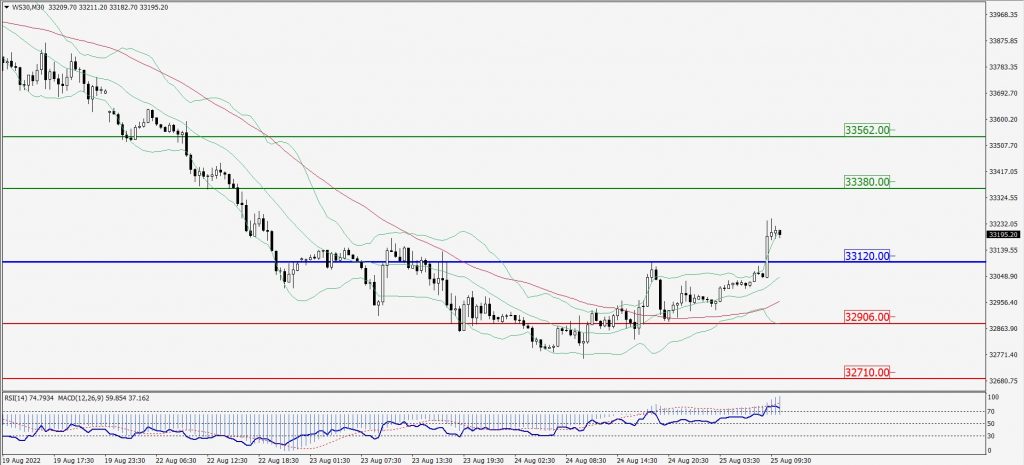
Green Lines Indicate Resistance Levels – Red Lines Indicate Support Levels
Light Blue is a Pivot Point – Black represents the price when the report was produced