Market Wrap: Stocks, Bonds, Commodities
Wall Street ended down on Tuesday as investors focused on data showing a slowing economy ahead of a US Federal Reserve gathering later this week in Jackson Hole, Wyoming.
The Dow Jones Industrial Average fell 154.02 points to 32,909.59, the S&P 500 lose 9.26 points to 4,128.73 and the Nasdaq Composite subtract 0.27 points to 12,381.30.
MSCI’s index of Asia-Pacific stocks outside Japan is drop 0.80% to 627.72 levels. Australian index higher 0.52% to 6,998.10. Japanese Nikkei Index drop 0.49% to 28,313.47.
European stocks were negative on Wednesday, with the Stoxx Europe 50 Index fell 0.17% to 3,646.45, Germany’s DAX decline 0.28% to 13,156.85, and France’s CAC drop 0.20% to 6,349.42, and U.K.’s FTSE 100 sliped 0.55% to 7,447.72.
Benchmark 10-year U.S. Treasury fell as demand for safe assets ascend again, today 10-year bond yields a negative 0.44% to 3.0410.
Oil prices surged by nearly 4 percent on Tuesday after Saudi Arabia floated the idea of OPEC+ output cuts to support prices in the case of returning Iranian crude and with the prospect of a drop in US inventories.
Spot Brent crude oil add 1.11% to $101.31 per barrel. US West Texas Intermediate crude is up 1.05% to $94.72 a barrel.
The yellow metal gold is decline 0.01% to 1,760.85 dollars per ounce.
Market Wrap: Forex
The U.S. dollar steadied just below recent peaks on Wednesday, as investors waited to hear from the Federal Reserve and pondered whether weak U.S. data may slow the pace of rate hikes.
Today, the U.S. dollar index measures the Greenback against a trade-weighted basket of six major currencies, which is rose 0.05% to 108.610.
The Euro US Dollar (EUR/USD) is a widely traded pair that is down 0.20% today. This left the pair trading around $0.99470.
The Japanese yen was positive against the U.S. dollar on Wednesday as the stock up. Today USD/JPY is drop 0.19% to 136.510 level.
Another commodity-related currency negative against the U.S dollar, AUD/USD lose 0.13% to 0.69200, and NZD/USD down 0.27 to 0.61950 level.
EUR/USD Intraday: Trend on the downside
Our pivot point is at 0.99800
Preferable Price Action: Take sell positions below pivot level with targets at 0.98860 & 0.98200 in extension.
Alternative Price Action: Above pivot looks for a further upside to 1.00530 & 1.01160.
Comment: RSI below 50 levels.
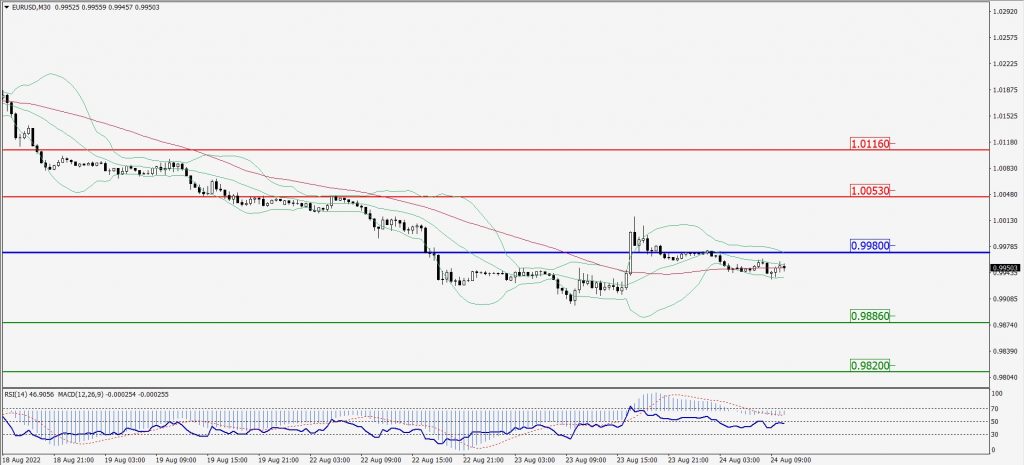
Green Lines Indicate Resistance Levels – Red Lines Indicate Support Levels
Light Blue is a Pivot Point – Black represents the price when the report was produced
GBP/USD Intraday: Support level at 1.18120
Our pivot point is at 1.18120
Preferable Price Action: Buy positions above pivot with targets at 1.18730 & 1.19250 in extension.
Alternative Price Action: The price below pivot would call for further downside to 1.17590 & 1.17060.
Comment: RSI above 50 levels and Pairs above its 20MA & 55MA.
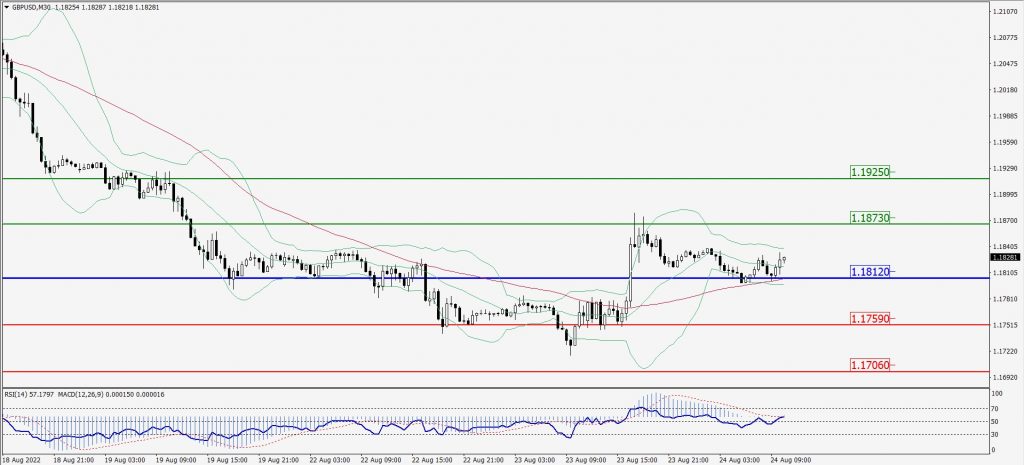
Green Lines Indicate Resistance Levels – Red Lines Indicate Support Levels
Light Blue is a Pivot Point – Black represents the price when the report was produced
USD/JPY Intraday: Trend on the downside
Our pivot point is at 136.930
Preferable Price Action: Sell position below pivot with the target at 136.150 and 135.660 in extension.
Alternative Price Action: The upside breakout of the pivot would call for 137.590 and 138.100.
Comment: MACD is negative territory and Pairs below its 20MA & 55MA.
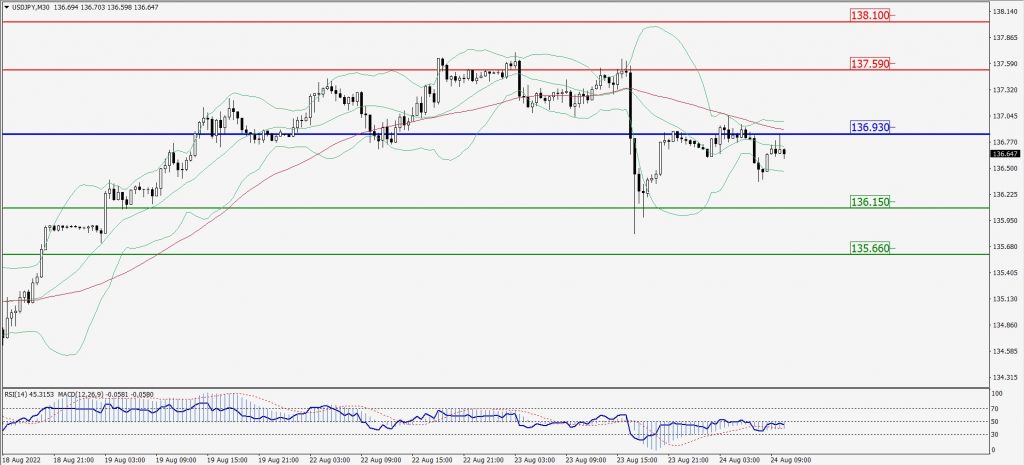
Green Lines Indicate Resistance Levels – Red Lines Indicate Support Levels
Light Blue is a Pivot Point – Black represents the price when the report was produced
AUD/USD Intraday: Trend on the upside
Our pivot point is at 0.69060
Preferable Price Action: Buy Positions above pivot with targets at 0.69490 & 0.69770 in extension.
Alternative Price Action: Below pivot looks for a further downside with 0.68730 & 0.68490 as targets.
Comment: RSI above 50 levels and Pairs above its 20MA & 55MA.
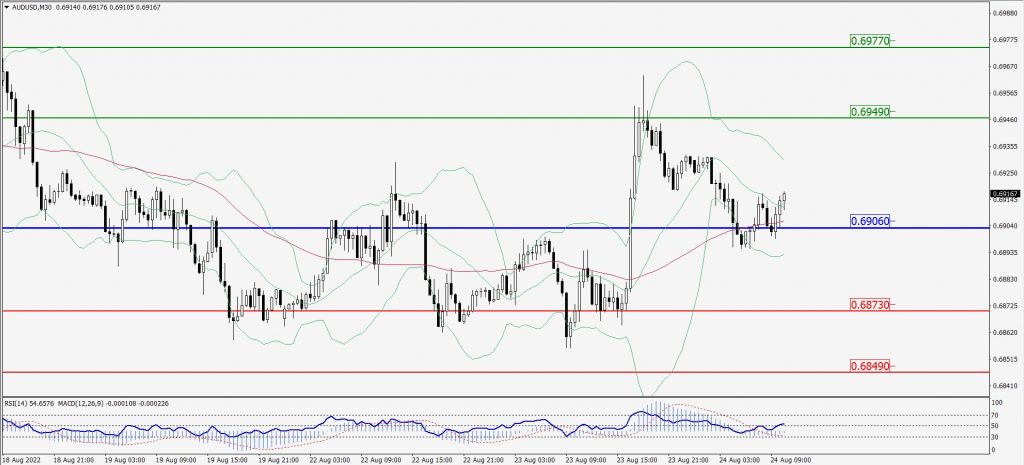
Green Lines Indicate Resistance Levels – Red Lines Indicate Support Levels
Light Blue is a Pivot Point – Black represents the price when the report was produced
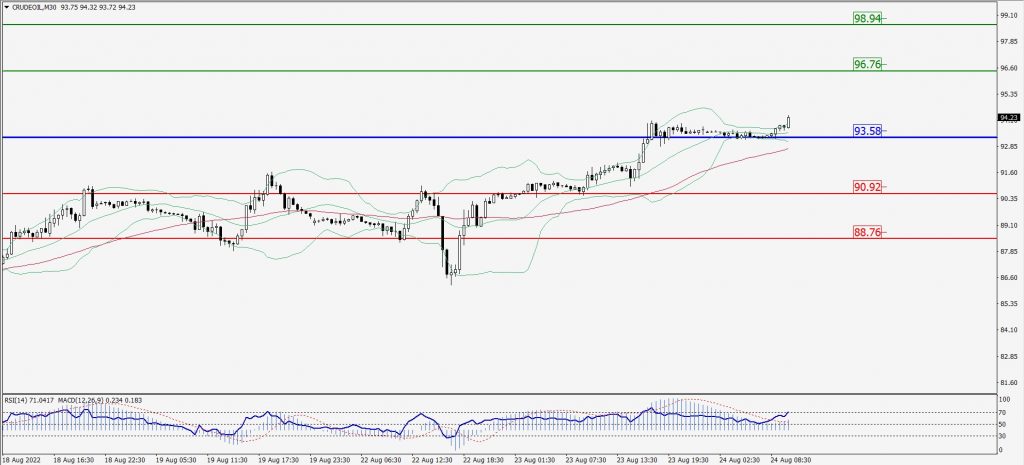
CRUDEOIL Intraday: Major support level at 93.58
Our pivot point is at 93.58
Preferable Price Action: Above pivots buy oil with 96.76 & 98.94 as targets.
Alternative Price Action: Sell crude below pivot with targets at 90.92 and 88.76 in extension.
Comment: MACD is in the positive territory and Pairs above its 20MA & 55MA.
Green Lines Indicate Resistance Levels – Red Lines Indicate Support Levels
Light Blue is a Pivot Point – Black represents the price when the report was produced
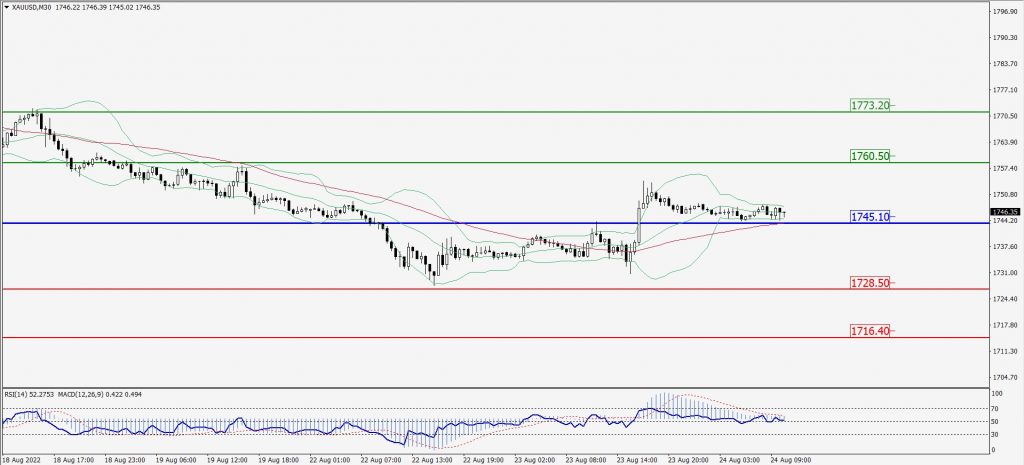
XAU/USD Intraday: Trend on the upside
Our pivot point is 1745.10
Preferable Price Action: Further upside to 1760.50 and 1773.20
Alternative Price Action: If the price gives a downside breakout of a pivot, then the price extends to 1728.50 and 1716.40.
Comment: MACD is positive territory and Pairs above 55MA.
Green Lines Indicate Resistance Levels – Red Lines Indicate Support Levels
Light Blue is a Pivot Point – Black represents the price when the report was produced
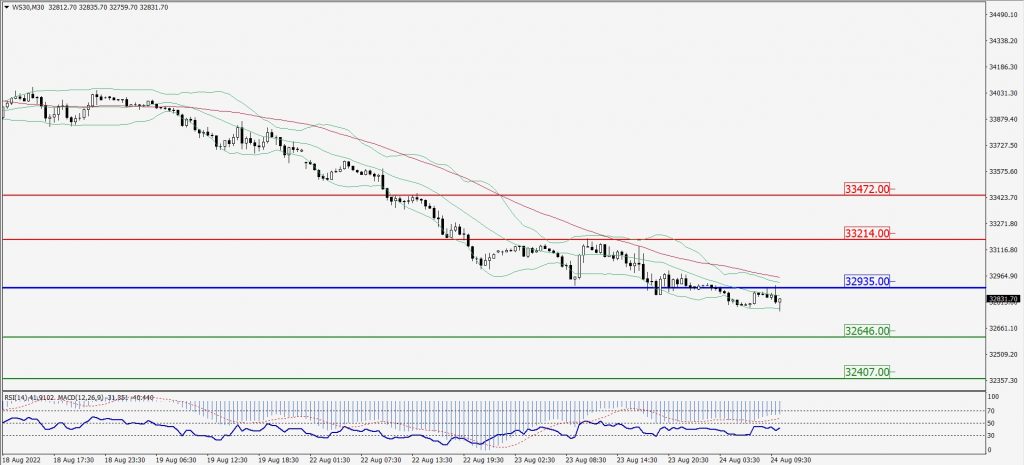
Dow Jones Intraday: Trend on the downside
Our pivot point is 32,935.00
Preferable Price Action: Take sell positions below pivot with targets at 32,646.00 & 32,407.00.
Alternative Price Action: Above 32,935.00 looks for further upside to 33,214.00 & 33,472.00.
Comment: RSI below 50 levels and Pairs below its 20MA & 55MA.
Green Lines Indicate Resistance Levels – Red Lines Indicate Support Levels
Light Blue is a Pivot Point – Black represents the price when the report was produced