Market Wrap: Stocks, Bonds, Commodities
Wall Street ended sharply lower on Monday as investors fretted about a US Federal Reserve gathering later this week in Jackson Hole, Wyoming, that is expected to reinforce a strong commitment by the central bank to stamp out inflation.
The Dow Jones Industrial Average fell 643.13 points to 33,063.61, the S&P 500 lose 90.49 points to 4,137.99 and the Nasdaq Composite subtract 323.64 points to 12,381.57.
MSCI’s index of Asia-Pacific stocks outside Japan is drop 0.88% to 631.14 levels. Australian index lower 1.21% to 6,961.80. Japanese Nikkei Index drop 1.19% to 28,452.75.
European stocks were positive on Tuesday, with the Stoxx Europe 50 Index rose 0.40% to 3,672.75, Germany’s DAX advance 0.48% to 13,294.07, and France’s CAC ascend 0.35% to 6,400.82, and U.K.’s FTSE 100 sliped 0.19% to 7,519.90.
Benchmark 10-year U.S. Treasury fell as demand for safe assets ascend again, today 10-year bond yields a negative 1.10% to 3.0020.
Oil prices edged up on Tuesday, after Saudi Arabia warned that OPEC could cut output to correct a recent drop in oil futures.
Spot Brent crude oil add 0.78% to $97.25 per barrel. US West Texas Intermediate crude is up 1.11% to $91.36 a barrel.
The yellow metal gold is advance 0.20% to 1,751.85 dollars per ounce.
Market Wrap: Forex
The U.S. dollar pushed higher Tuesday ahead of the central bank’s key Jackson Hole symposium later this week, while the euro fell to two-decade lows as Europe’s energy woes deepened.
Today, the U.S. dollar index measures the Greenback against a trade-weighted basket of six major currencies, which is fell 0.07% to 108.900.
The Euro US Dollar (EUR/USD) is a widely traded pair that is down 0.10% today. This left the pair trading around $0.99320.
The Japanese yen was positive against the U.S. dollar on Tuesday as the stock up. Today USD/JPY is drop 0.18% to 137.230 level.
Another commodity-related currency positive against the U.S dollar, AUD/USD gain 0.20% to 0.68890, and NZD/USD up 0.36 to 0.61890 level.
EUR/USD Intraday: Trend on the downside
Our pivot point is at 0.99560
Preferable Price Action: Take sell positions below pivot level with targets at 0.98680 & 0.98010 in extension.
Alternative Price Action: Above pivot looks for a further upside to 1.00370 & 1.01020.
Comment: RSI below 50 levels and Pairs below its 20MA & 55MA.
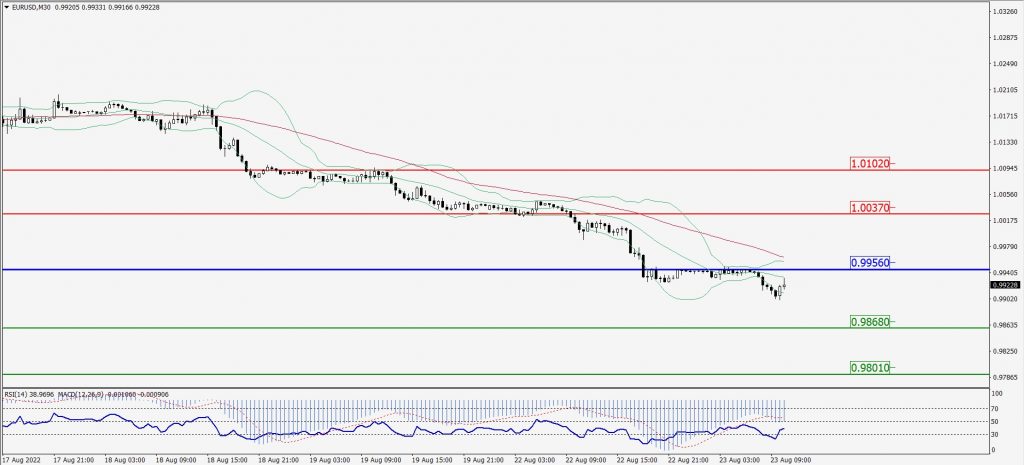
Green Lines Indicate Resistance Levels – Red Lines Indicate Support Levels
Light Blue is a Pivot Point – Black represents the price when the report was produced
GBP/USD Intraday: Resistance level at 1.17970
Our pivot point is at 1.17970
Preferable Price Action: Sell positions below pivot with targets at 1.16770 & 1.15930 in extension.
Alternative Price Action: The price above pivot would call for further upside to 1.18910 & 1.19740.
Comment: RSI below 50 levels and Pairs below 55MA.
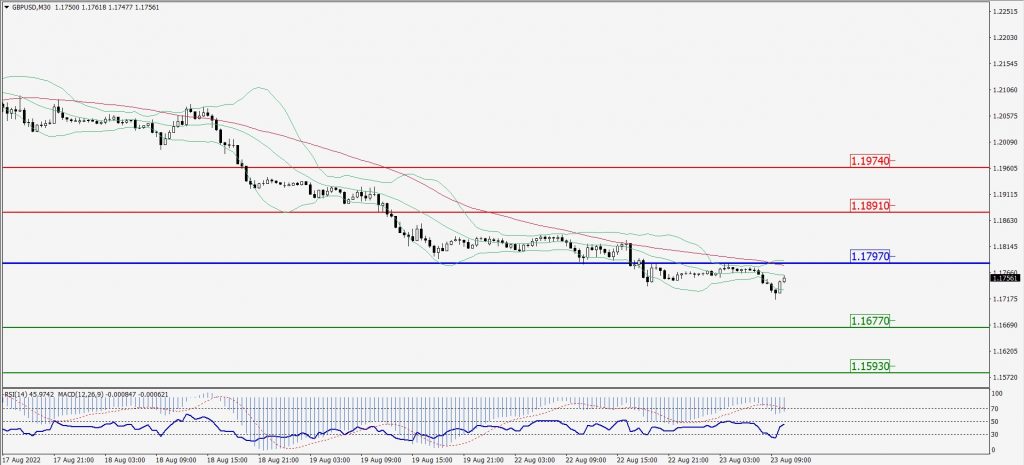
Green Lines Indicate Resistance Levels – Red Lines Indicate Support Levels
Light Blue is a Pivot Point – Black represents the price when the report was produced
USD/JPY Intraday: Trend on the downside
Our pivot point is at 137.660
Preferable Price Action: Sell position below pivot with the target at 136.790 and 136.210 in extension.
Alternative Price Action: The upside breakout of the pivot would call for 138.340 and 138.830.
Comment: MACD is negative territory.
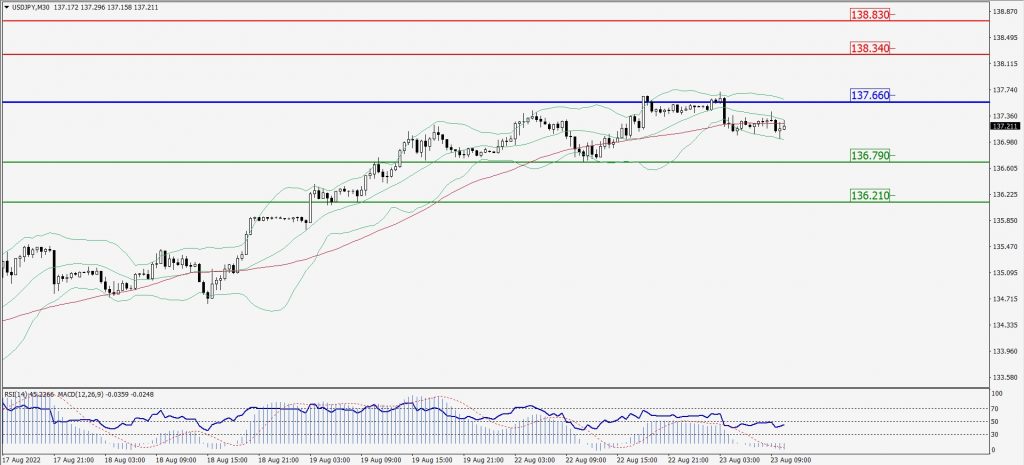
Green Lines Indicate Resistance Levels – Red Lines Indicate Support Levels
Light Blue is a Pivot Point – Black represents the price when the report was produced
AUD/USD Intraday: Trend on the downside
Our pivot point is at 0.69110
Preferable Price Action: Sell Positions below pivot with targets at 0.68190 & 0.67560 in extension.
Alternative Price Action: Above pivot looks for a further upside with 0.69930 & 0.70550 as targets.
Comment: RSI below 50 levels and Pairs below its 20MA & 55MA.
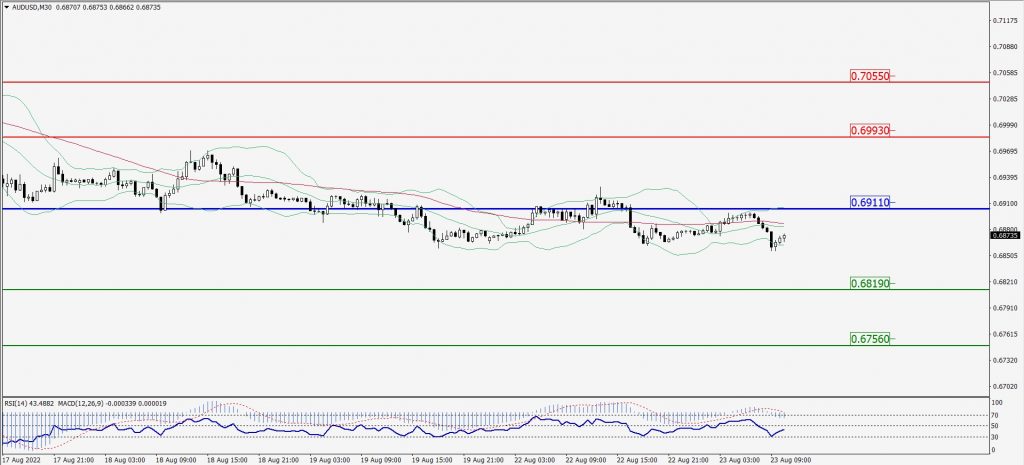
Green Lines Indicate Resistance Levels – Red Lines Indicate Support Levels
Light Blue is a Pivot Point – Black represents the price when the report was produced
CRUDEOIL Intraday: Support level at 90.92
Our pivot point is at 90.92
Preferable Price Action: Above pivots buy oil with 93.58 & 95.40 as targets.
Alternative Price Action: Sell crude below pivot with targets at 88.71 and 86.89 in extension.
Comment: MACD is in the positive territory and Pairs above its 20MA & 55MA.
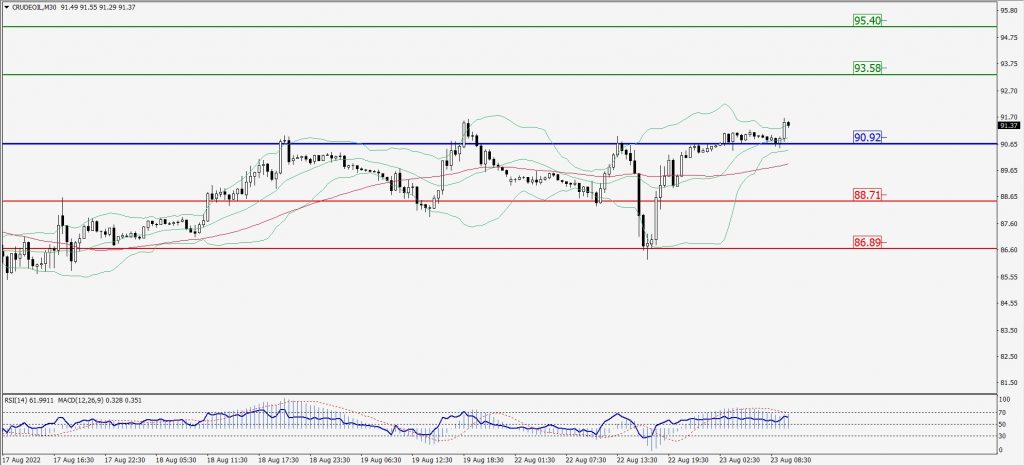
Green Lines Indicate Resistance Levels – Red Lines Indicate Support Levels
Light Blue is a Pivot Point – Black represents the price when the report was produced
XAU/USD Intraday: Major trend on the downside
Our pivot point is 1745.10
Preferable Price Action: Further downside to 1728.50 and 1716.40
Alternative Price Action: If the price gives an upside breakout of a pivot, then the price extends to 1760.50 and 1773.20.
Comment: MACD is flat territory.
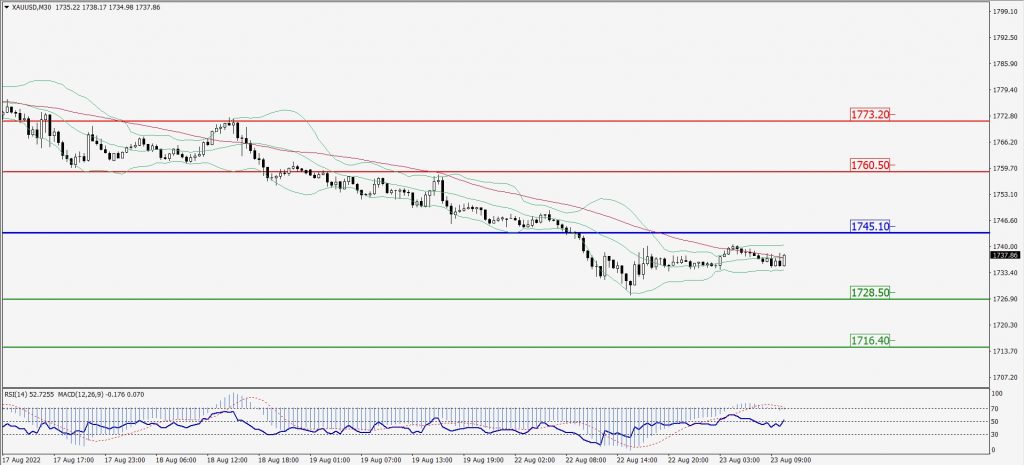
Green Lines Indicate Resistance Levels – Red Lines Indicate Support Levels
Light Blue is a Pivot Point – Black represents the price when the report was produced
Dow Jones Intraday: In a consolidation zone
Our pivot point is 33,223.00
Preferable Price Action: Take sell positions below pivot with targets at 32,880.00 & 32,647.00.
Alternative Price Action: Above 33,223.00 looks for further upside to 33,527.00 & 33,780.00.
Comment: RSI at 50 levels and Pairs below 55MA.
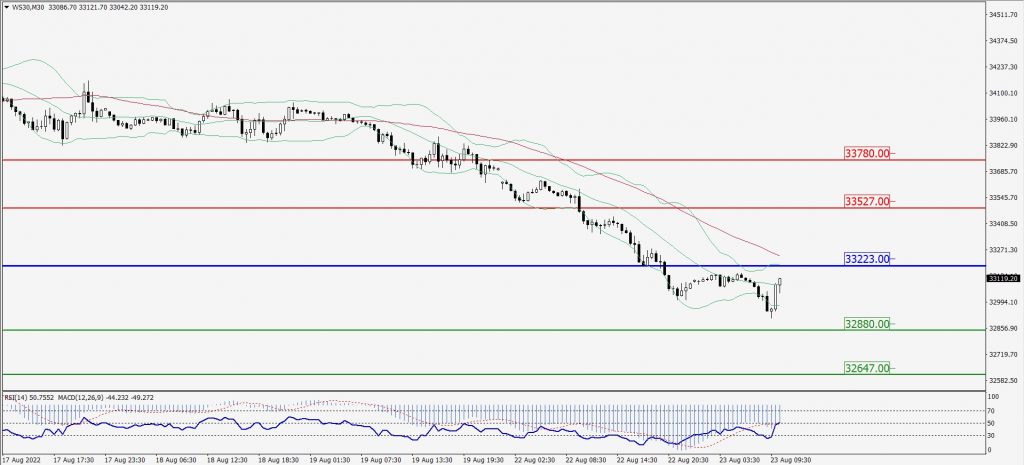
Green Lines Indicate Resistance Levels – Red Lines Indicate Support Levels
Light Blue is a Pivot Point – Black represents the price when the report was produced