Market Wrap: Stocks, Bonds, Commodities
Wall Street equities rallied and the dollar tumbled after signs of sharply decelerating U.S. inflation prompted bets that the Federal Reserve would raise interest rates at a slower pace than previously expected.
The Dow Jones Industrial Average rose 535.10 points to 33,309.51, the S&P 500 gain 87.77 points to 4,210.24 and the Nasdaq Composite add 360.88 points to 12,854.80.
MSCI’s index of Asia-Pacific stocks outside Japan is ascend 1.86% to 649.19 levels. Australian index higher 1.12% to 7,071.00. Japanese Nikkei Index drop 0.65% to 27,819.33.
European stocks were positive on Thursday, with the Stoxx Europe 50 Index rose 0.02% to 3,749.95, Germany’s DAX decline 0.21% to 13,674.24, and France’s CAC ascend 0.16% to 6,534.44, and U.K.’s FTSE 100 sliped 0.05% to 7,504.65.
Benchmark 10-year U.S. Treasury fell as demand for safe assets ascend again, today 10-year bond yields a negative 0.53% to 2.7660.
Oil prices rose on Wednesday, rebounding from losses early in the session, helped by encouraging figures on U.S. gasoline demand and as lower-than-expected US inflation data drove investors into riskier assets.
Spot Brent crude oil add 0.13% to $97.48 per barrel. US West Texas Intermediate crude is up 0.11% to $92.03 a barrel.
The yellow metal gold is decline 0.61% to 1,803.85 dollars per ounce.
Market Wrap: Forex
The dollar made up some losses on Thursday after a steep drop the previous day on softer than expected inflation data out of the U.S.
Today, the U.S. dollar index measures the Greenback against a trade-weighted basket of six major currencies, which is fell 0.21% to 104.860.
The Euro US Dollar (EUR/USD) is a widely traded pair that is up 0.30% today. This left the pair trading around $1.03280.
The Japanese yen was positive against the U.S. dollar on Thursday as the stock up. Today USD/JPY is drop 0.23% to 132.560 level.
Another commodity-related currency positive against the U.S dollar, AUD/USD gain 0.31% to 0.70980, and NZD/USD up 0.37 to 0.64250 level.
EUR/USD Intraday: Trend on the upside
Our pivot point is at 1.03120
Preferable Price Action: Take buy positions above pivot level with targets at 1.03870 & 1.04380 in extension.
Alternative Price Action: Below pivot looks for a further downside to 1.02510 & 1.02040.
Comment: RSI above 50 levels and Pairs above its 20MA & 55MA.
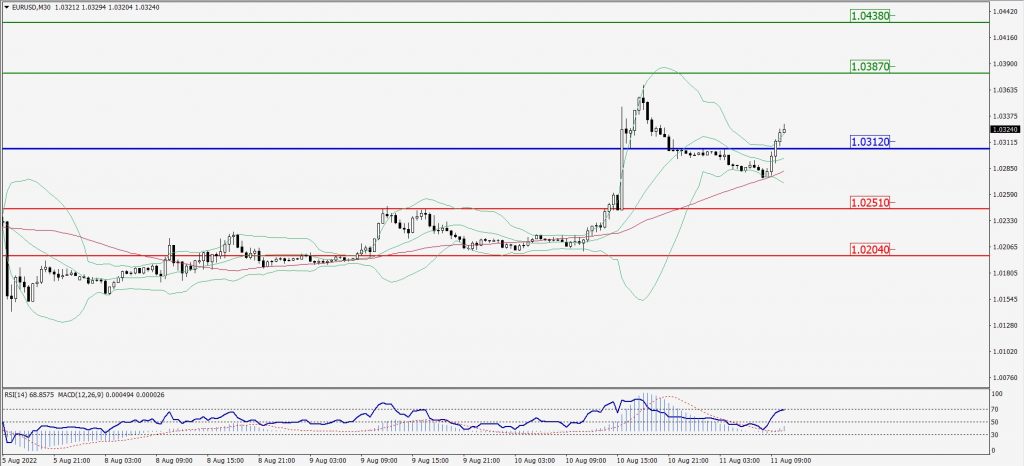
Green Lines Indicate Resistance Levels – Red Lines Indicate Support Levels
Light Blue is a Pivot Point – Black represents the price when the report was produced
GBP/USD Intraday: Trend on the upside
Our pivot point is at 1.22040
Preferable Price Action: Buy positions above pivot with targets at 1.22850 & 1.23470 in extension.
Alternative Price Action: The price below pivot would call for further downside to 1.21380 & 1.20830.
Comment: RSI above 50 levels and Pairs above its 20MA & 55MA.
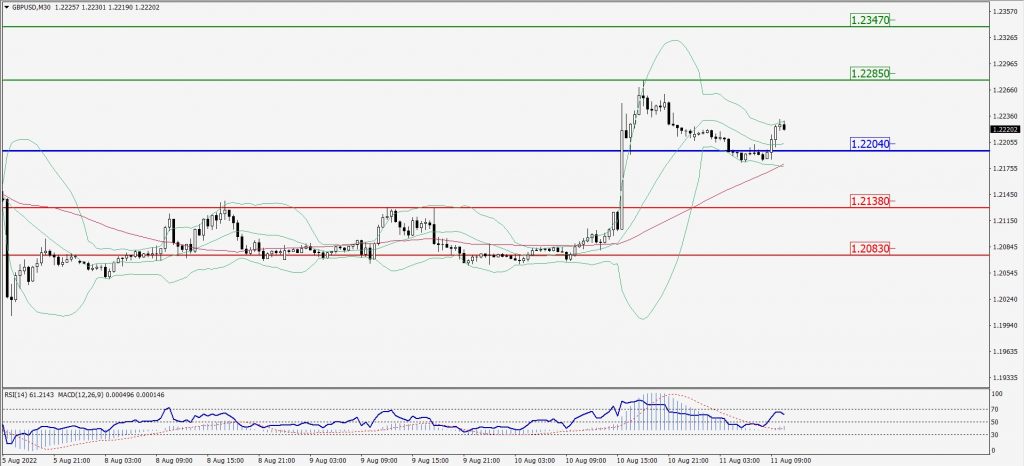
Green Lines Indicate Resistance Levels – Red Lines Indicate Support Levels
Light Blue is a Pivot Point – Black represents the price when the report was produced
USD/JPY Intraday: Trend on the downside
Our pivot point is at 132.840
Preferable Price Action: Sell position below pivot with the target at 132.080 and 131.500 in extension.
Alternative Price Action: The upside breakout of the pivot would call for 133.520 and 134.160.
Comment: MACD is negative territory and Pairs below its 20MA & 55MA.
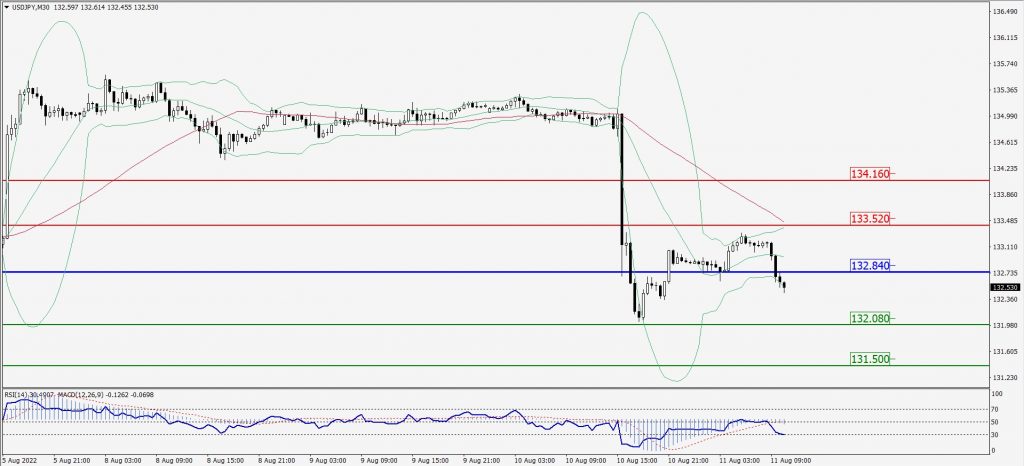
Green Lines Indicate Resistance Levels – Red Lines Indicate Support Levels
Light Blue is a Pivot Point – Black represents the price when the report was produced
AUD/USD Intraday: Support level at 0.70800
Our pivot point is at 0.70800
Preferable Price Action: Buy Positions above pivot with targets at 0.71520 & 0.71970 in extension.
Alternative Price Action: Below pivot looks for a further downside with 0.70200 & 0.69750 as targets.
Comment: RSI above 50 levels and Pairs above its 20MA & 55MA.
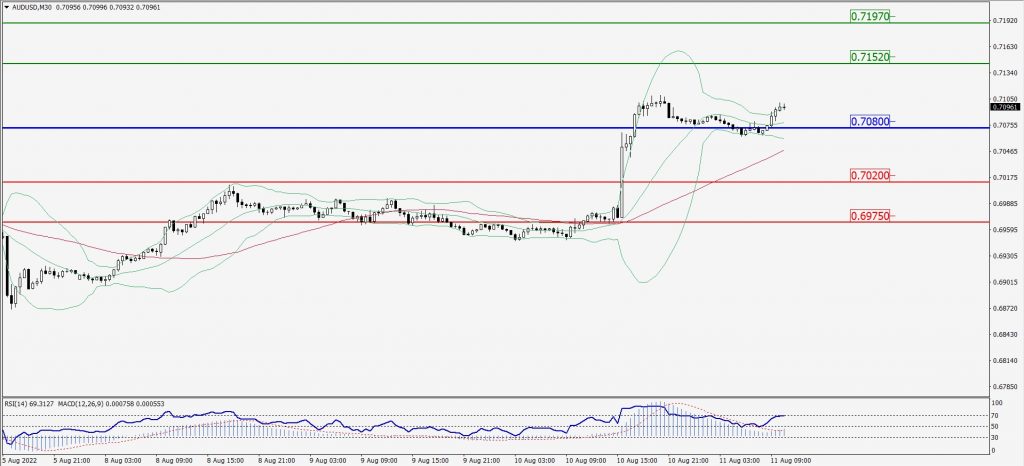
Green Lines Indicate Resistance Levels – Red Lines Indicate Support Levels
Light Blue is a Pivot Point – Black represents the price when the report was produced
CRUDEOIL Intraday: Resistance level at 91.72
Our pivot point is at 91.72
Preferable Price Action: Below pivots sell oil with 88.70 & 86.78 as targets.
Alternative Price Action: Buy crude above pivot with targets at 94.56 and 96.52 in extension.
Comment: MACD is in the negative territory and Pairs below 20MA.
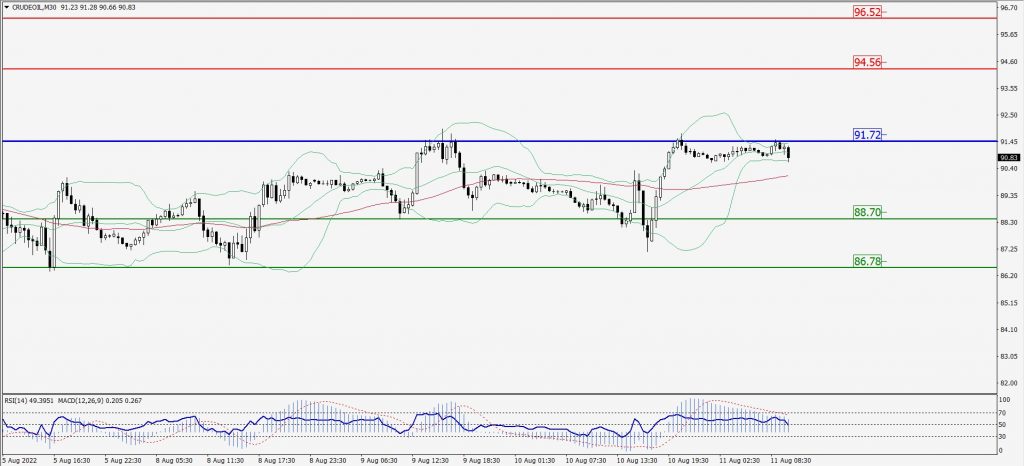
Green Lines Indicate Resistance Levels – Red Lines Indicate Support Levels
Light Blue is a Pivot Point – Black represents the price when the report was produced
XAU/USD Intraday: Trend on the downside
Our pivot point is 1791.00
Preferable Price Action: Further downside to 1771.60 and 1757.70
Alternative Price Action: If the price gives an upside breakout of a pivot, then the price extends to 1808.00 and 1823.00.
Comment: MACD is negative territory and Pairs below 55MA.
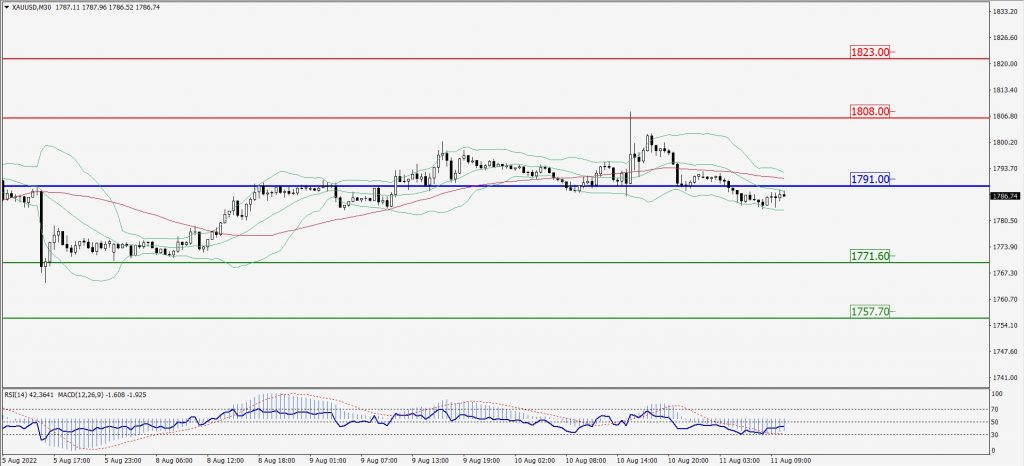
Green Lines Indicate Resistance Levels – Red Lines Indicate Support Levels
Light Blue is a Pivot Point – Black represents the price when the report was produced
Dow Jones Intraday: Trend on the upside
Our pivot point is 33,294.00
Preferable Price Action: Take buy positions above pivot with targets at 33,616.00 & 33,843.00.
Alternative Price Action: Below 33,294.00 looks for further downside to 33,022.00 & 32,808.00.
Comment: RSI above 50 levels and Pairs above 55MA.
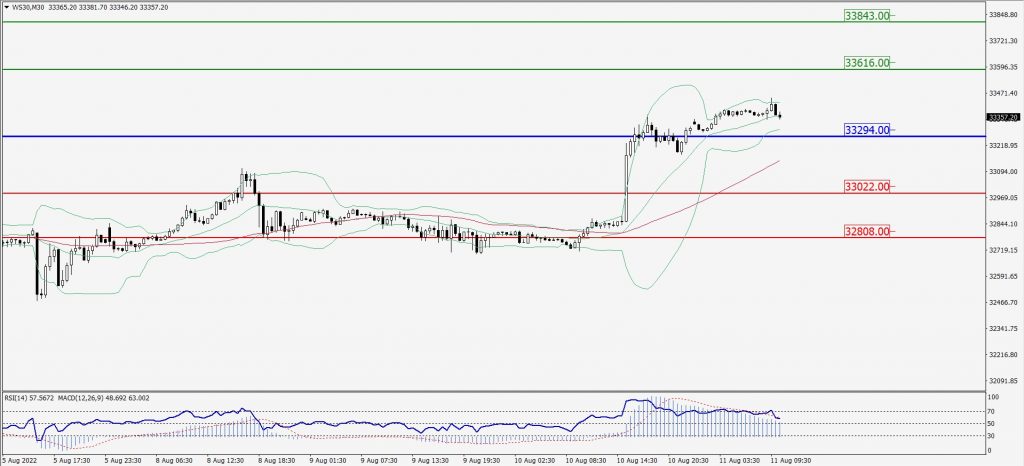
Green Lines Indicate Resistance Levels – Red Lines Indicate Support Levels
Light Blue is a Pivot Point – Black represents the price when the report was produced