Market Wrap: Stocks, Bonds, Commodities
The S&P 500 pared early losses to close modestly lower on Thursday after investors digested disappointing quarterly results from two large US banks and hotter-than-expected inflation data.
The Dow Jones Industrial Average fell 142.62 points to 30,630.17, the S&P 500 lose 11.40 points to 3,790.38 and the Nasdaq Composite add 3.60 points to 11,251.18.
MSCI’s index of Asia-Pacific stocks outside Japan is drop 0.86% to 628.20 levels. Australian index lower 0.68% to 6,605.60. Japanese Nikkei Index ascend 0.54% to 26,788.47.
European stocks were positive on Friday, with the Stoxx Europe 50 Index rose 0.81% to 3,425.25, Germany’s DAX advance 1.32% to 12,684.07, and France’s CAC ascend 0.41% to 5,939.64, and U.K.’s FTSE 100 surge 0.66% to 7,090.20.
Benchmark 10-year U.S. Treasury fell as demand for safe assets ascend again, today 10-year bond yields a negative 0.67% to 2.9390.
“Oil is trading very much to the beat of Federal Reserve policy and the implications it could have on both demand destruction and the U.S. dollar,” said Stephen Innes, managing partner at SPI Asset Management.
Spot Brent crude oil subtract 0.47% to $98.64 per barrel. US West Texas Intermediate crude is down 0.75% to $95.06 a barrel.
The yellow metal gold is decline 0.31% to 1,700.45 dollars per ounce.
Market Wrap: Forex
The dollar hovered below a near two-decade high in Asian trading on Friday, having slipped overnight after two Federal Reserve policymakers said they favoured a smaller rate rise than the 100 basis points (bps) that investors were betting on.
Today, the U.S. dollar index measures the Greenback against a trade-weighted basket of six major currencies, which is rose 0.03% to 108.435.
The Euro US Dollar (EUR/USD) is a widely traded pair that is up 0.11% today. This left the pair trading around $1.00260.
The Japanese yen was positive against the U.S. dollar on Friday as the stock up. Today USD/JPY is drop 0.04% to 138.850 level.
Another commodity-related currency negative against the U.S dollar, AUD/USD lose 0.40% to 0.67210, and NZD/USD down 0.16 to 0.61190 level.
EUR/USD Intraday: In a consolidation zone
Our pivot point is at 1.00200
Preferable Price Action: Take buy positions above pivot level with targets at 1.00870 & 1.01290 in extension.
Alternative Price Action: Below pivot looks for a further downside to 0.99660 & 0.99270.
Comment: RSI at 50 levels and Pair above 55MA.
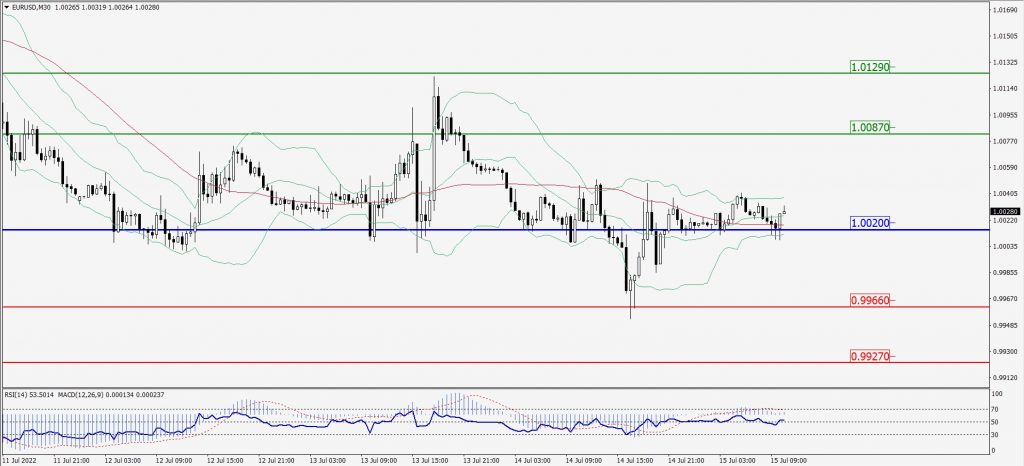
Green Lines Indicate Resistance Levels – Red Lines Indicate Support Levels
Light Blue is a Pivot Point – Black represents the price when the report was produced
GBP/USD Intraday: Trend on the upside
Our pivot point is at 1.18290
Preferable Price Action: Buy positions above pivot with targets at 1.18960 & 1.19350 in extension.
Alternative Price Action: The price below pivot would call for further downside to 1.17700 & 1.17300.
Comment: RSI above 50 levels and pair above its 20MA & 55MA.
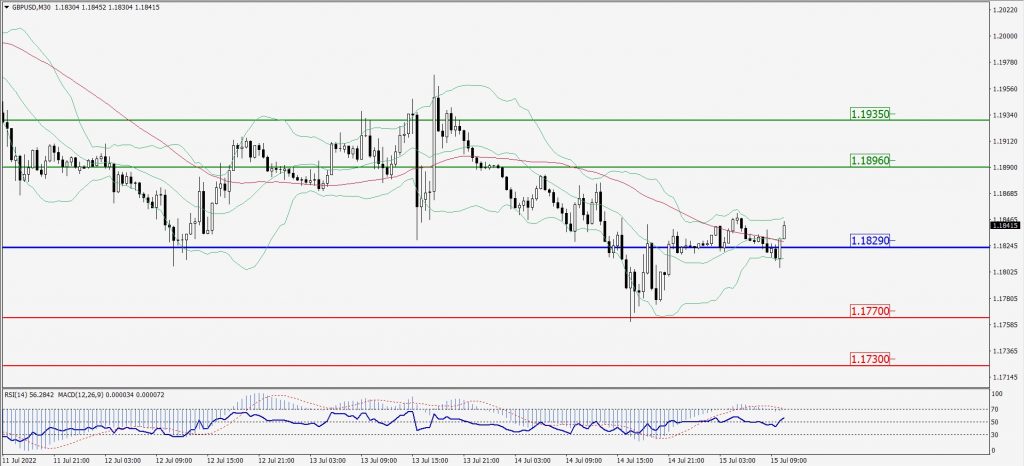
Green Lines Indicate Resistance Levels – Red Lines Indicate Support Levels
Light Blue is a Pivot Point – Black represents the price when the report was produced
USD/JPY Intraday: Trend on the downside
Our pivot point is at 139.240
Preferable Price Action: Sell position below pivot with the target at 138.040 and 137.200 in extension.
Alternative Price Action: The upside breakout of the pivot would call for 140.310 and 141.140.
Comment: MACD is negative territory and Pair below 55MA.
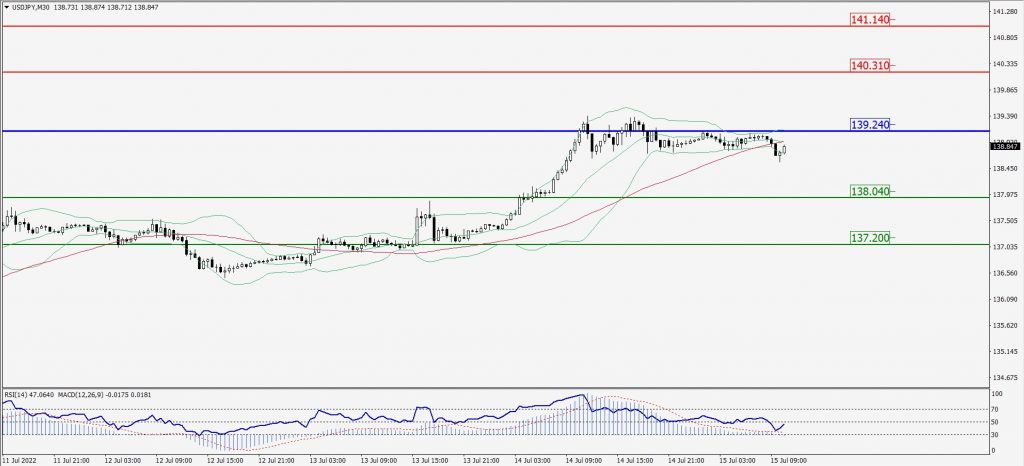
Green Lines Indicate Resistance Levels – Red Lines Indicate Support Levels
Light Blue is a Pivot Point – Black represents the price when the report was produced
AUD/USD Intraday: Major resistance level at 0.67570
Our pivot point is at 0.67570
Preferable Price Action: Sell Positions below pivot with targets at 0.66770 & 0.66220 in extension.
Alternative Price Action: Above pivot looks for a further upside with 0.68360 & 0.68850 as targets.
Comment: RSI at 50 levels.
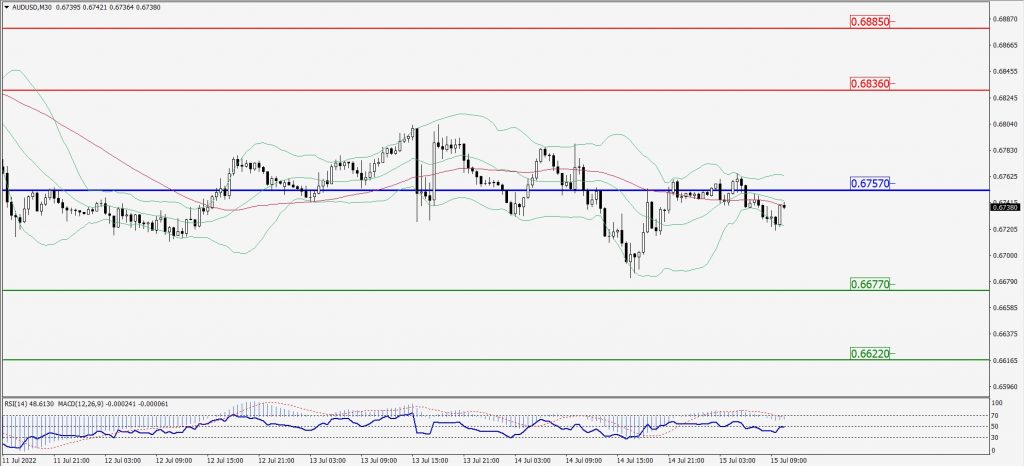
Green Lines Indicate Resistance Levels – Red Lines Indicate Support Levels
Light Blue is a Pivot Point – Black represents the price when the report was produced
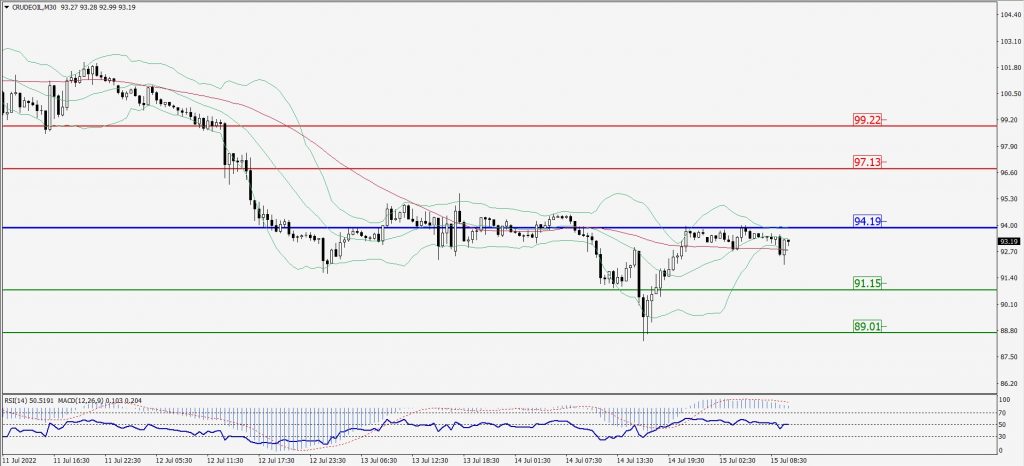
CRUDEOIL Intraday: In a consolidation zone
Our pivot point is at 94.19
Preferable Price Action: Below pivots sell oil with 91.15 & 89.01 as targets.
Alternative Price Action: Buy crude above pivot with targets at 97.13 and 99.22 in extension.
Comment: MACD is in the flat territory.
Green Lines Indicate Resistance Levels – Red Lines Indicate Support Levels
Light Blue is a Pivot Point – Black represents the price when the report was produced
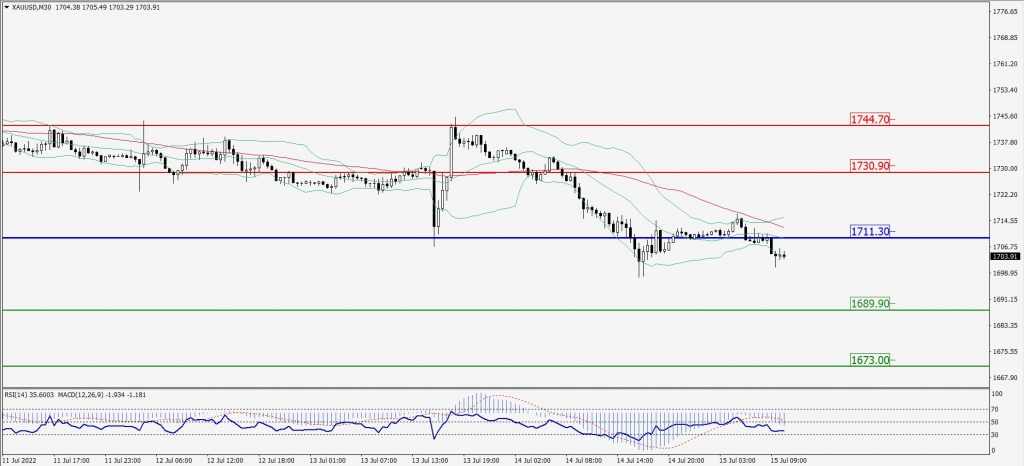
XAU/USD Intraday: Trend on the downside
Our pivot point is 1711.30
Preferable Price Action: Further downside to 1689.90 and 1673.00
Alternative Price Action: If the price gives an upside breakout of a pivot, then the price extends to 1730.90 and 1744.70.
Comment: MACD is negative territory and Pairs below its 20MA & 55MA.
Green Lines Indicate Resistance Levels – Red Lines Indicate Support Levels
Light Blue is a Pivot Point – Black represents the price when the report was produced
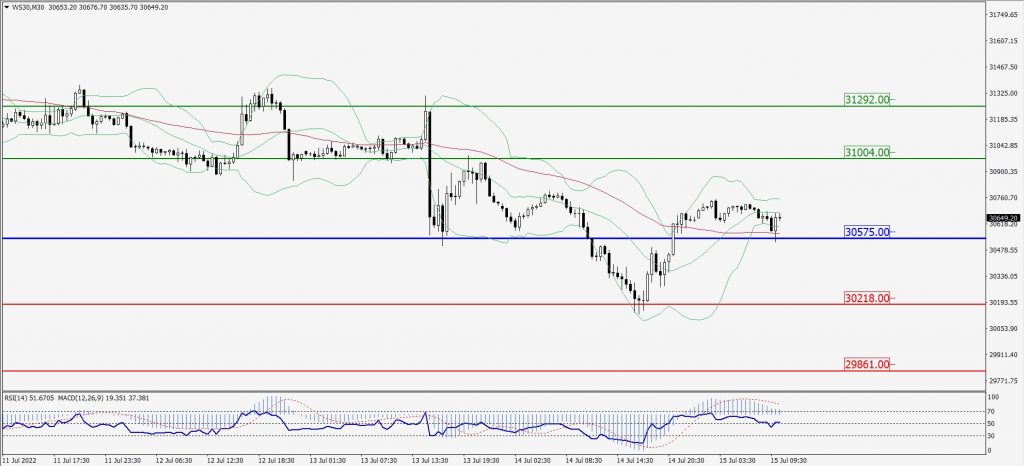
Dow Jones Intraday: Support level at 30575.00
Our pivot point is 30,575.00
Preferable Price Action: Take buy positions above pivot with targets at 31,004.00 & 31,292.00.
Alternative Price Action: Below 30,575.00 looks for further downside to 30,218.00 & 29,861.00.
Comment: RSI at 50 levels and Pair above 55MA.
Green Lines Indicate Resistance Levels – Red Lines Indicate Support Levels
Light Blue is a Pivot Point – Black represents the price when the report was produced