Market Wrap: Stocks, Bonds, Commodities
U.S. Stock futures were higher overnight trading on Tuesday, with major benchmark averages remaining closed during regular hours for a public holiday after closing out the previous week with significant losses.
MSCI’s index of Asia-Pacific stocks outside Japan is ascend 0.50% to 650.64 levels. Australian index higher 0.25% to 6,629.30. Japanese Nikkei Index ascend 1.03% to 26,423.47.
European stocks were mixed on Tuesday, with the Stoxx Europe 50 Index rose 0.13% to 3,457.05, Germany’s DAX advance 0.04% to 12,773.44, and France’s CAC lose 0.24% to 5,940.95, and U.K.’s FTSE 100 slipped 0.57% to 7,189.73.
Benchmark 10-year U.S. Treasury fell as demand for safe assets ascend again, today 10-year bond yields a positive 0.89% to 2.9300.
Brent crude futures extended gains on Tuesday as a strike in Norway is expected to disrupt oil and gas output, fanning tight supply worries.
Spot Brent crude oil add 0.38% to $113.93 per barrel. US West Texas Intermediate crude is up 1.78% to $110.34 a barrel.
The yellow metal gold is advance 0.14% to 1,803.60 dollars per ounce.
Market Wrap: Forex
The U.S. dollar edged lower in early European trade Tuesday, while the Australian dollar dipped despite the country’s Reserve Bank announcing a half-point rate hike.
Today, the U.S. dollar index measures the Greenback against a trade-weighted basket of six major currencies, which is a rose 0.52% to 105.440.
The Euro US Dollar (EUR/USD) is a widely traded pair that is down 0.58% today. This left the pair trading around $1.03620.
The Japanese yen was positive against the U.S. dollar on Tuesday as the stock up. Today USD/JPY is ascend 0.30% to 135.980 level.
Another commodity-related currency negative against the U.S dollar, AUD/USD lose 0.79% to 0.68090, and NZD/USD down 0.55 to 0.61700 level.
EUR/USD Intraday: Trend on the downside
Our pivot point is at 1.04270
Preferable Price Action: Take sell positions below pivot level with targets at 1.03540 & 1.03010 in extension.
Alternative Price Action: Above pivot looks for a further upside to 1.04870 & 1.05400.
Comment: RSI below 50 levels and Pair below its 20MA & 55MA.
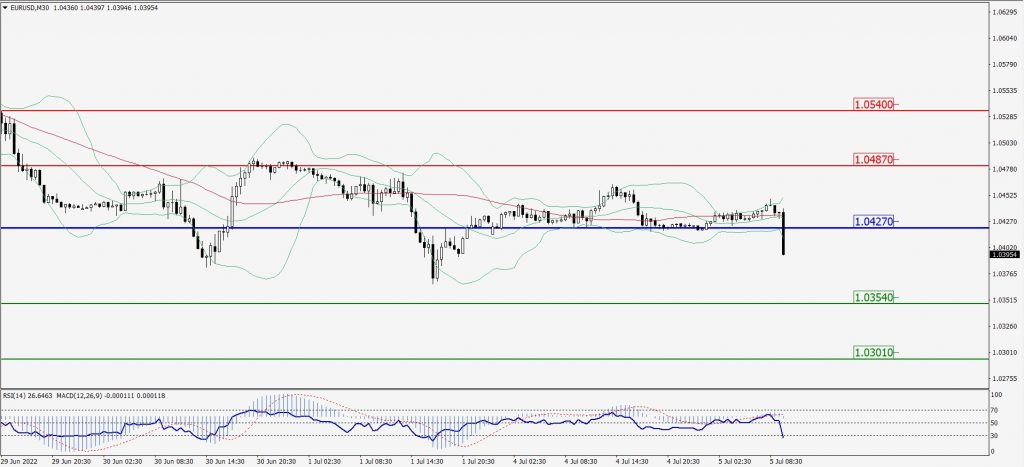
Green Lines Indicate Resistance Levels – Red Lines Indicate Support Levels
Light Blue is a Pivot Point – Black represents the price when the report was produced
GBP/USD Intraday: Trend on the downside
Our pivot point is at 1.21130
Preferable Price Action: Sell positions below pivot with targets at 1.20320 & 1.19660 in extension.
Alternative Price Action: The price above pivot would call for further upside to 1.21860 & 1.22530.
Comment: RSI below 50 levels pair below its 20MA & 55MA.
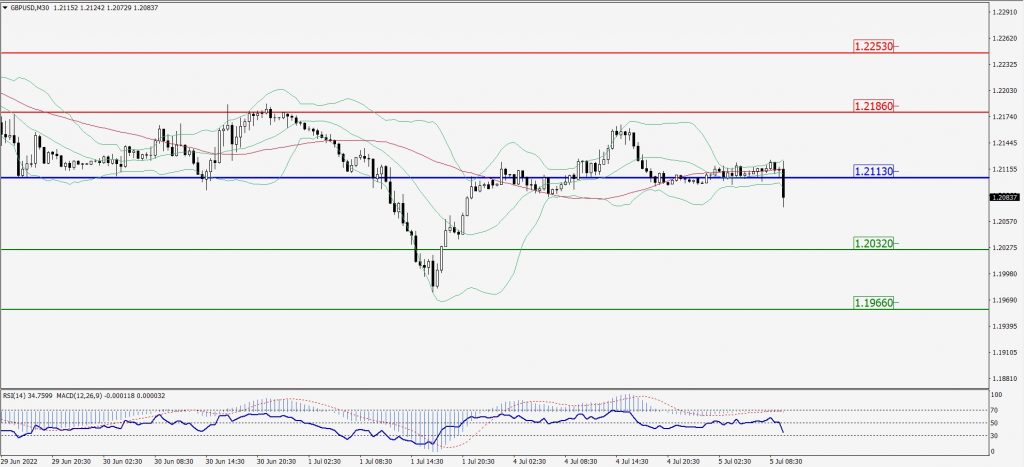
Green Lines Indicate Resistance Levels – Red Lines Indicate Support Levels
Light Blue is a Pivot Point – Black represents the price when the report was produced
USD/JPY Intraday: Trend on the upside
Our pivot point is at 136.030
Preferable Price Action: Buy position above pivot with the target at 137.090 and 137.920 in extension.
Alternative Price Action: The downside breakout of the pivot would call for 134.940 and 134.220.
Comment: MACD is positive territory and Pair above its 20MA & 55MA.
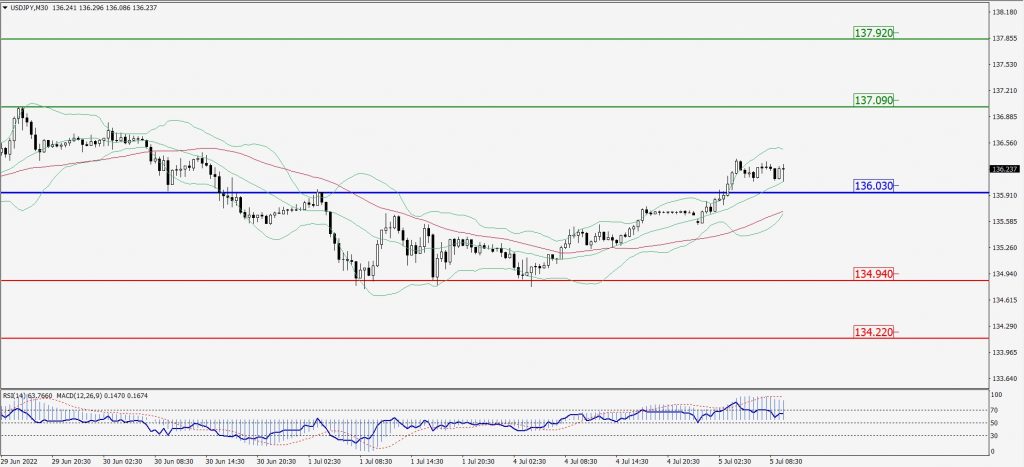
Green Lines Indicate Resistance Levels – Red Lines Indicate Support Levels
Light Blue is a Pivot Point – Black represents the price when the report was produced
AUD/USD Intraday: Trend on the downside
Our pivot point is at 0.68780
Preferable Price Action: Sell Positions below pivot with targets at 0.67760 & 0.67100 in extension.
Alternative Price Action: Above pivot looks for a further upside with 0.69680 & 0.70400 as targets.
Comment: RSI below 50 levels and Pair below its 20MA & 55MA.
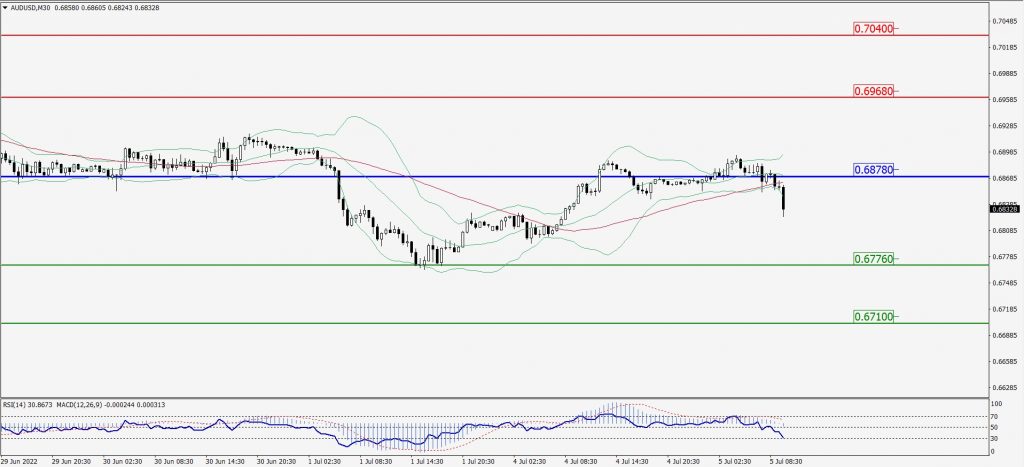
Green Lines Indicate Resistance Levels – Red Lines Indicate Support Levels
Light Blue is a Pivot Point – Black represents the price when the report was produced
CRUDEOIL Intraday: Resistance level at 108.86
Our pivot point is at 108.86
Preferable Price Action: Below pivots sell oil with 104.78 & 101.93 as targets.
Alternative Price Action: Buy crude above pivot with targets at 112.36 and 115.26 in extension.
Comment: MACD is in the negative territory and Pair below 20MA.
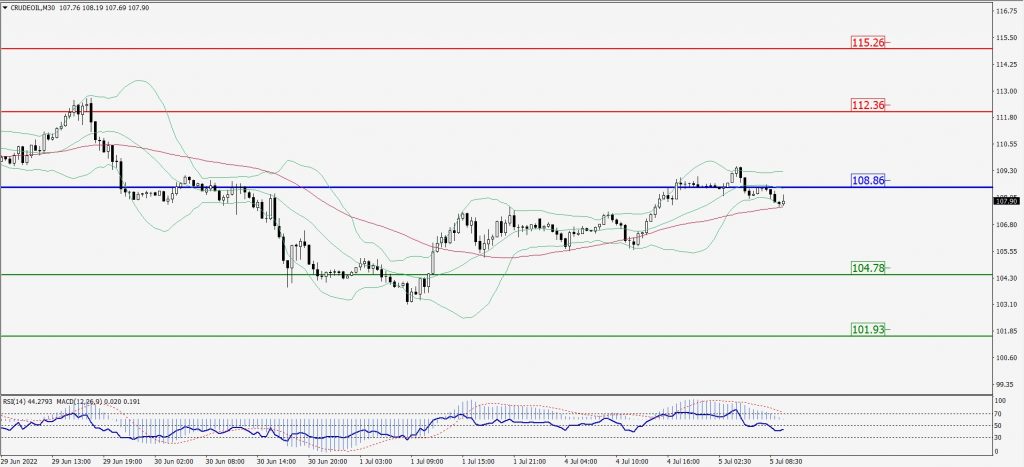
Green Lines Indicate Resistance Levels – Red Lines Indicate Support Levels
Light Blue is a Pivot Point – Black represents the price when the report was produced
XAU/USD Intraday: Major resistance level at 1814.70
Our pivot point is 1814.70
Preferable Price Action: Further downside to 1790.90 and 1774.50
Alternative Price Action: If the price gives an upside breakout of a pivot, then the price extends to 1838.70 and 1854.90.
Comment: MACD is negative territory and Pair below 20MA.
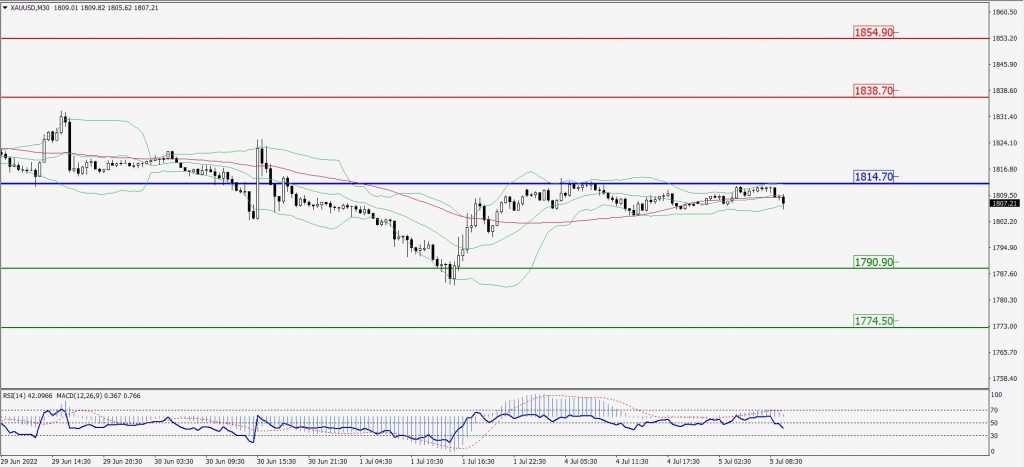
Green Lines Indicate Resistance Levels – Red Lines Indicate Support Levels
Light Blue is a Pivot Point – Black represents the price when the report was produced
Dow Jones Intraday: May trend reverse from 31,050.00
Our pivot point is 31,050.00
Preferable Price Action: Take buy positions above pivot with targets at 31,717.00 & 32,162.00.
Alternative Price Action: Below 31,050.00 looks for further downside to 30,519.00 & 30,078.00.
Comment: RSI above 50 levels and Pair above 55MA.
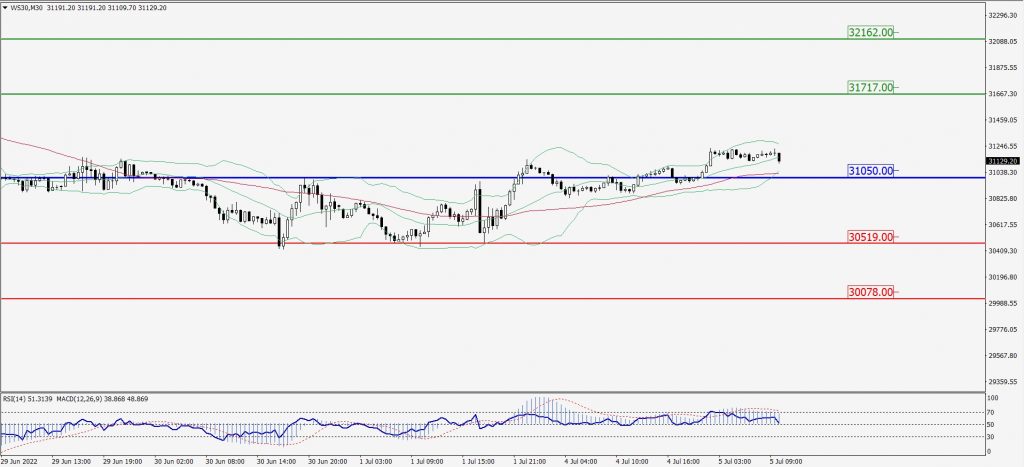
Green Lines Indicate Resistance Levels – Red Lines Indicate Support Levels
Light Blue is a Pivot Point – Black represents the price when the report was produced