Market Wrap: Stocks, Bonds, Commodities
World shares rose on Thursday and the US dollar edged lower, a day after minutes from the US Federal Reserve’s May meeting indicated the central bank would remain flexible and might pause rate hikes later in the year.
The Dow Jones Industrial Average rose 516.91 points to 32,637.19, the S&P 500 gained 79.11 points to 4,057.84 and the Nasdaq Composite added 305.91 points to 11,740.65.
MSCI’s index of Asia-Pacific stocks outside Japan is ascend 1.84% to 662.09 levels. Australian index higher 1.08% to 7,182.70. Japanese Nikkei Index ascend 0.66% to 26,781.68.
European stocks were positive on Friday, with the Stoxx Europe 50 Index rose 0.78% to 3,768.45, Germany’s DAX advance 0.59% to 14,315.88, and France’s CAC rose 0.73% to 6,456.02, and U.K.’s FTSE 100 fell 0.06% to 7,561.55.
Benchmark 10-year U.S. Treasury fell as demand for safe assets ascend again, today 10-year bond yields a negative 0.08% to 2.756.
Oil prices eased slightly in early Asian trade on Friday, after surging to a two-month high in the previous session as investors focused on signs of tight global supply.
Spot Brent crude oil advance 0.49% to $114.73 per barrel. US West Texas Intermediate crude is up 0.31% to $114.42 a barrel.
The yellow metal gold is lost 0.42% to 1,855.59 dollars per ounce.
Market Wrap: Forex
The dollar was set for its biggest weekly drop in nearly four months as traders lowered Federal Reserve rate hike expectations amid signs the U.S. central bank might slow or even pause its tightening cycle in the second half of the year.
Today, the U.S. dollar index measures the Greenback against a trade-weighted basket of six major currencies, which is a fell 0.11% to 101.740.
The Euro US Dollar (EUR/USD) is a widely traded pair that is advance 0.02% today. This left the pair trading around $1.07270.
The Japanese yen was positive against the U.S. dollar on Friday as the stock up. Today USD/JPY is fell 0.06% to 127.070 level.
Another commodity-related currency positive against the U.S dollar, AUD/USD gain 0.63% to 0.71420, and NZD/USD up 0.69 to 0.65220 level.
EUR/USD Intraday: Trend on The Upside
Our pivot point is at 1.07380
Preferable Price Action: Take buy positions above pivot level with targets at 1.07840 & 1.08150 in extension.
Alternative Price Action: Below pivot looks for a further downside to 1.06970 & 1.06630.
Comment: RSI above 50 levels and Pair above its 20MA & 55MA.
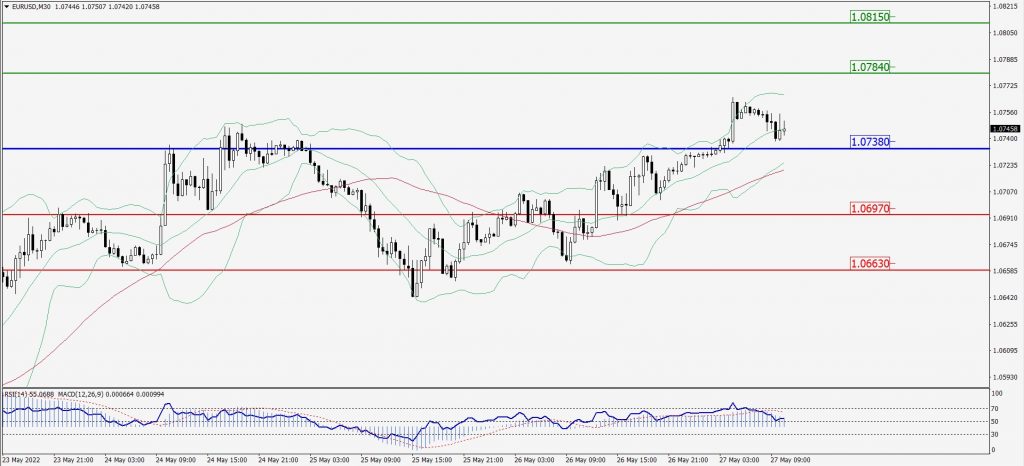
Green Lines Indicate Resistance Levels – Red Lines Indicate Support Levels
Light Blue is a Pivot Point – Black represents the price when the report was produced
GBP/USD Intraday: In a Consolidation Zone
Our pivot point is at 1.26410
Preferable Price Action: Sell positions below pivot with targets at 1.25780 & 1.25240 in extension.
Alternative Price Action: The price above pivot would call for further upside to 1.27000 & 1.27530.
Comment: RSI at 50 levels pair below 20MA.
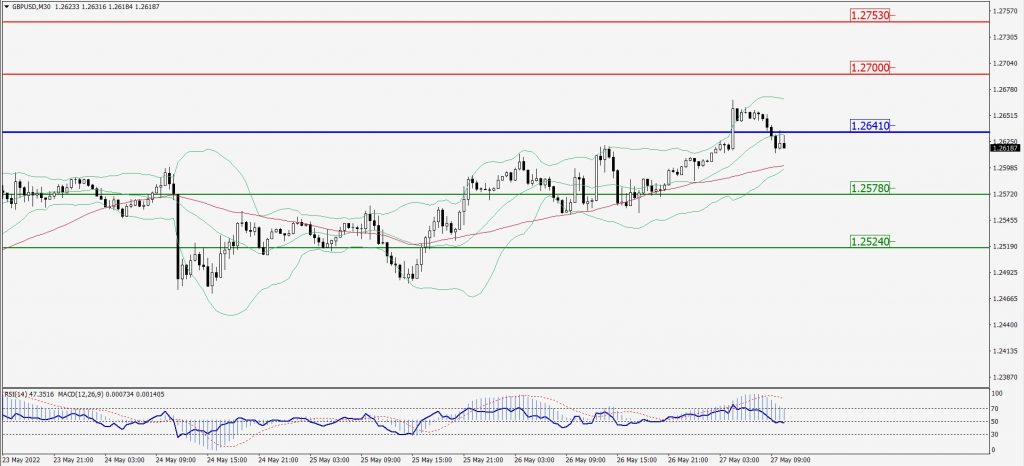
Green Lines Indicate Resistance Levels – Red Lines Indicate Support Levels
Light Blue is a Pivot Point – Black represents the price when the report was produced
USD/JPY Intraday: Support Level at 127.000
Our pivot point is at 127.000
Preferable Price Action: Buy position above pivot with the target at 127.420 and 127.800 in extension.
Alternative Price Action: The upside breakout of the pivot would call for 126.650 and 126.300.
Comment: MACD is positive territory and Pair above its 20MA & 55MA.
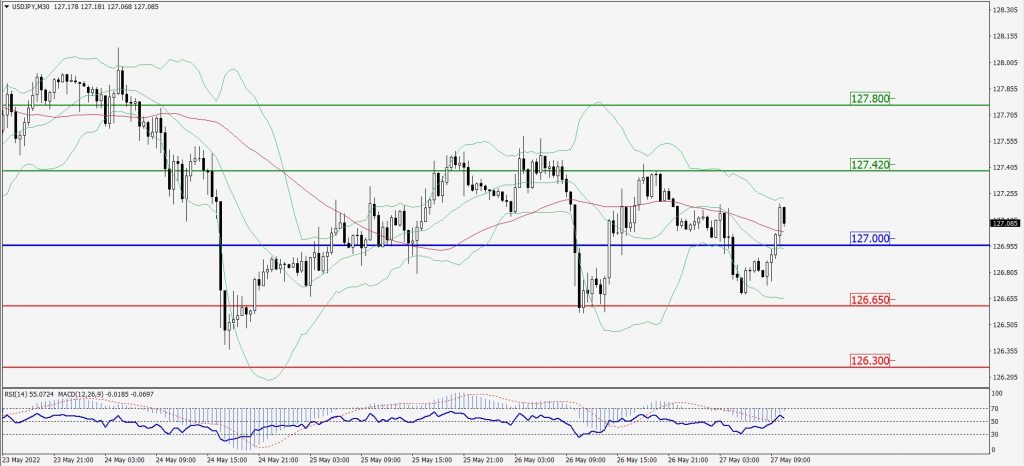
Green Lines Indicate Resistance Levels – Red Lines Indicate Support Levels
Light Blue is a Pivot Point – Black represents the price when the report was produced
AUD/USD Intraday: In a consolidation zone
Our pivot point is at 0.71240
Preferable Price Action: Buy Positions above pivot with targets at 0.71750 & 0.72130 in extension.
Alternative Price Action: Below pivot looks for a further downside with 0.70820 & 0.70470 as targets.
Comment: RSI above 50 levels and Pair above its 20MA & 55MA.
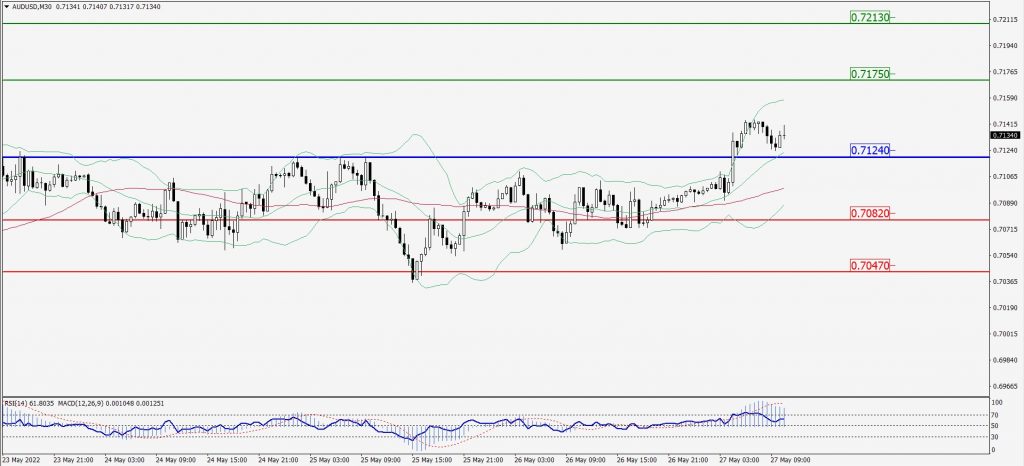
Green Lines Indicate Resistance Levels – Red Lines Indicate Support Levels
Light Blue is a Pivot Point – Black represents the price when the report was produced
CRUDEOIL Intraday: Major Trend on The Upside
Our pivot point is at 112.51
Preferable Price Action: Above pivots buy oil with 114.91 & 116.67 as targets.
Alternative Price Action: Sell crude below pivot with targets at 110.38 and 108.76 in extension.
Comment: MACD is in the positive territory and Pair above its 20MA & 55MA.
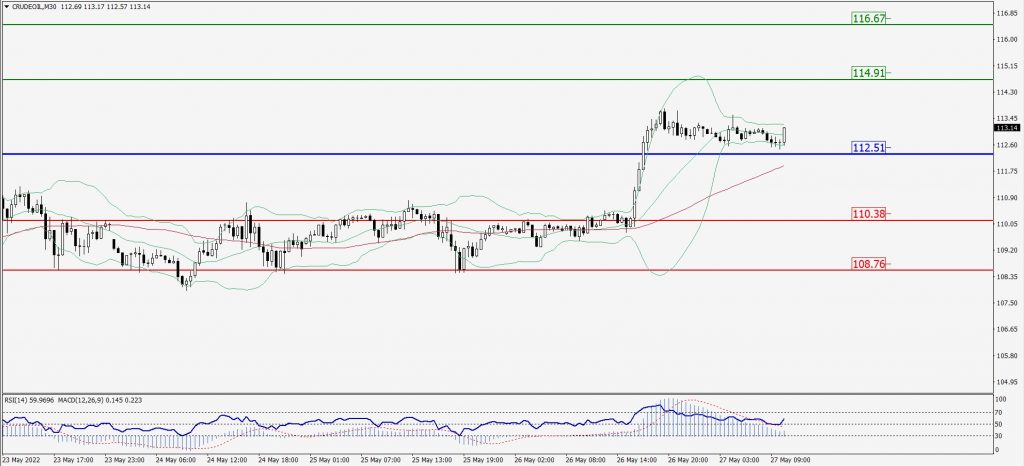
Green Lines Indicate Resistance Levels – Red Lines Indicate Support Levels
Light Blue is a Pivot Point – Black represents the price when the report was produced
XAU/USD Intraday: Trend on the upside
Our pivot point is 1855.50
Preferable Price Action: Further upside to 1873.10 and 1884.10
Alternative Price Action: If the price gives a downside breakout of a pivot, then the price extends to 1842.20 and 1829.70.
Comment: MACD is positive territory and pair above its 20MA & 55MA.
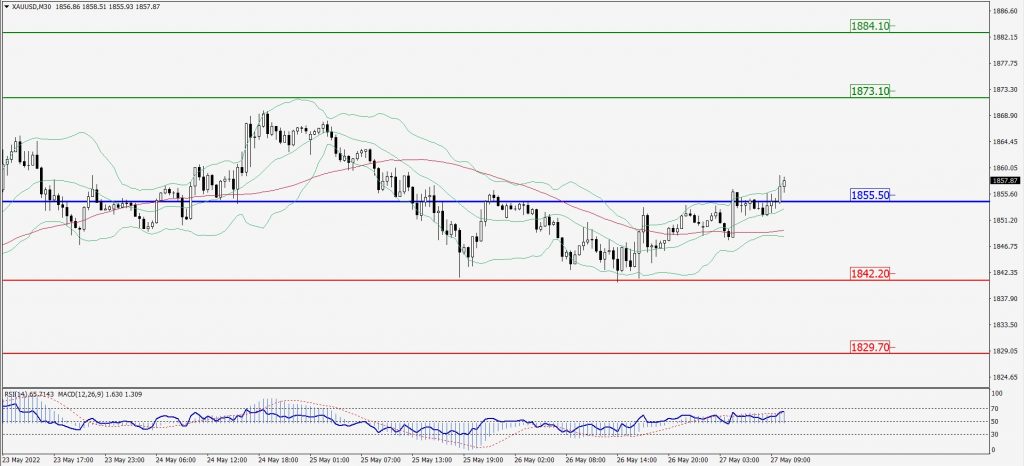
Green Lines Indicate Resistance Levels – Red Lines Indicate Support Levels
Light Blue is a Pivot Point – Black represents the price when the report was produced
Dow Jones Intraday: Trend on The upside
Our pivot point is 32,543.00
Preferable Price Action: Take buy positions above pivot with targets at 33,206.00 & 33,697.00.
Alternative Price Action: Below 32,543.00 looks for further downside to 31,928.00 & 31,399.00.
Comment: RSI above 50 levels and Pair above its 20MA & 55MA.
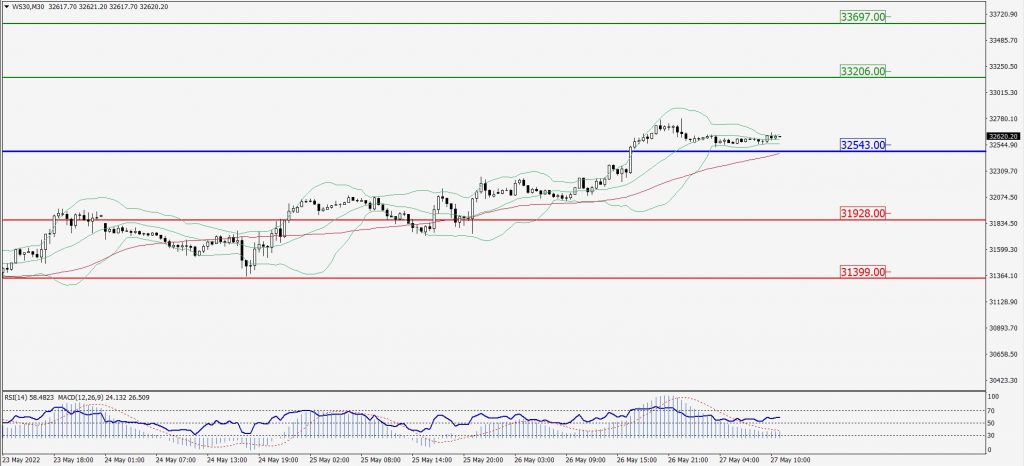
Green Lines Indicate Resistance Levels – Red Lines Indicate Support Levels
Light Blue is a Pivot Point – Black represents the price when the report was produced