Market Wrap: Stocks, Bonds, Commodities
Wall Street closed higher Wednesday, boosted after minutes from the Federal Reserve’s latest monetary policy meeting showed policymakers unanimously felt the US economy was very strong as they grappled with reining in inflation without triggering a recession.
The Dow Jones Industrial Average rose 191.66 points to 32,120.28, the S&P 500 gained 37.25 points to 3,978.73 and the Nasdaq Composite added 170.29 points to 11,434.74.
MSCI’s index of Asia-Pacific stocks outside Japan is fell 0.30% to 652.10 levels. Australian index lower 0.69% to 7,105.50. Japanese Nikkei Index drop 0.27% to 26,604.84.
European stocks were positive on Thursday, with the Stoxx Europe 50 Index rose 0.36% to 3,691.45, Germany’s DAX advance 0.40% to 14,063.15, and France’s CAC rose 0.52% to 6,331.80, and U.K.’s FTSE 100 ifell 0.12% to 7,514.53.
Benchmark 10-year U.S. Treasury fell as demand for safe assets ascend again, today 10-year bond yields a positive 0.72% to 2.767.
Oil prices rose on Thursday, extending a cautious rally this week on signs of tight supply while the European Union (EU) wrangles with Hungary over plans to ban imports from Russia, the world’s second-largest crude exporter, after it invaded Ukraine.
Spot Brent crude oil advance 0.83% to $111.25 per barrel. US West Texas Intermediate crude is up 0.55% to $111.73 a barrel.
The yellow metal gold is lost 0.25% to 1,843.10 dollars per ounce.
Market Wrap: Forex
The U.S. dollar edged back towards a one-month low on Thursday, as minutes from the Federal Reserve’s May meeting contained few surprises, with most participants favouring additional 50 basis point rate hikes at the June and July meetings.
Today, the U.S. dollar index measures the Greenback against a trade-weighted basket of six major currencies, which is a fell 0.13% to 101.940.
The Euro US Dollar (EUR/USD) is a widely traded pair that is advance 0.26% today. This left the pair trading around $1.07070.
The Japanese yen was positive against the U.S. dollar on Thursday as the stock up. Today USD/JPY is fell 0.18% to 127.070 level.
Another commodity-related currency negative against the U.S dollar, AUD/USD lost 0.07% to 0.70870, and NZD/USD flat to 0.64690 level.
EUR/USD Intraday: Trend on The Upside
Our pivot point is at 1.6700
Preferable Price Action: Take buy positions above pivot level with targets at 1.07700 & 1.08700 in extension.
Alternative Price Action: Below pivot looks for a further downside to 1.05710 & 1.04890.
Comment: RSI above 50 levels and Pair above its 20MA & 55MA.
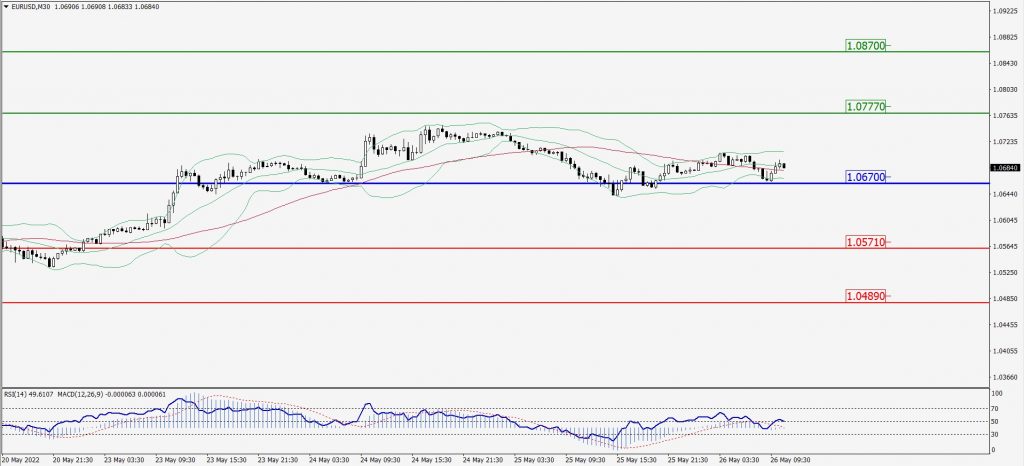
Green Lines Indicate Resistance Levels – Red Lines Indicate Support Levels
Light Blue is a Pivot Point – Black represents the price when the report was produced
GBP/USD Intraday: Support Level at 1.25700
Our pivot point is at 1.25700
Preferable Price Action: Buy positions above pivot with targets at 1.26690 & 1.27520 in extension.
Alternative Price Action: The price below pivot would call for further downside to 1.24740 & 1.23900.
Comment: RSI above 50 levels pair above its 20MA & 55MA.
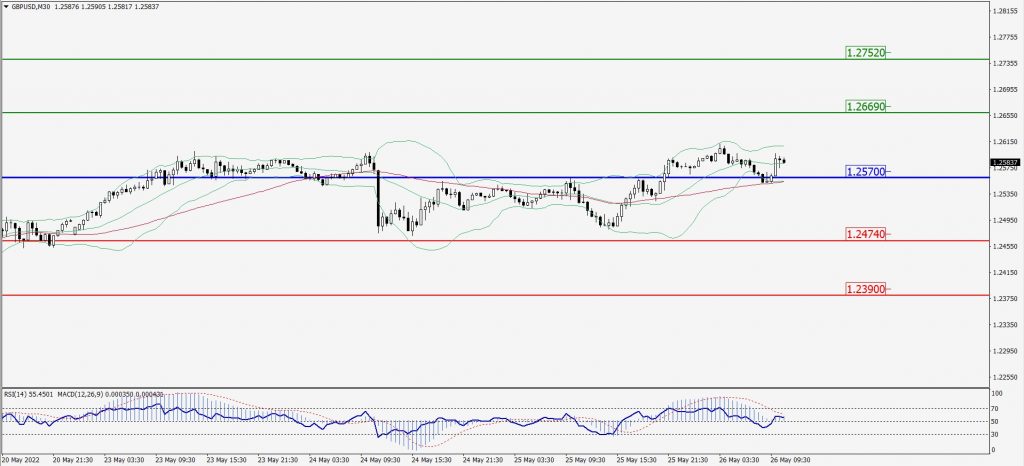
Green Lines Indicate Resistance Levels – Red Lines Indicate Support Levels
Light Blue is a Pivot Point – Black represents the price when the report was produced
USD/JPY Intraday: Resistance Level at 127.220
Our pivot point is at 127.220
Preferable Price Action: Sell position below pivot with the target at 125.990 and 124.900 in extension.
Alternative Price Action: The upside breakout of the pivot would call for 128.550 and 129.790.
Comment: MACD is negative territory and Pair below its 20MA & 55MA.
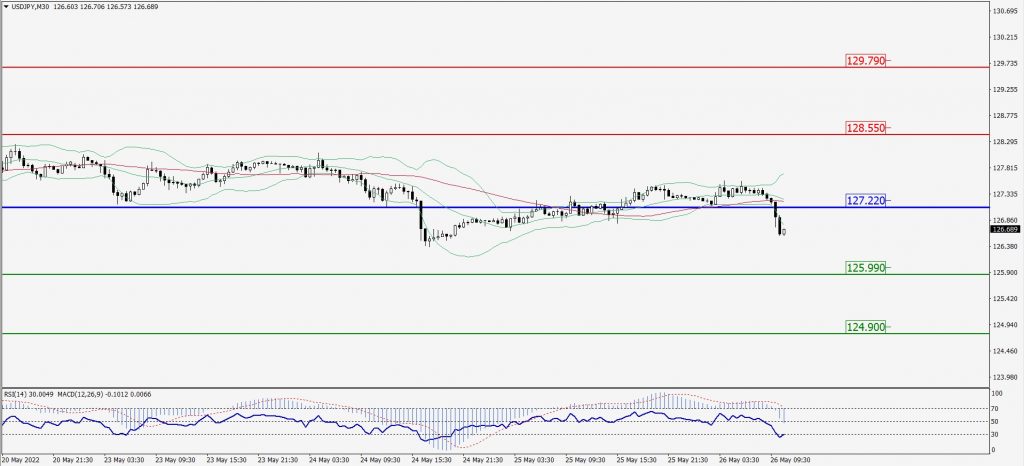
Green Lines Indicate Resistance Levels – Red Lines Indicate Support Levels
Light Blue is a Pivot Point – Black represents the price when the report was produced
AUD/USD Intraday: In a consolidation zone
Our pivot point is at 0.70830
Preferable Price Action: Buy Positions above pivot with targets at 0.71780 & 0.72610 in extension.
Alternative Price Action: Below pivot looks for a further downside with 0.69970 & 0.69230 as targets.
Comment: RSI above 50 levels and Pair above 20MA.
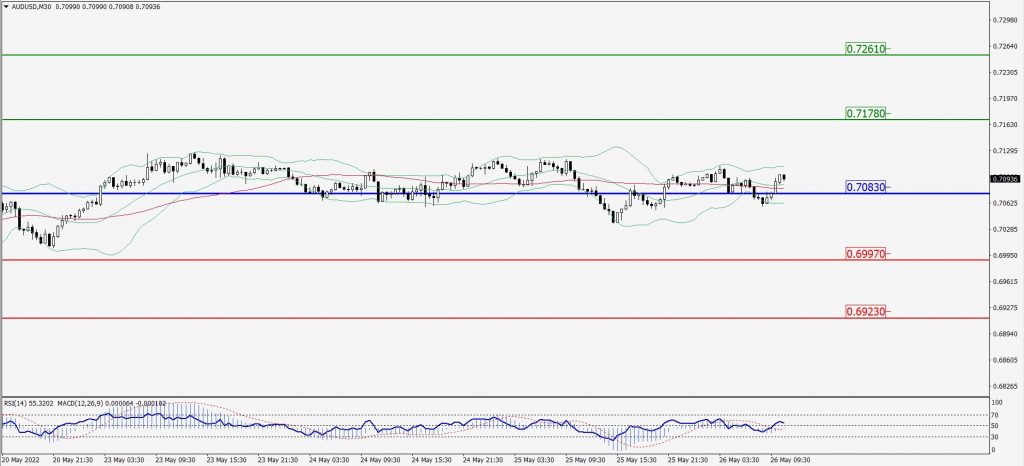
Green Lines Indicate Resistance Levels – Red Lines Indicate Support Levels
Light Blue is a Pivot Point – Black represents the price when the report was produced
CRUDEOIL Intraday: In a Consolidation Zone
Our pivot point is at 109.70
Preferable Price Action: Above pivots buy oil with 111.38 & 112.92 as targets.
Alternative Price Action: Sell crude below pivot with targets at 108.15 and 106.69 in extension.
Comment: MACD is in the positive territory and Pair above its 20MA & 55MA.
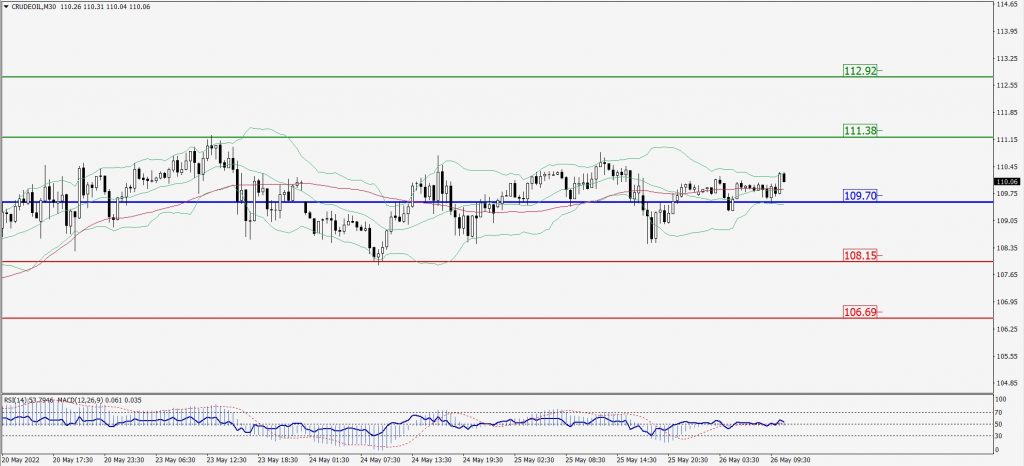
Green Lines Indicate Resistance Levels – Red Lines Indicate Support Levels
Light Blue is a Pivot Point – Black represents the price when the report was produced
XAU/USD Intraday: Trend on the downside
Our pivot point is 1852.60
Preferable Price Action: Further downside to 1839.20 and 1938.30
Alternative Price Action: If the price gives a upside breakout of a pivot, then the price extends to 1867.60 and 1879.20.
Comment: MACD is negative territory and pair below its 20MA & 55MA.
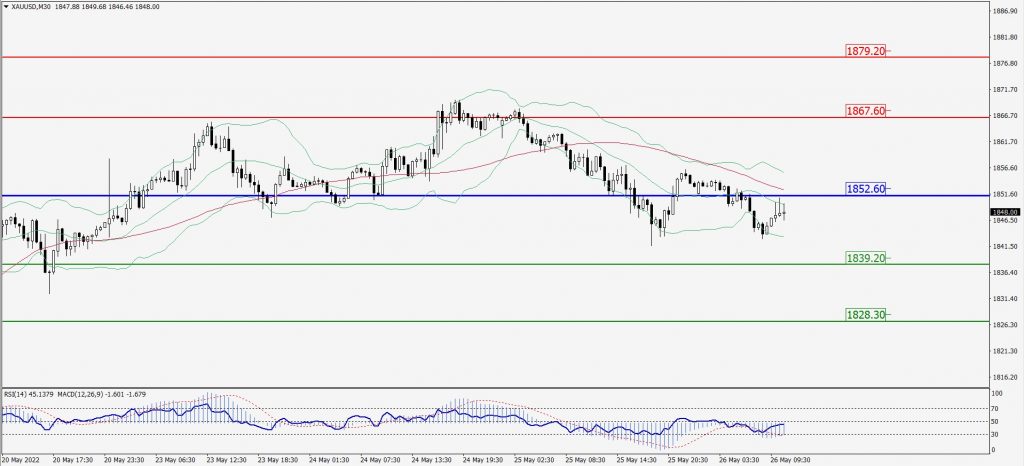
Green Lines Indicate Resistance Levels – Red Lines Indicate Support Levels
Light Blue is a Pivot Point – Black represents the price when the report was produced
Dow Jones Intraday: Trend on The upside
Our pivot point is 32,886.00
Preferable Price Action: Take buy positions above pivot with targets at 32,886.00 & 33,542.00.
Alternative Price Action: Below 32,886.00 looks for further downside to 31,355.00 & 30,716.00.
Comment: RSI above 50 levels and Pair above 55MA.
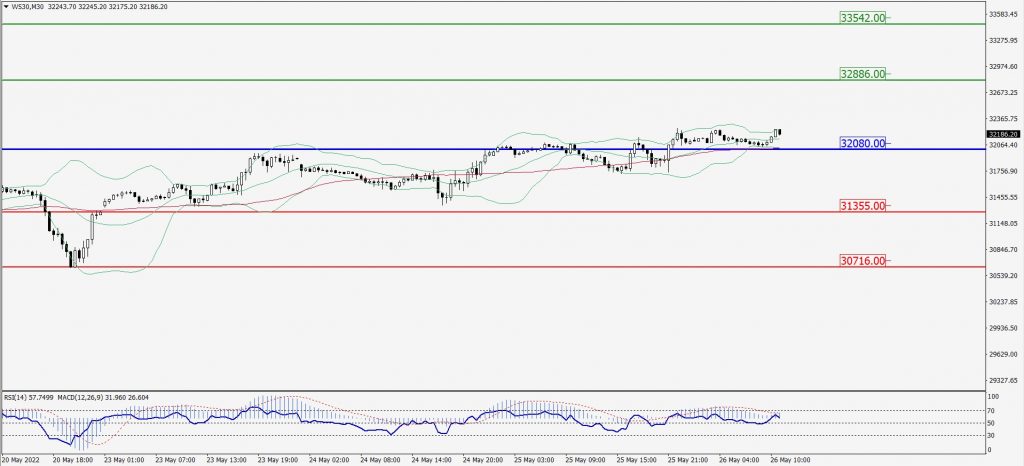
Green Lines Indicate Resistance Levels – Red Lines Indicate Support Levels
Light Blue is a Pivot Point – Black represents the price when the report was produced