Market Wrap: Stocks, Bonds, Commodities
US stocks ended higher on Monday as gains from banks and a rebound in market-leading tech shares supported a broad-based rally following Wall Street’s longest streak of weekly declines since the dotcom bust more than 20 years ago.
The S&P 500 gain (1.86%) ended at 3,973.75 points, while the Nasdaq Composite up 1.59% to 11,535.28. The Dow Jones Industrial was rose 1.98% to 31,880.24.
MSCI’s index of Asia-Pacific stocks outside Japan is drop 1.58% to 649.75 levels. Australian index lower 0.28% to 7,128.80. Japanese Nikkei Index drop 0.94% to 26,748.14.
European stocks were negative on Tuesday, with the Stoxx Europe 50 Index lose 1.32% to 3,659.35, Germany’s DAX decline 1.08% to 14,021.32, and France’s CAC up 1.42% to 6,268.16, and U.K.’s FTSE 100 decrease 0.53% to 7,475.24.
Benchmark 10-year U.S. Treasury fell as demand for safe assets ascend again, today 10-year bond yields a positive 2.8080.
Oil prices eased in early trade on Tuesday as concerns over a possible recession and weaker consumption outweighed an expectation of tight global supply and a pick-up in fuel demand in China after Beijing’s promises of stimulus.
Spot Brent crude oil fell 0.53% to $110.19 per barrel. US West Texas Intermediate crude is down 0.44% to $109.78 a barrel.
The yellow metal gold is advance 0.52% to 1,857.49 dollars per ounce.
Market Wrap: Forex
The dollar hit a fresh one-month low on Tuesday as the euro extended gains while a broad selloff in stock markets failed to boost the U.S. currency’s safe haven appeal.
Today, the U.S. dollar index measures the Greenback against a trade-weighted basket of six major currencies, which is a fell of 0.11% to 101.990.
The Euro US Dollar (EUR/USD) is a widely traded pair that is up 0.25% today. This left the pair trading around $1.07160.
The Japanese yen was positive against the U.S. dollar on Tuesday as the stock up. Today USD/JPY is lose 0.50% to 127.230 level.
Another commodity-related currency negative against the U.S dollar, AUD/USD drop 0.44 to 0.70770, and NZD/USD lower 0.48% to 0.64340 level.
EUR/USD Intraday: Trend on The Upside
Our pivot point is at 1.07130
Preferable Price Action: Take buy positions above pivot level with targets at 1.08010 & 1.08740 in extension.
Alternative Price Action: Below pivot looks for a further downside to 1.06240 & 1.05490.
Comment: RSI above 50 levels and Pair above its 20MA & 55MA.
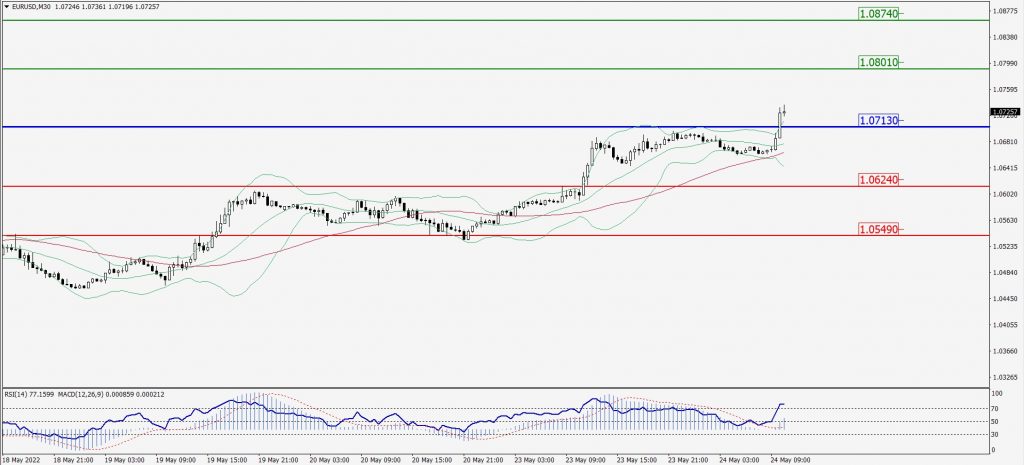
Green Lines Indicate Resistance Levels – Red Lines Indicate Support Levels
Light Blue is a Pivot Point – Black represents the price when the report was produced
GBP/USD Intraday: Major Support Level at 1.25700
Our pivot point is at 1.25700
Preferable Price Action: Buy positions above pivot with targets at 1.26690 & 1.27340 in extension.
Alternative Price Action: The price below pivot would call for further downside to 1.24740 & 1.24030.
Comment: RSI above 50 levels pair above its 20MA & 55MA.
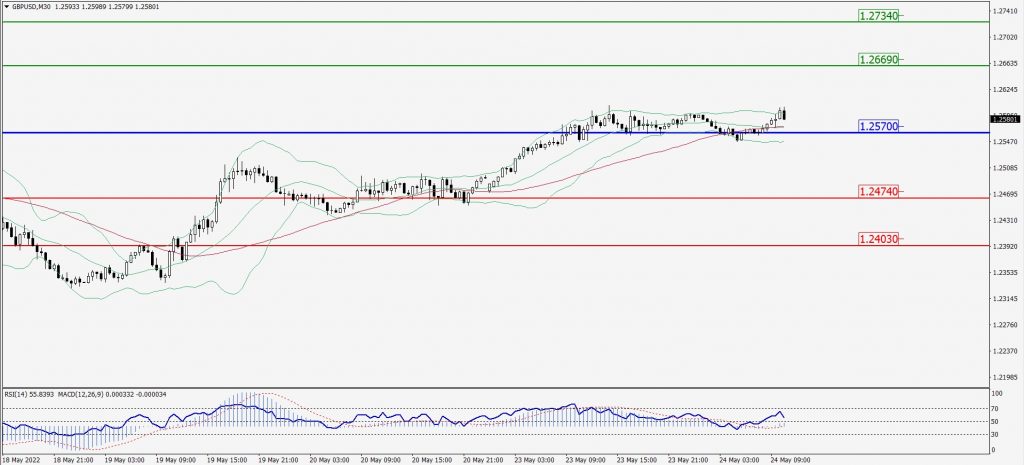
Green Lines Indicate Resistance Levels – Red Lines Indicate Support Levels
Light Blue is a Pivot Point – Black represents the price when the report was produced
USD/JPY Intraday: Major Resistance Level at 127.850
Our pivot point is at 127.850
Preferable Price Action: Sell position below pivot with the target at 126.510 and 125.370 in extension.
Alternative Price Action: The upside breakout of the pivot would call for 129.140 and 130.080.
Comment: MACD is negative territory and Pair below its 20MA & 55MA.
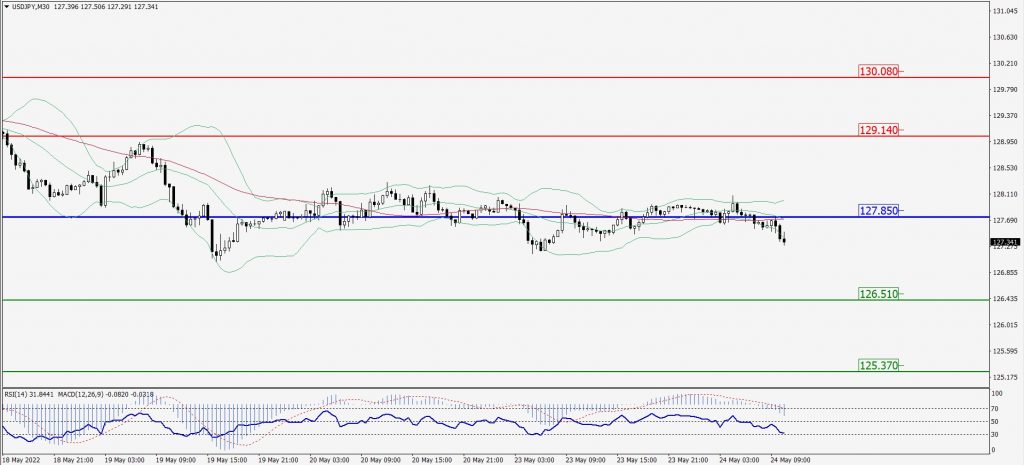
Green Lines Indicate Resistance Levels – Red Lines Indicate Support Levels
Light Blue is a Pivot Point – Black represents the price when the report was produced
AUD/USD Intraday: Trend on The Upside
Our pivot point is at 0.70800
Preferable Price Action: Buy Positions above pivot with targets at 0.71860 & 0.72610 in extension.
Alternative Price Action: Below pivot looks for a further downside with 0.69800 & 0.68990 as targets.
Comment: RSI above 50 levels and Pair above 20MA.
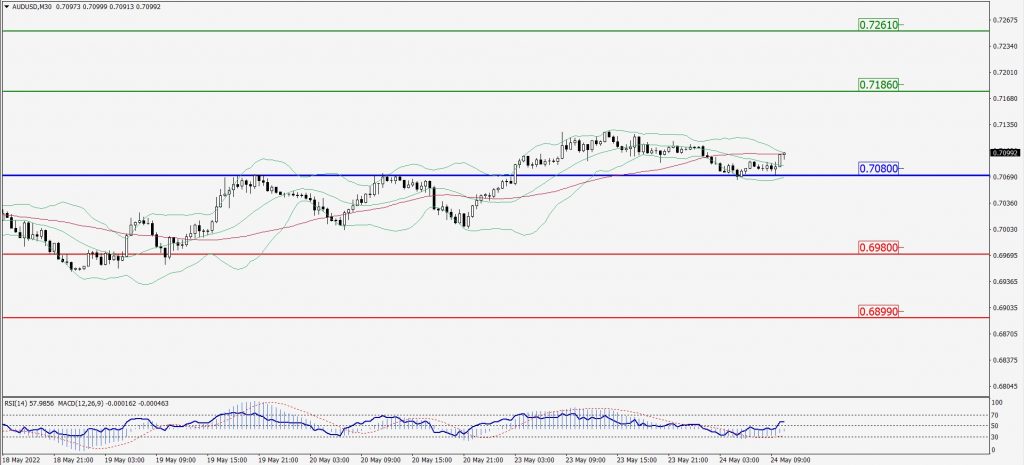
Green Lines Indicate Resistance Levels – Red Lines Indicate Support Levels
Light Blue is a Pivot Point – Black represents the price when the report was produced
CRUDEOIL Intraday: In a Consolidation Zone
Our pivot point is at 109.23
Preferable Price Action: Below pivots sell oil with 107.44 & 112.52 as targets.
Alternative Price Action: Buy crude above pivot with targets at 111.01 and 112.52 in extension.
Comment: MACD is in the negative territory and Pair below its 20MA & 55MA.
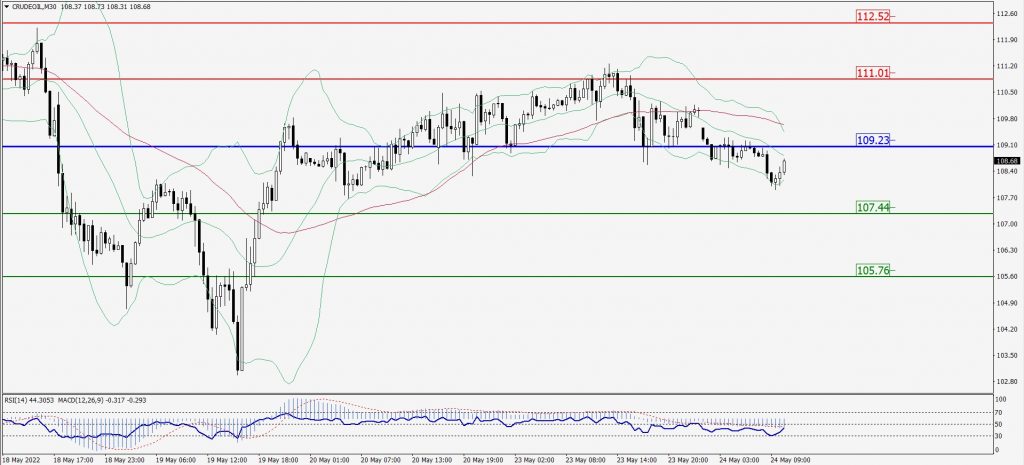
Green Lines Indicate Resistance Levels – Red Lines Indicate Support Levels
Light Blue is a Pivot Point – Black represents the price when the report was produced
XAU/USD Intraday: Major Support Level at 1854.30
Our pivot point is 1854.30
Preferable Price Action: Further upside to 1885.80 and 1912.00.
Alternative Price Action: If the price gives a downside breakout of a pivot, then the price extends to 1824.20 and 1801.00.
Comment: MACD is positive territory and pair above its 20MA & 55MA.
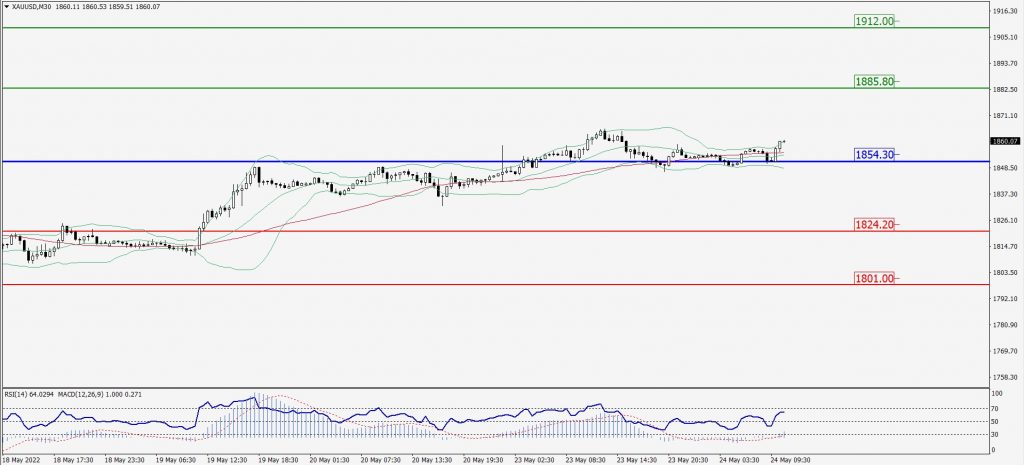
Green Lines Indicate Resistance Levels – Red Lines Indicate Support Levels
Light Blue is a Pivot Point – Black represents the price when the report was produced
Dow Jones Intraday: Trend on The Downside
Our pivot point is 31,808.00
Preferable Price Action: Take Sell positions below pivot with targets at 31,178.00 & 30,737.00.
Alternative Price Action: Above 31,808.00 looks for further upside to 32,315.00 & 32,853.00.
Comment: RSI below 50 levels and Pair below 55MA.
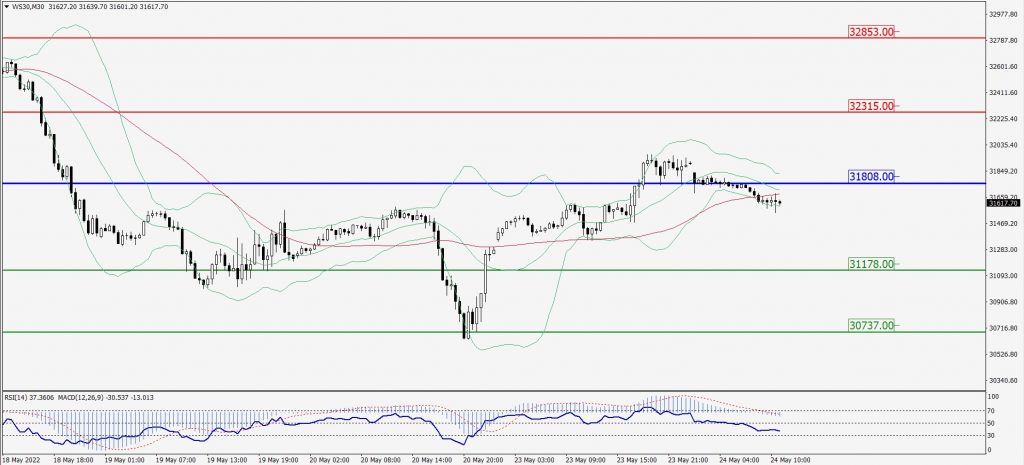
Green Lines Indicate Resistance Levels – Red Lines Indicate Support Levels
Light Blue is a Pivot Point – Black represents the price when the report was produced