Market Wrap: Stocks, Bonds, Commodities
Wall Street rose on Monday, with the Nasdaq ending sharply higher after Twitter agreed to be bought by billionaire Elon Musk, sparking a late day rally in growth stocks.
The S&P 500 gain (0.57%) ended at 4,296.12 points, while the Nasdaq Composite up 1.29% to 13,004.85. The Dow Jones Industrial was rose 0.70% to 34,049.46.
MSCI’s index of Asia-Pacific stocks outside Japan is ascend 1.16% to 670.90 levels. Australian index lower 1.93% to 7,329.30. Japanese Nikkei Index surge 0.44% to 26,708.50.
European stocks were negative on Tuesday, with the Stoxx Europe 50 Index lose 1.83% to 3,771.35, Germany’s DAX drop 1.21% to 13,968.37, and France’s CAC down 1.72% to 6,467.91, and U.K.’s FTSE 100 decrease 1.98% to 7,375.49.
Benchmark 10-year U.S. Treasury fell as demand for safe assets ascend again, today 10-year bond yields a positive 2.8470.
Oil slumped about 4 percent on Monday to its lowest in two weeks on growing worries about the global energy demand outlook due to prolonged COVID-19 lockdowns in Shanghai and potential increases in US interest rates.
Spot Brent crude oil rose 1.25% to $103.48 per barrel. US West Texas Intermediate crude is up 1.07% to $99.58 a barrel.
The yellow metal gold is advance 0.58% to 1,907.10 dollars per ounce.
Market Wrap: Forex
The dollar held near a two-year peak on Tuesday as concerns about the economic impact of China’s COVID-19 lockdowns held up the greenback’s safe-haven appeal and aggressive U.S. interest rate hike expectations kept bond yields elevated.
Today, the U.S. dollar index measures the Greenback against a trade-weighted basket of six major currencies, which is a rose of 0.12% to 101.892.
The Euro US Dollar (EUR/USD) is a widely traded pair that is down 0.23% today. This left the pair trading around $1.06840.
The Japanese yen was positive against the U.S. dollar on Tuesday as the stock up. Today USD/JPY is fell 0.13% to 127.950 level.
Another commodity-related currency positive against the U.S dollar, AUD/USD ascend 0.52 to 0.72140, and NZD/USD higher 0.38% to 0.66370 level.
EUR/USD Intraday: Major Support Level at 1.07180
Our pivot point is at 1.07180
Preferable Price Action: Take Buy positions above pivot level with targets at 1.08020 & 1.08690 in extension.
Alternative Price Action: Below pivot looks for a further downside to 1.06440 & 1.05800.
Comment: RSI above 50 levels and Pair above 20MA.
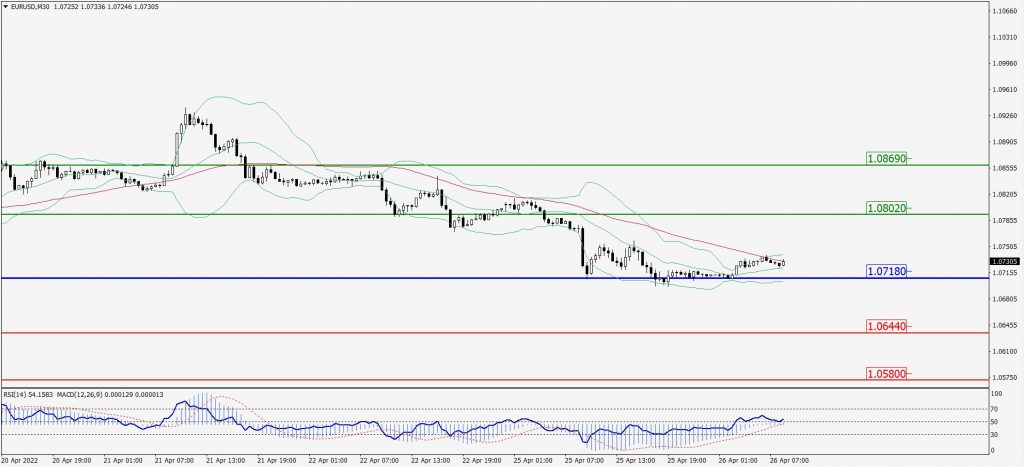
Green Lines Indicate Resistance Levels – Red Lines Indicate Support Levels
Light Blue is a Pivot Point – Black represents the price when the report was produced
GBP/USD Intraday: Trend on the downside
Our pivot point is at 1.27260
Preferable Price Action: Buy positions above pivot with targets at 1.28680 & 1.29700 in extension.
Alternative Price Action: The price below pivot would call for further downside to 1.25860 & 1.24840.
Comment: RSI above 50 levels and Pair above its 20MA & 55MA.
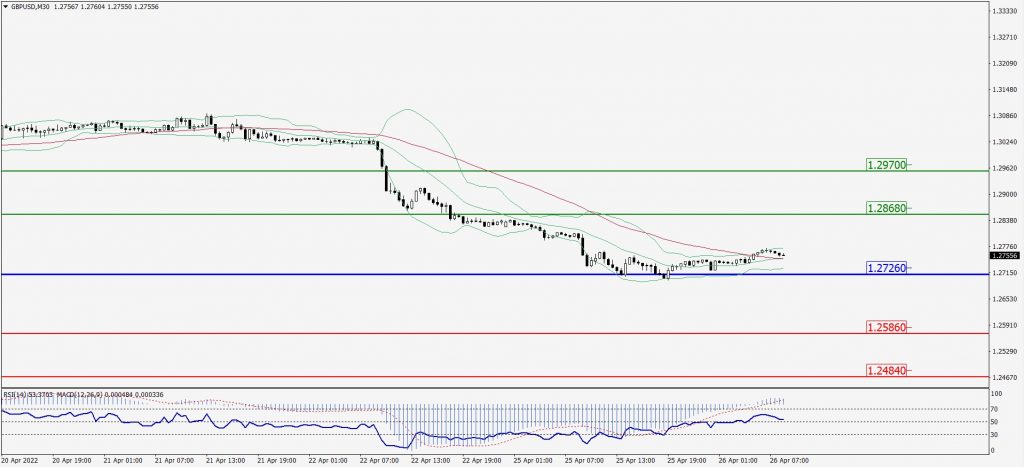
Green Lines Indicate Resistance Levels – Red Lines Indicate Support Levels
Light Blue is a Pivot Point – Black represents the price when the report was produced
USD/JPY Intraday: In a Consolidation Zone
Our pivot point is at 127.620
Preferable Price Action: Buy position above pivot with the target at 128.890 and 129.860 in extension.
Alternative Price Action: The downside breakout of the pivot would call for 126.490 and 125.650.
Comment: MACD in positive territory and Pair above 20MA.
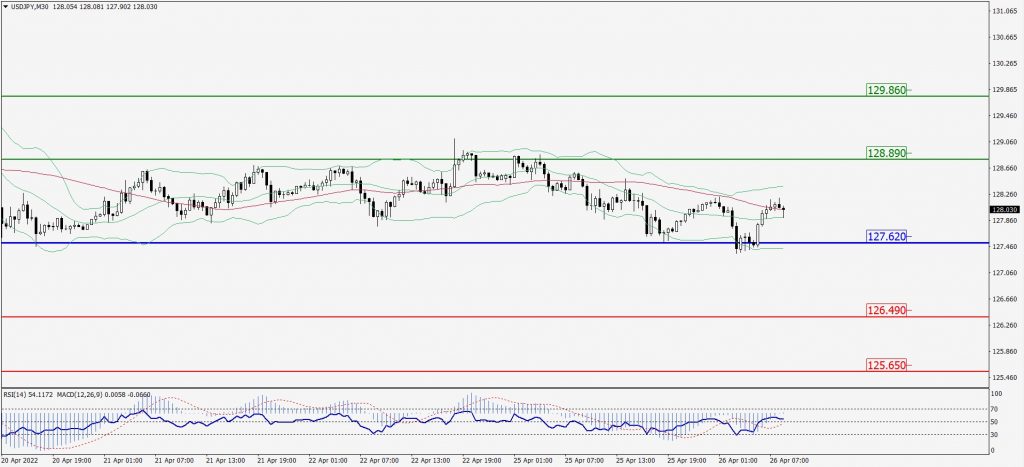
Green Lines Indicate Resistance Levels – Red Lines Indicate Support Levels
Light Blue is a Pivot Point – Black represents the price when the report was produced
AUD/USD Intraday: Trend on the downside
Our pivot point is at 0.72000
Preferable Price Action: Buy Positions above pivot with targets at 0.73350 & 0.74510 in extension.
Alternative Price Action: Below pivot looks for a further downside with 0.70600 & 0.69430 as targets.
Comment: RSI above 50 levels and Pair above its 20MA & 55MA.
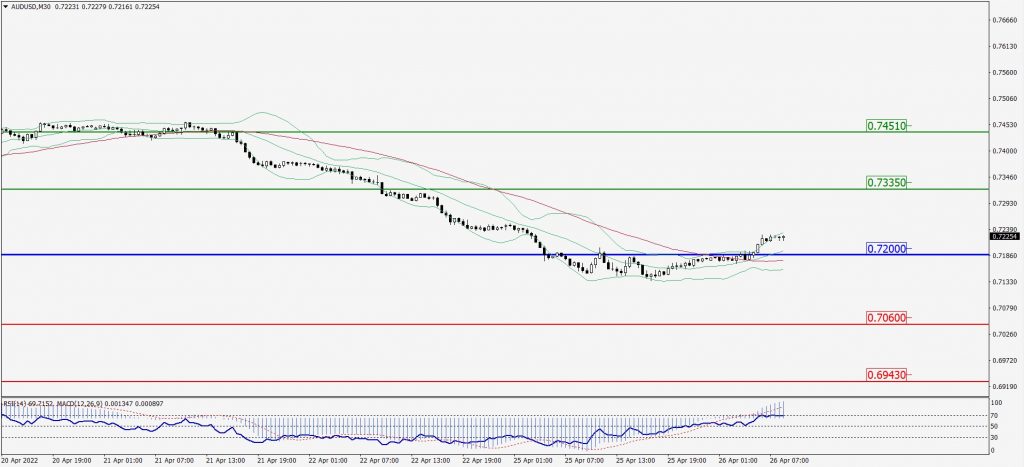
Green Lines Indicate Resistance Levels – Red Lines Indicate Support Levels
Light Blue is a Pivot Point – Black represents the price when the report was produced
CRUDEOIL Intraday: In a Consolidation Zone
Our pivot point is at 97.89
Preferable Price Action: Above pivots buy oil with 101.80 & 105.87 as targets.
Alternative Price Action: Sell crude below pivot with targets at 93.88 and 90.16 in extension.
Comment: MACD is in the positive territory and Pair above its 20MA & 55MA.
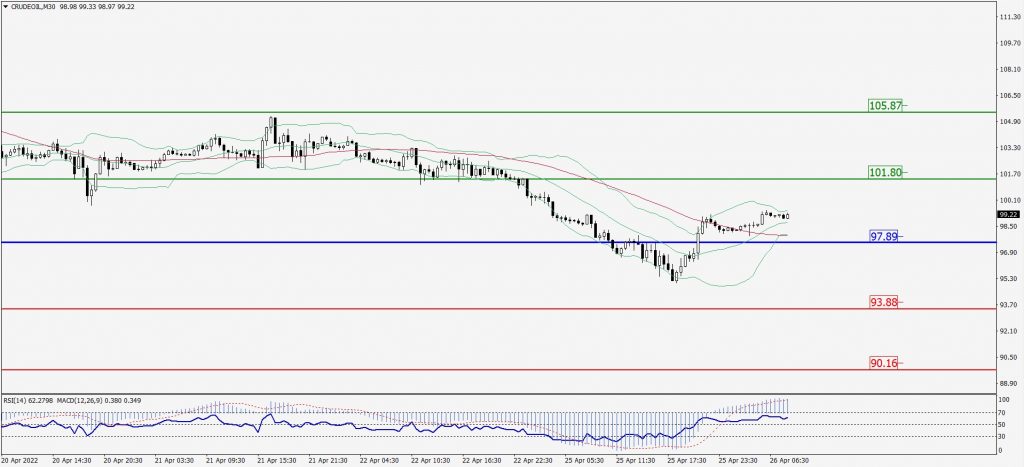
Green Lines Indicate Resistance Levels – Red Lines Indicate Support Levels
Light Blue is a Pivot Point – Black represents the price when the report was produced
XAU/USD Intraday: Trend on the downside
Our pivot point is 1899.30
Preferable Price Action: Further upside to 1923.60 and 1943.90.
Alternative Price Action: If the price gives a downside breakout of a pivot, then the price extends to 1874.20 and 1857.30.
Comment: MACD is a positive territory and Pair above 20MA.
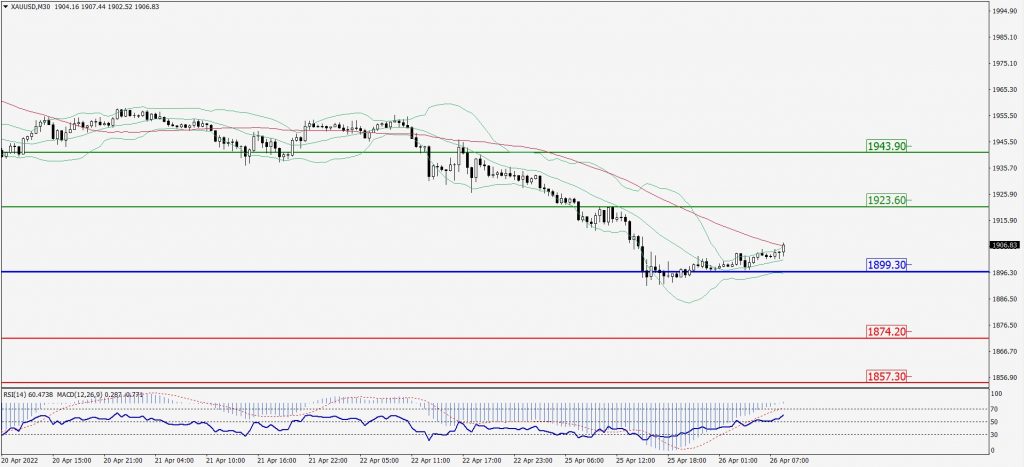
Green Lines Indicate Resistance Levels – Red Lines Indicate Support Levels
Light Blue is a Pivot Point – Black represents the price when the report was produced
Dow Jones Intraday: Trend on The Upside
Our pivot point is 33,962.00
Preferable Price Action: Take buy positions above pivot with targets at 34,797.00 & 35,518.00.
Alternative Price Action: Below 33,962.00 looks for further downside to 33,195.00 & 32,576.00.
Comment: RSI above 50 levels and pair above 55MA.
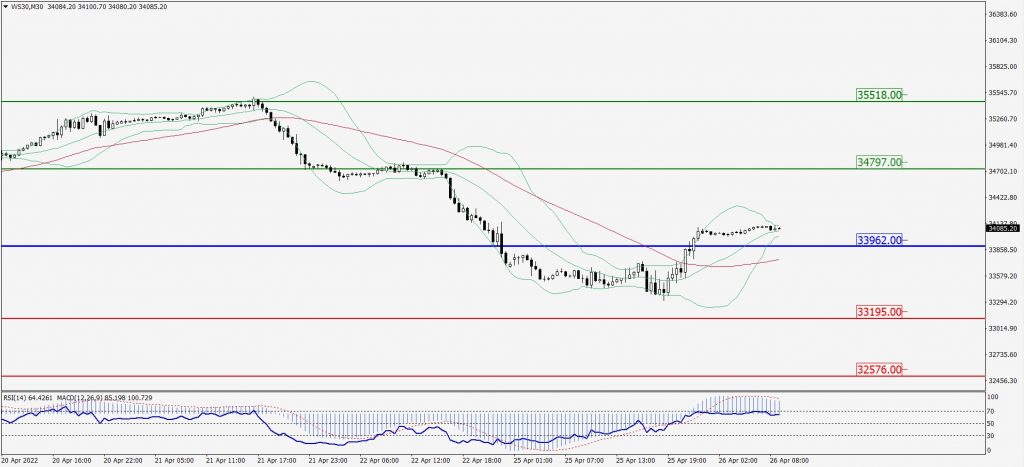
Green Lines Indicate Resistance Levels – Red Lines Indicate Support Levels
Light Blue is a Pivot Point – Black represents the price when the report was produced