Market Wrap: Stocks, Bonds, Commodities
Wall Street tumbled more than 2.5 percent on Friday, ensuring the three main benchmarks ended in negative territory for the week, as surprise earnings news and increased certainty around aggressive near-term interest rate rises took its toll on investors.
The S&P 500 lose (2.77%) ended at 4,271.78 points, while the Nasdaq Composite down 2.55% to 12,839.29. The Dow Jones Industrial was fell 2.82% to 33,811.40.
MSCI’s index of Asia-Pacific stocks outside Japan is drop 2.27% to 663.60 levels. Australian index lower 1.57% to 7,473.30. Japanese Nikkei Index slipped 1.90% to 26,590.78.
European stocks were negative on Monday, with the Stoxx Europe 50 Index lose 1.83% to 3,771.35, Germany’s DAX drop 1.21% to 13,968.37, and France’s CAC down 1.72% to 6,467.91, and U.K.’s FTSE 100 decrease 1.98% to 7,375.49.
Benchmark 10-year U.S. Treasury fell as demand for safe assets ascend again, today 10-year bond yields a negative 2.8350.
Oil prices slumped to about two-week lows on Monday, extending losses from last week, as concerns grew that prolonged COVID-19 lockdowns in Shanghai and potential U.S. rate hikes would hurt global economic growth and demand for fuel.
Spot Brent crude oil fell 4.59% to $101.32 per barrel. US West Texas Intermediate crude is down 4.66% to $97.30 a barrel.
The yellow metal gold is decline 0.97% to 1,915.60 dollars per ounce.
Market Wrap: Forex
The U.S. dollar climbed to a two-year high versus its rivals on Monday and was on track for its single biggest daily gain in more than six weeks as a wave of risk aversion swept through global markets, boosting the greenback’s safe-haven appeal.
Today, the U.S. dollar index measures the Greenback against a trade-weighted basket of six major currencies, which is an increase of 0.32% to 100.540.
The Euro US Dollar (EUR/USD) is a widely traded pair that is negative today. This left the pair trading around $1.07410.
The Japanese yen was positive against the U.S. dollar on Monday as the stock up. Today USD/JPY is fell 0.25% to 128.250 level.
Another commodity-related currency negative against the U.S dollar, AUD/USD drop 0.66 to 0.71910, and NZD/USD lower 0.33% to 0.66230 level.
EUR/USD Intraday: Trend on The Downside
Our pivot point is at 1.07720
Preferable Price Action: Take Sell positions below pivot level with targets at 1.06480 & 1.05630 in extension.
Alternative Price Action: Above pivot looks for a further upside to 1.09010 & 1.09830.
Comment: RSI below 50 levels and Pair below its 20MA & 55MA.
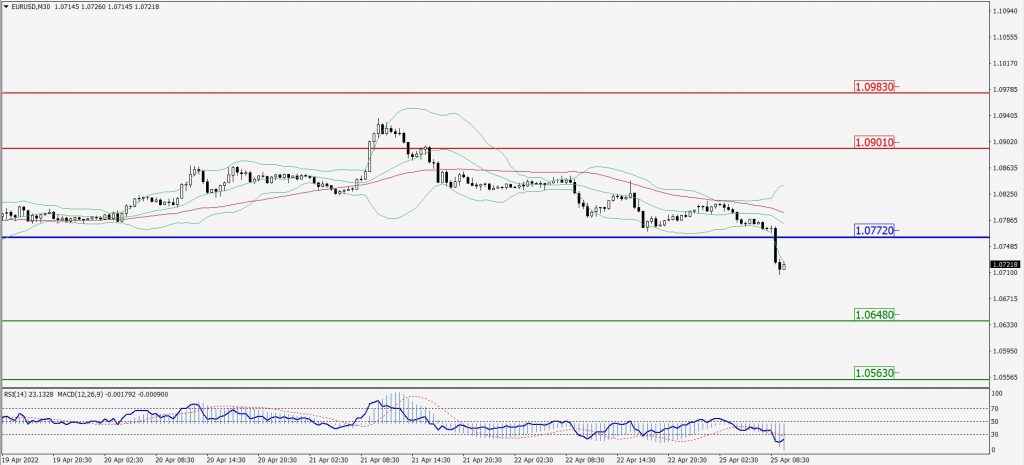
Green Lines Indicate Resistance Levels – Red Lines Indicate Support Levels
Light Blue is a Pivot Point – Black represents the price when the report was produced
GBP/USD Intraday: Trend on The Downside
Our pivot point is at 1.28200
Preferable Price Action: Sell positions below pivot with targets at 1.26500 & 1.25370 in extension.
Alternative Price Action: The price above pivot would call for further upside to 1.29730 & 1.30800.
Comment: RSI below 50 levels and Pair below its 20MA & 55MA.
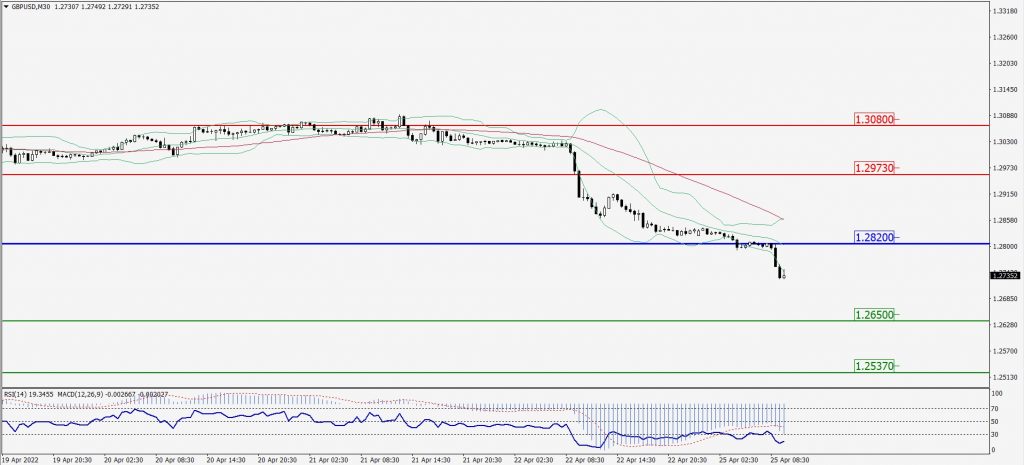
Green Lines Indicate Resistance Levels – Red Lines Indicate Support Levels
Light Blue is a Pivot Point – Black represents the price when the report was produced
USD/JPY Intraday: In a Consolidation Zone
Our pivot point is at 128.460
Preferable Price Action: Sell position below pivot with the target at 127.300 and 126.500 in extension.
Alternative Price Action: The upside breakout of the pivot would call for 129.500 and 130.240.
Comment: MACD in negative territory and Pair below its 20MA & 55MA.
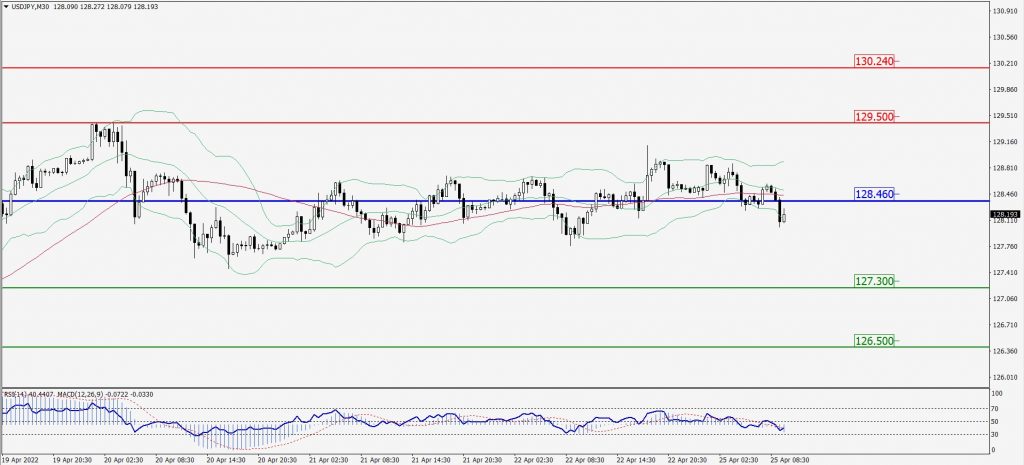
Green Lines Indicate Resistance Levels – Red Lines Indicate Support Levels
Light Blue is a Pivot Point – Black represents the price when the report was produced
AUD/USD Intraday: Major Trend on The Downside
Our pivot point is at 0.72220
Preferable Price Action: Sell Positions below pivot with targets at 0.70600 & 0.69450 in extension.
Alternative Price Action: Above pivot looks for a further upside with 0.73640 & 0.74870 as targets.
Comment: RSI below 50 levels and Pair below its 20MA & 55MA.
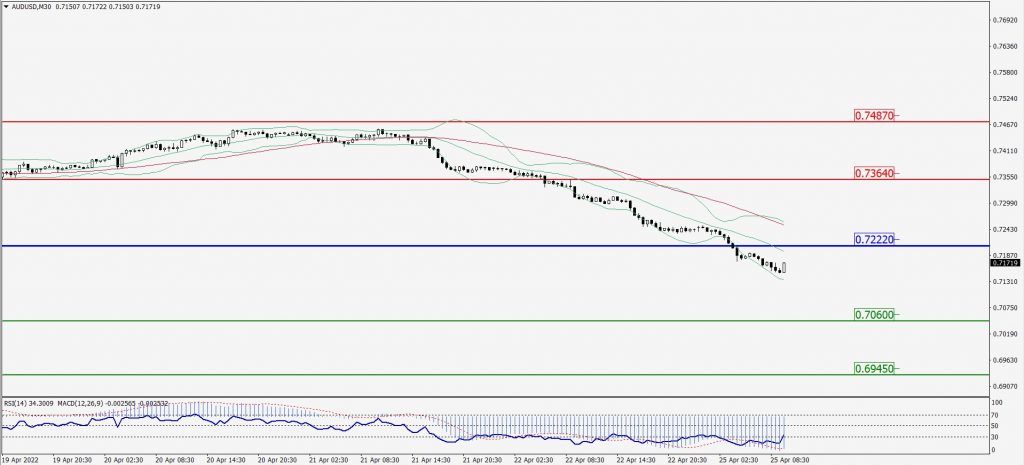
Green Lines Indicate Resistance Levels – Red Lines Indicate Support Levels
Light Blue is a Pivot Point – Black represents the price when the report was produced
CRUDEOIL Intraday: In a Consolidation Zone
Our pivot point is at 100.34
Preferable Price Action: Below pivots sell oil with 96.03 & 92.83 as targets.
Alternative Price Action: Buy crude above pivot with targets at 104.89 and 108.42 in extension.
Comment: MACD is in the negative territory and Pair below its 20MA & 55MA.
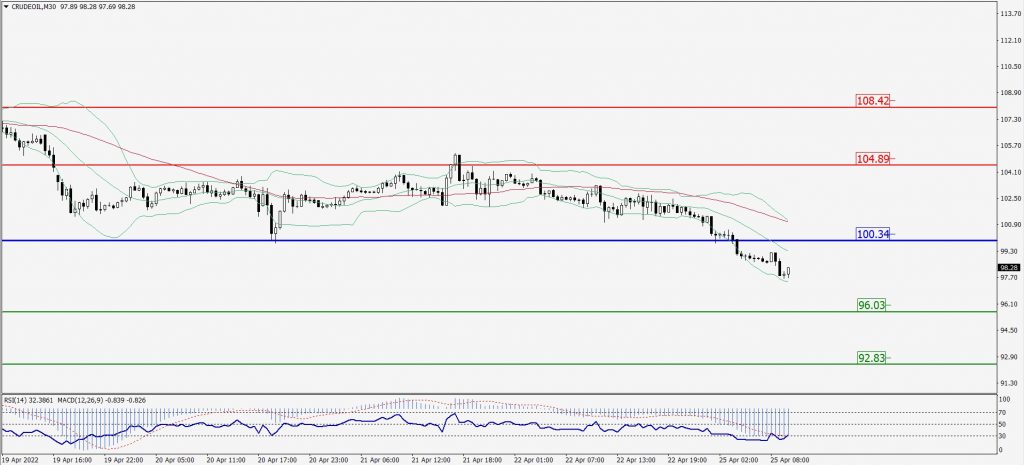
Green Lines Indicate Resistance Levels – Red Lines Indicate Support Levels
Light Blue is a Pivot Point – Black represents the price when the report was produced
XAU/USD Intraday: Major Support Level at 1931.90
Our pivot point is 1931.90
Preferable Price Action: Further downside to 1903.60 and 1884.30.
Alternative Price Action: If the price gives an upside breakout of a pivot, then the price extends to 1959.20 and 1979.70.
Comment: MACD is a negative territory and Pair below its 20MA & 55MA.
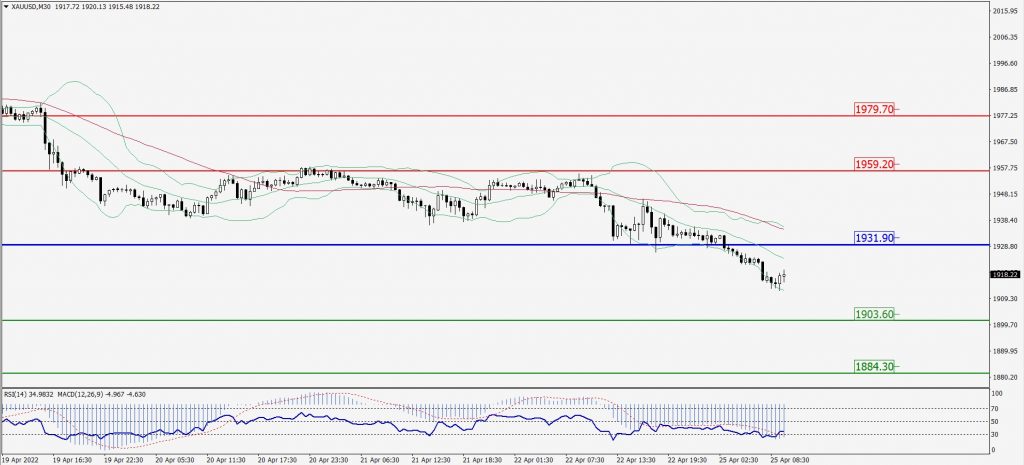
Green Lines Indicate Resistance Levels – Red Lines Indicate Support Levels
Light Blue is a Pivot Point – Black represents the price when the report was produced
Dow Jones Intraday: Trend on The Downside
Our pivot point is 33,948.00
Preferable Price Action: Take Sell positions below pivot with targets at 33,122.00 & 32,551.00.
Alternative Price Action: Above 33,122.00 looks for further upside to 34,709.00 & 35,374.00.
Comment: RSI below 50 levels and pair below 55MA.
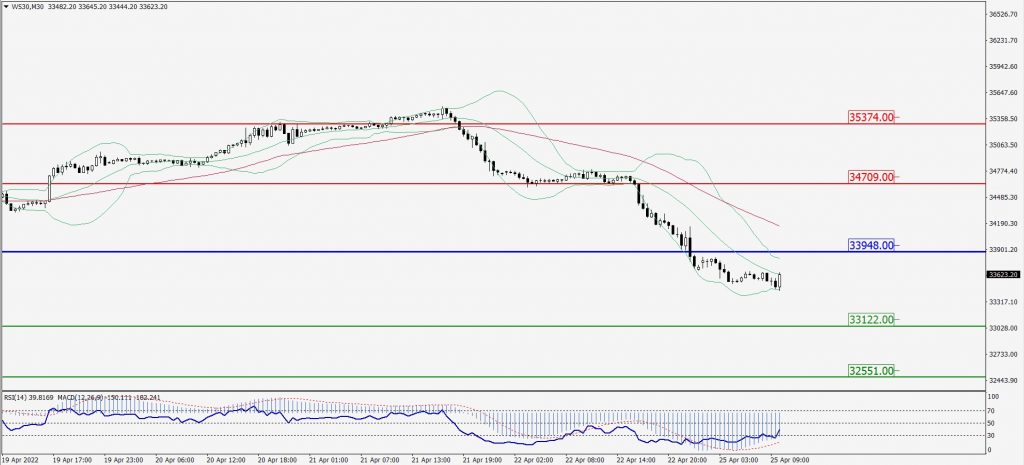
Green Lines Indicate Resistance Levels – Red Lines Indicate Support Levels
Light Blue is a Pivot Point – Black represents the price when the report was produced