Market Wrap: Stocks, Bonds, Commodities
Wall Street reversed course and posted losses on Thursday while oil gained as Federal Reserve Chairman Jerome Powell suggested the US central bank would move aggressively to curb inflation.
The S&P 500 lose (1.48%) ended at 4,393.66 points, while the Nasdaq Composite down 2.07% to 13,174.55. The Dow Jones Industrial was fell 1.05% to 34,792.76.
MSCI’s index of Asia-Pacific stocks outside Japan is drop 0.62% to 682.55 levels. Australian index lower 1.57% to 7,473.30. Japanese Nikkei Index slipped 1.63% to 27,105.26.
European stocks were negative on Friday, with the Stoxx Europe 50 Index lose 1.13% to 3,882.45 Germany’s DAX drop 1.17% to 14,334.19, and France’s CAC down 1.00% to 6,645.09, and U.K.’s FTSE 100 decrease 0.35% to 7,601.77.
Benchmark 10-year U.S. Treasury fell as demand for safe assets ascend again, today 10-year bond yields a positive 2.9470.
Oil prices rose on Thursday, buffeted by concerns about tightened supply as the European Union (EU) mulls a potential ban on Russian oil imports that would further restrict worldwide oil trade.
Spot Brent crude oil fell 0.74% to $107.51 per barrel. US West Texas Intermediate crude is down 0.78% to $103.00 a barrel.
The yellow metal gold is advance 0.20% to 1,951.90 dollars per ounce.
Market Wrap: Forex
The dollar rose broadly on Friday as higher U.S. yields hoisted it towards a seventh consecutive weekly gain on the yen and to multi-week highs against the Australian and New Zealand dollars.
Today, the U.S. dollar index measures the Greenback against a trade-weighted basket of six major currencies, which is an increase of 0.32% to 100.930.
The Euro US Dollar (EUR/USD) is a widely traded pair that is negative today. This left the pair trading around $1.08020.
The Japanese yen was positive against the U.S. dollar on Friday as the stock up. Today USD/JPY is fell 0.20% to 128.130 level.
Another commodity-related currency negative against the U.S dollar, AUD/USD drop 0.84 to 0.73090, and NZD/USD lower 0.90% to 0.66800 level.
EUR/USD Intraday: Trend on The Downside
Our pivot point is at 1.08520
Preferable Price Action: Take Sell positions below pivot level with targets at 1.07580 & 1.06900 in extension.
Alternative Price Action: Above pivot looks for a further upside to 1.09380 & 1.10130.
Comment: RSI below 50 levels and Pair below its 20MA & 55MA.
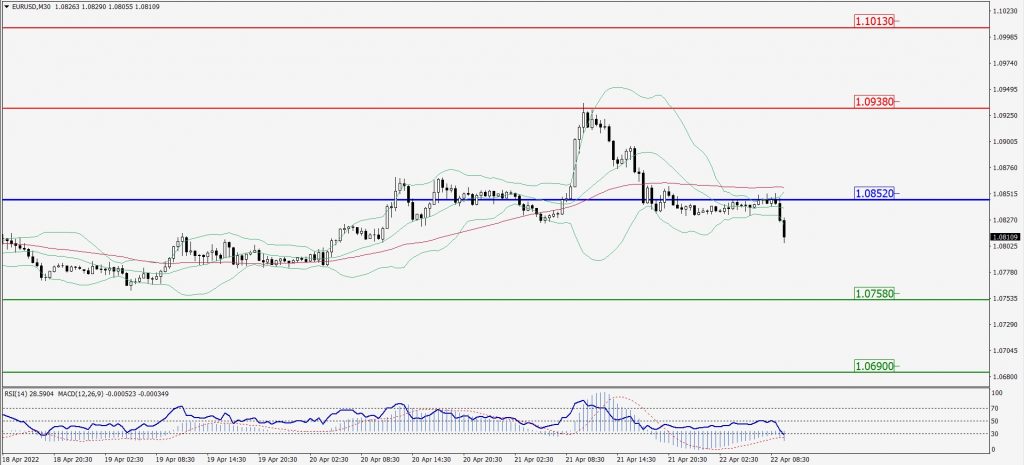
Green Lines Indicate Resistance Levels – Red Lines Indicates Support Levels
Light Blue is a Pivot Point – Black represents the price when the report was produced
GBP/USD Intraday: Trend on The Downside
Our pivot point is at 1.29760
Preferable Price Action: Sell positions below pivot with targets at 1.29080 & 1.28540 in extension.
Alternative Price Action: The price above pivot would call for further upside to 1.30440 & 1.30970.
Comment: RSI below 50 levels and Pair below its 20MA & 55MA.
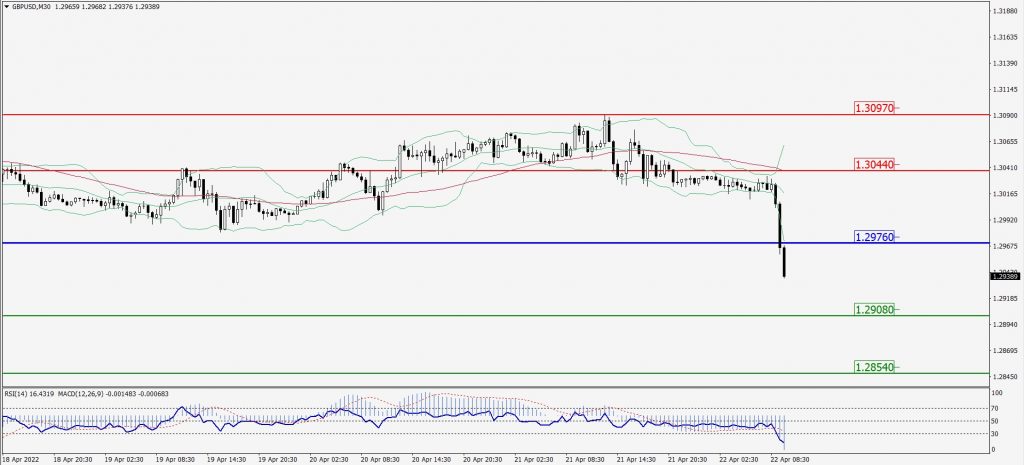
Green Lines Indicate Resistance Levels – Red Lines Indicates Support Levels
Light Blue is a Pivot Point – Black represents the price when the report was produced
USD/JPY Intraday: In a Consolidation Zone
Our pivot point is at 128.430
Preferable Price Action: Sell position below pivot with the target at 127.300 and 126.500 in extension.
Alternative Price Action: The upside breakout of the pivot would call for 129.500 and 130.240.
Comment: MACD in negative territory and Pair below its 20MA & 55MA.
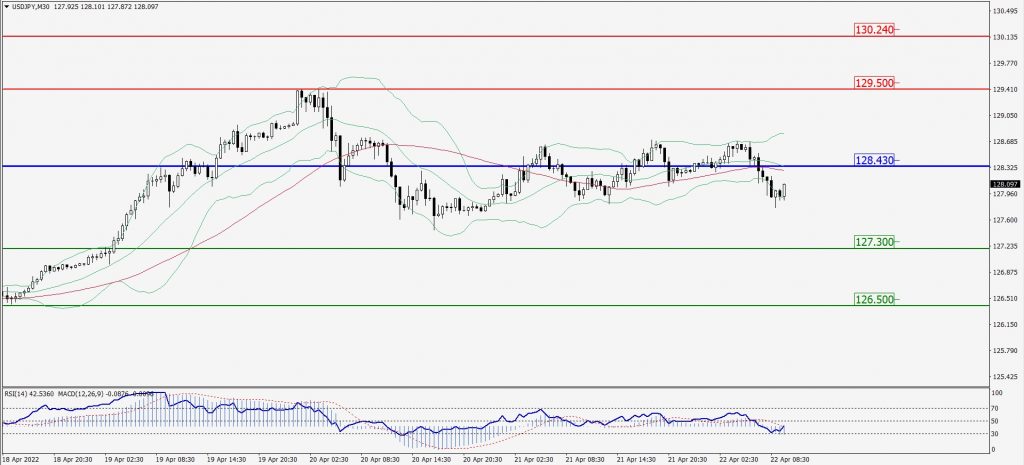
Green Lines Indicate Resistance Levels – Red Lines Indicates Support Levels
Light Blue is a Pivot Point – Black represents the price when the report was produced
AUD/USD Intraday: Trend on The Downside
Our pivot point is at 0.73540
Preferable Price Action: Sell Positions below pivot with targets at 0.72470 & 0.71720 in extension.
Alternative Price Action: Above pivot looks for a further upside with 0.74520 & 0.75200 as targets.
Comment: RSI below 50 levels and Pair below its 20MA & 55MA.
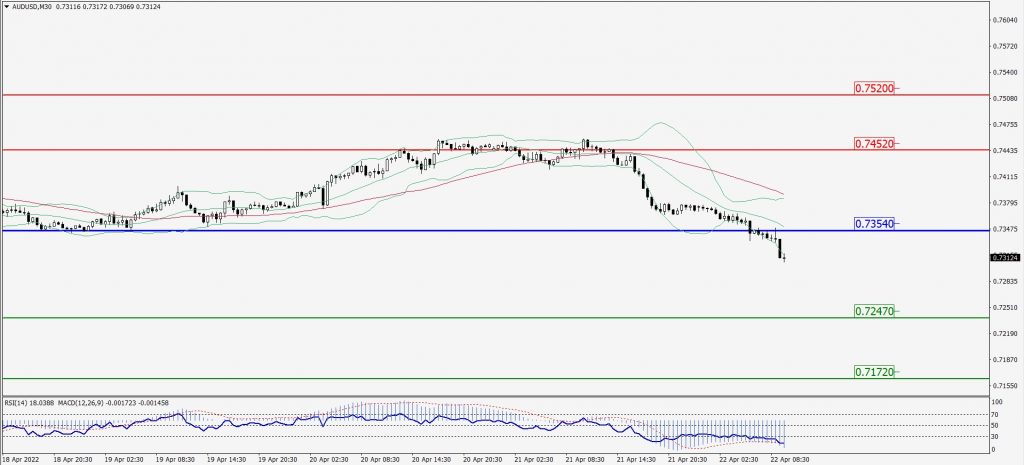
Green Lines Indicate Resistance Levels – Red Lines Indicates Support Levels
Light Blue is a Pivot Point – Black represents the price when the report was produced
CRUDEOIL Intraday: In a Consolidation Zone
Our pivot point is at 104.00
Preferable Price Action: Below pivots sell oil with 100.50 & 97.80 as targets.
Alternative Price Action: Buy crude above pivot with targets at 106.80 and 109.50 in extension.
Comment: MACD is in the negative territory and Pair below its 20MA & 55MA.
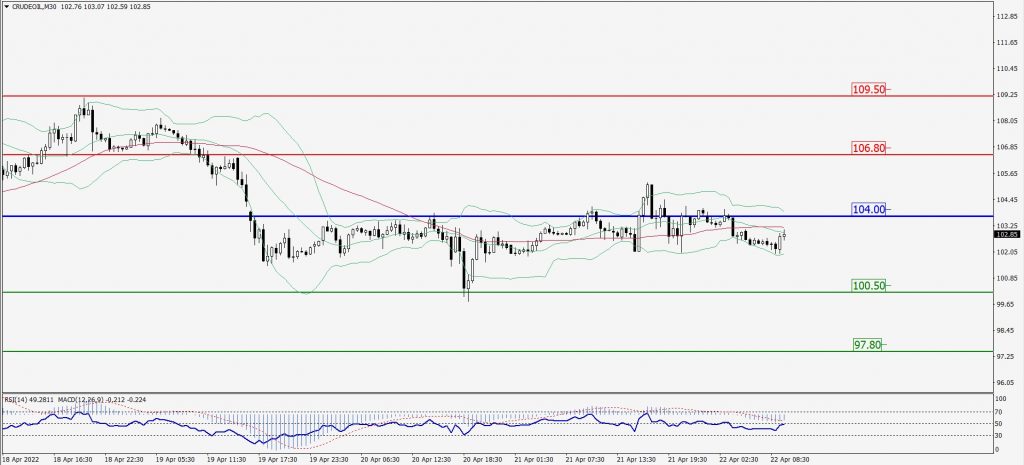
Green Lines Indicate Resistance Levels – Red Lines Indicates Support Levels
Light Blue is a Pivot Point – Black represents the price when the report was produced
XAU/USD Intraday: Major Support Level at 1944.00
Our pivot point is 1944.00
Preferable Price Action: Further upside to 1971.00 and 1990.00.
Alternative Price Action: If the price gives a downside breakout of a pivot, then the price extends to 1924.00 and 1908.00.
Comment: MACD is a positive territory and Pair above 55MA.
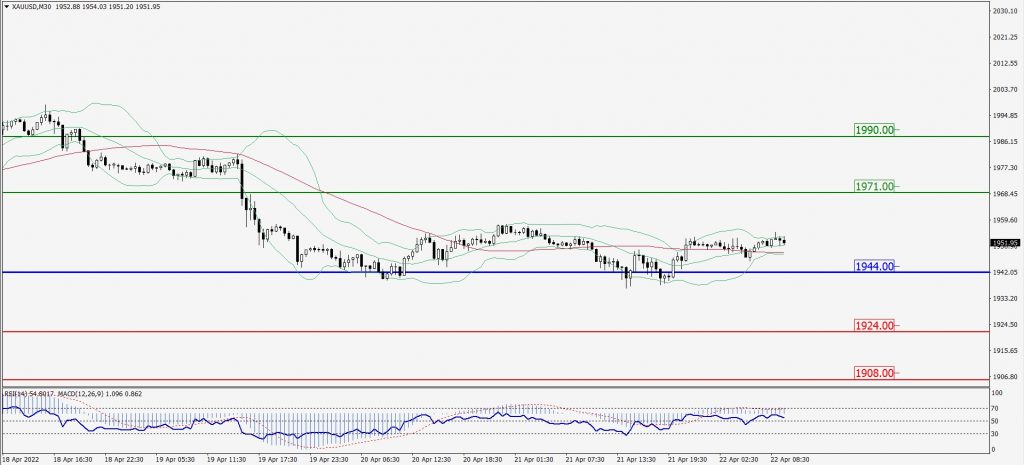
Green Lines Indicate Resistance Levels – Red Lines Indicates Support Levels
Light Blue is a Pivot Point – Black represents the price when the report was produced
Dow Jones Intraday: Trend on The Downside
Our pivot point is 34,883.00
Preferable Price Action: Take Sell positions below pivot with targets at 34,371.00 & 33,893.00.
Alternative Price Action: Above 34,883.00 looks for further upside to 35,371.00 & 35,803.00.
Comment: RSI below 50 levels and pair below 55MA.
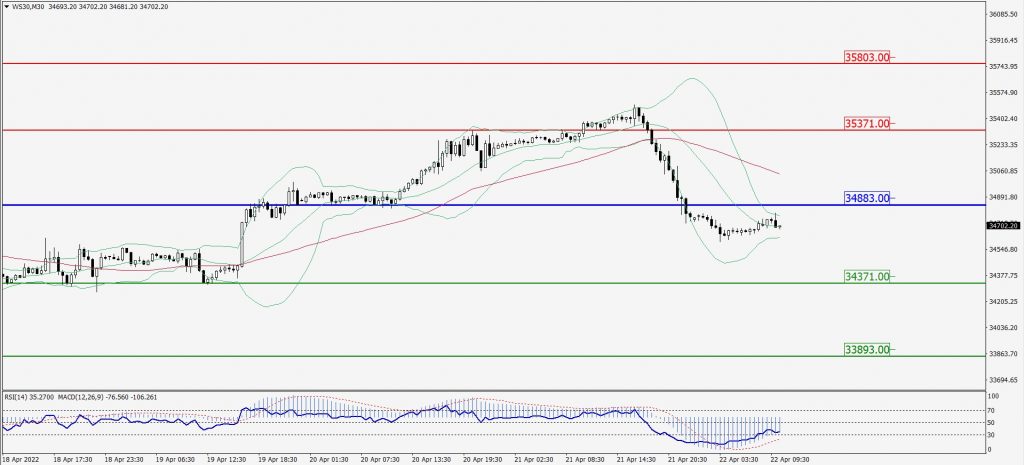
Green Lines Indicate Resistance Levels – Red Lines Indicates Support Levels
Light Blue is a Pivot Point – Black represents the price when the report was produced