Market Wrap: Stocks, Bonds, Commodities
US stocks ended in mixed territory on Wednesday as the tech-heavy Nasdaq was dragged down by bleak Netflix earnings, while bond yields dipped after a recent strong run.
The S&P 500 lose (0.06%) ended at 4,459.45 points, while the Nasdaq Composite down 1.22% to 13,453.07. The Dow Jones Industrial was rose 0.71% to 35,160.79.
MSCI’s index of Asia-Pacific stocks outside Japan is drop 0.53% to 688.14 levels. Australian index higher 0.31% to 7,592.80. Japanese Nikkei Index surge 1.23% to 27,553.06.
European stocks were positive on Thursday, with the Stoxx Europe 50 Index gain 1.13% to 3,940.95 Germany’s DAX ascend 1.11% to 14,517.61, and France’s CAC up 1.51% to 6,724.80, and U.K.’s FTSE 100 decrease 0.07% to 7,624.98.
Benchmark 10-year U.S. Treasury fell as demand for safe assets ascend again, today 10-year bond yields a positive 2.8730.
Oil prices traded higher but in a narrow range on Thursday, after being rocked earlier in the week by supply losses from Libya and a worrying outlook for demand as the International Monetary Fund cut its global growth forecasts.
Spot Brent crude oil rose 1.78% to $108.71 per barrel. US West Texas Intermediate crude is up 1.65% to $103.86 a barrel.
The yellow metal gold is decline 0.34% to 1,949.10 dollars per ounce.
Market Wrap: Forex
The euro perked up to a one-week high on Thursday as market expectations solidified for a first interest rate hike from the European Central Bank as early as July.
Today, the U.S. dollar index measures the Greenback against a trade-weighted basket of six major currencies, which is a decrease of 0.50% to 99.910.
The Euro US Dollar (EUR/USD) is a widely traded pair that is positive today. This left the pair trading around $1.09210.
The Japanese yen was positive against the U.S. dollar on Thursday as the stock up. Today USD/JPY is rose 0.21% to 128.150 level.
Another commodity-related currency negative against the U.S dollar, AUD/USD flat to 0.74510, and NZD/USD lower 0.07% to 0.67990 level.
EUR/USD Intraday: Major Trend on The Upside
Our pivot point is at 1.08920
Preferable Price Action: Take Buy positions above pivot level with targets at 1.09500 & 1.09990 in extension.
Alternative Price Action: Below pivot looks for a further downside to 1.08370 & 1.07860.
Comment: RSI above 50 levels and Pair above its 20MA & 55MA.
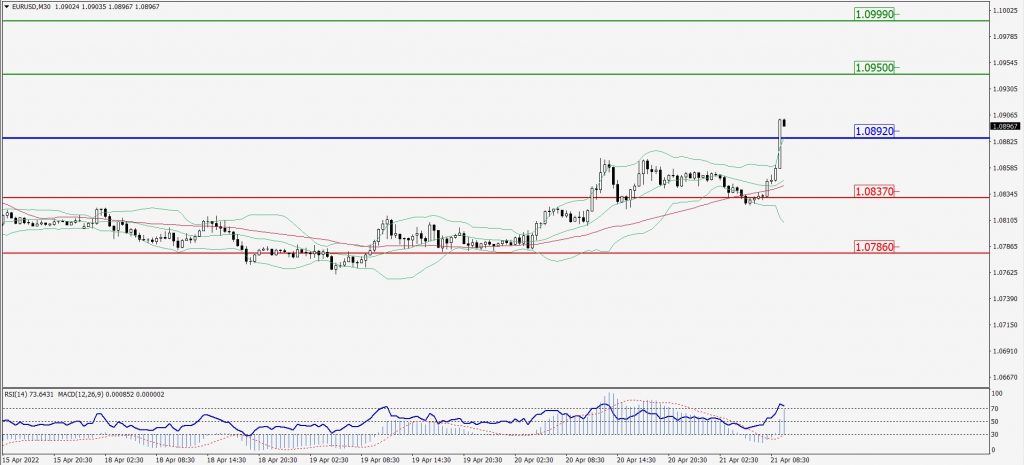
Green Lines Indicate Resistance Levels – Red Lines Indicates Support Levels
Light Blue is a Pivot Point – Black represents the price when the report was produced
GBP/USD Intraday: Trend on The Upside
Our pivot point is at 1.30610
Preferable Price Action: Buy positions above pivot with targets at 1.31060 & 1.31410 in extension.
Alternative Price Action: The price below pivot would call for further downside to 1.30140 & 1.29790.
Comment: RSI above 50 levels and Pair above its 20MA & 55MA.
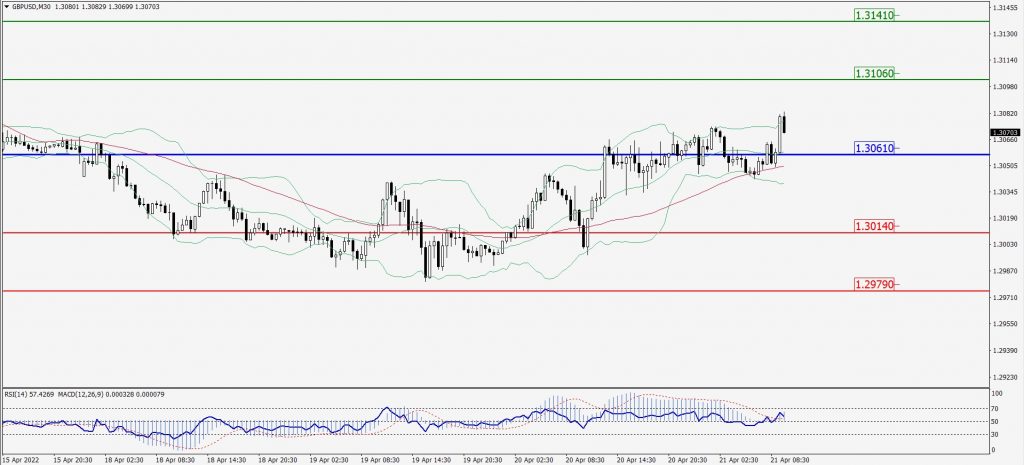
Green Lines Indicate Resistance Levels – Red Lines Indicates Support Levels
Light Blue is a Pivot Point – Black represents the price when the report was produced
USD/JPY Intraday: In a Consolidation Zone
Our pivot point is at 128.430
Preferable Price Action: Sell position below pivot with the target at 127.300 and 126.500 in extension.
Alternative Price Action: The upside breakout of the pivot would call for 129.500 and 130.240.
Comment: MACD in negative territory and Pair below its 20MA & 55MA.
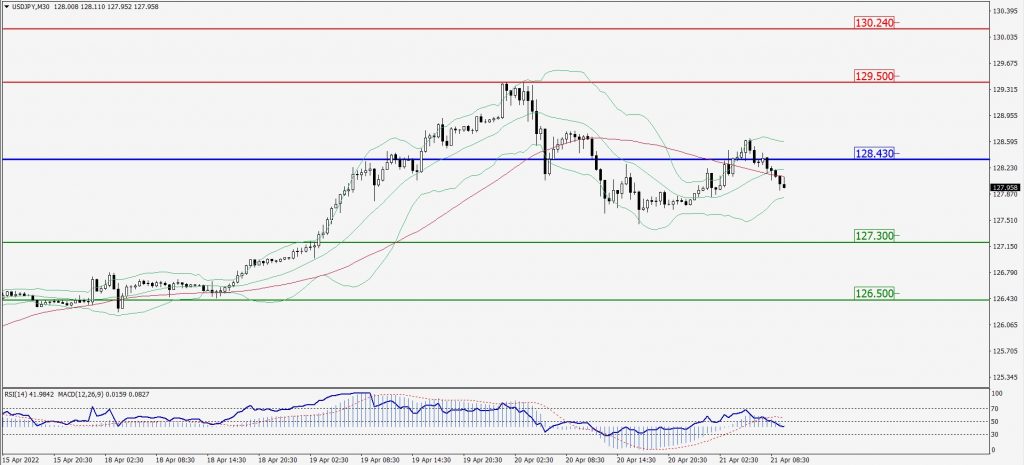
Green Lines Indicate Resistance Levels – Red Lines Indicates Support Levels
Light Blue is a Pivot Point – Black represents the price when the report was produced
AUD/USD Intraday: Trend on The Upside
Our pivot point is at 0.74280
Preferable Price Action: Buy Positions above pivot with targets at 0.74850 & 0.75210 in extension.
Alternative Price Action: Below pivot looks for a further downside with 0.73820 & 0.73440 as targets.
Comment: RSI at 50 levels and Pair above 55MA.
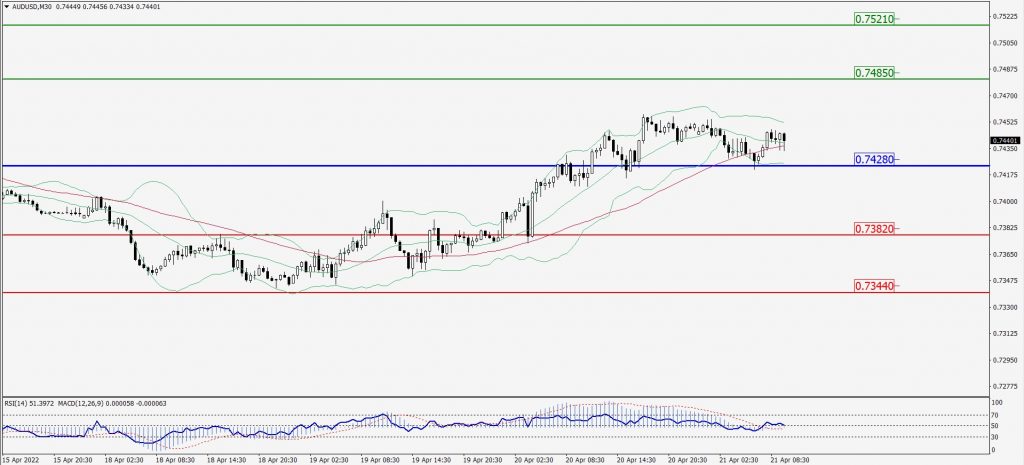
Green Lines Indicate Resistance Levels – Red Lines Indicates Support Levels
Light Blue is a Pivot Point – Black represents the price when the report was produced
CRUDEOIL Intraday: In a Consolidation Zone
Our pivot point is at 102.60
Preferable Price Action: Above pivots buy oil with 105.60 & 108.04 as targets.
Alternative Price Action: Sell crude below pivot with targets at 99.87 and 97.77 in extension.
Comment: MACD is in the positive territory and Pair above its 20MA & 55MA.
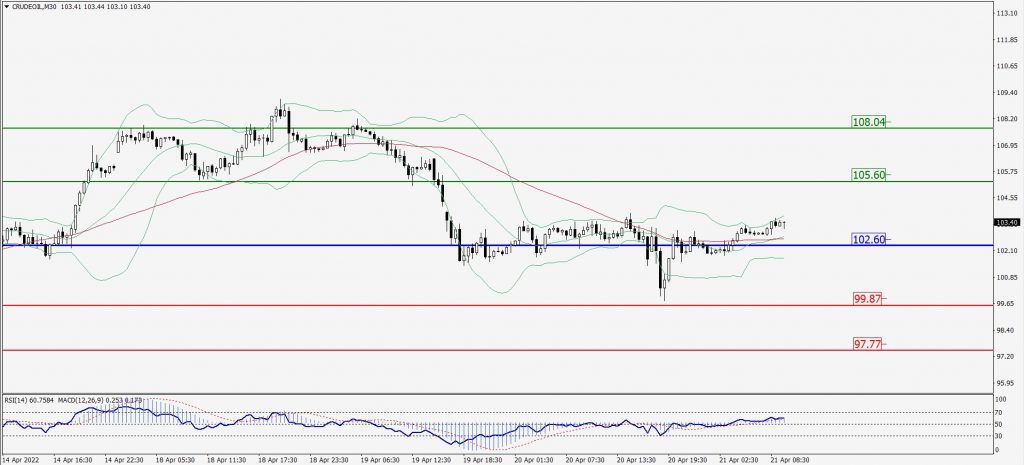
Green Lines Indicate Resistance Levels – Red Lines Indicates Support Levels
Light Blue is a Pivot Point – Black represents the price when the report was produced
XAU/USD Intraday: Trend on the Downside
Our pivot point is 1957.80
Preferable Price Action: Further downside to 1934.90 and 1916.80.
Alternative Price Action: If the price gives an upside breakout of a pivot, then the price extends to 1981.60 and 1998.90.
Comment: MACD is a negative territory and Pair below 20MA.
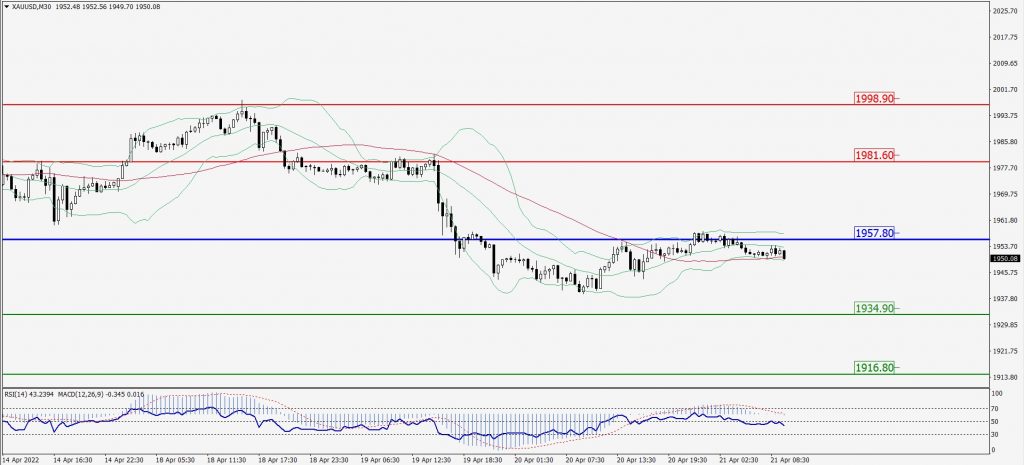
Green Lines Indicate Resistance Levels – Red Lines Indicates Support Levels
Light Blue is a Pivot Point – Black represents the price when the report was produced
Dow Jones Intraday: Trend on The Upside
Our pivot point is 35,172.00
Preferable Price Action: Take Buy positions above pivot with targets at 35,677.00 & 36,001.00.
Alternative Price Action: Below 35,172.00 looks for further downside to 34,722.00 & 34,372.00.
Comment: RSI above 50 levels and pair above 55MA.
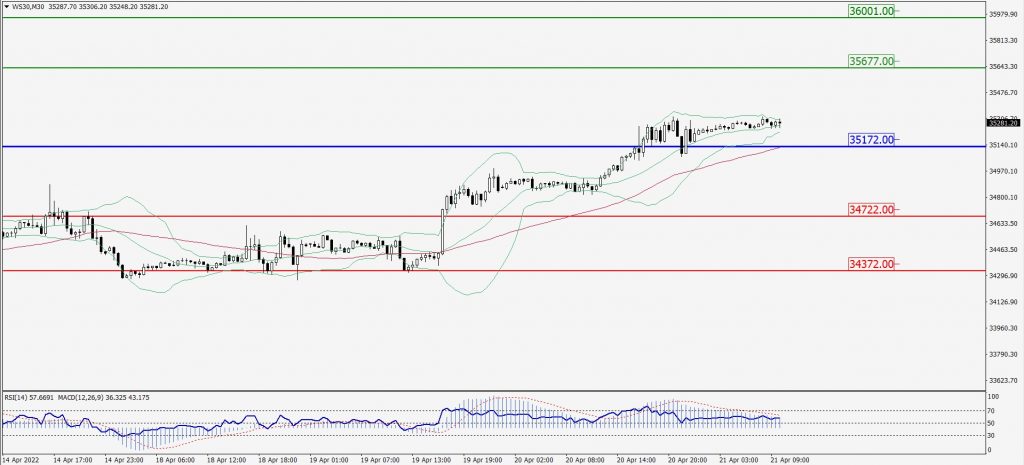
Green Lines Indicate Resistance Levels – Red Lines Indicates Support Levels
Light Blue is a Pivot Point – Black represents the price when the report was produced