Market Wrap: Stocks, Bonds, Commodities
US stocks surged on Tuesday on the back of stronger-than-expected corporate earnings, but bleak forecasts on global economic growth pushed bond yields up and drove oil down.
The S&P 500 gain (1.61%) ended at 4,462.21 points, while the Nasdaq Composite up 2.15% to 13,619.66. The Dow Jones Industrial was rose 1.45% to 34,911.20.
MSCI’s index of Asia-Pacific stocks outside Japan is ascend 0.08% to 692.89 levels. Australian index higher 0.05% to 7,569.20. Japanese Nikkei Index surge 0.86% to 27,217.85.
European stocks were positive on Wednesday, with the Stoxx Europe 50 Index gain 0.53% to 3,851.95 Germany’s DAX ascend 0.22% to 14,184.82, and France’s CAC up 0.54% to 6,569.80, and U.K.’s FTSE 100 increase 0.14% to 7,612.00.
Benchmark 10-year U.S. Treasury fell as demand for safe assets ascend again, today 10-year bond yields a negative 2.9090.
Oil prices rose about 1 percent on Wednesday, gaining back some of their losses during the previous session on concerns about energy demand after the International Monetary Fund (IMF) cut its economic growth forecasts.
Spot Brent crude oil rose 1.36% to $108.66 per barrel. US West Texas Intermediate crude is up 1.34% to $103.41 a barrel.
The yellow metal gold is decline 0.75% to 1,944.40 dollars per ounce.
Market Wrap: Forex
The U.S. dollar edged lower in early European trade Wednesday, slipping back from a fresh 20-year high against the Japanese yen, but remained elevated as more Federal Reserve officials pointed to upcoming hefty interest rate hikes.
Today, the U.S. dollar index measures the Greenback against a trade-weighted basket of six major currencies, which is a decrease of 0.15% to 100.810.
The Euro US Dollar (EUR/USD) is a widely traded pair that is positive today. This left the pair trading around $1.08050.
The Japanese yen was positive against the U.S. dollar on Wednesday as the stock up. Today USD/JPY is fell 0.16% to 128.190 level.
Another commodity-related currency positive against the U.S dollar, AUD/USD up 0.60% to 0.74150, and NZD/USD higher 0.59% to 0.67750 level.
EUR/USD Intraday: Major Support Level at 1.08000
Our pivot point is at 1.08000
Preferable Price Action: Take Buy positions above pivot level with targets at 1.08490 & 1.08880 in extension.
Alternative Price Action: Below pivot looks for a further downside to 1.07560 & 1.07200.
Comment: RSI above 50 levels and Pair above its 20MA & 55MA.
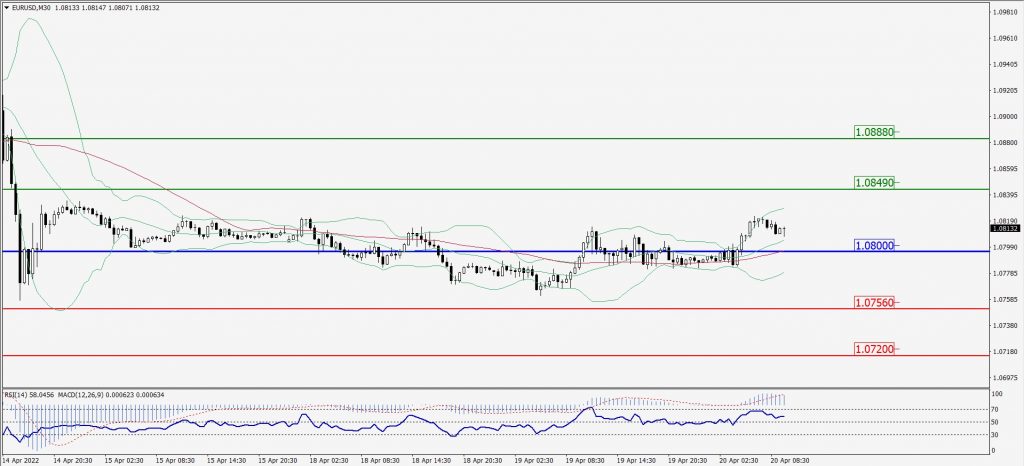
Green Lines Indicate Resistance Levels – Red Lines Indicates Support Levels
Light Blue is a Pivot Point – Black represents the price when the report was produced
GBP/USD Intraday: In a Consolidation Zone
Our pivot point is at 1.30290
Preferable Price Action: Sell positions below pivot with targets at 1.29780 & 1.29400 in extension.
Alternative Price Action: The price above pivot would call for further upside to 1.30740 & 1.31180.
Comment: RSI below 50 levels and Pair below 20MA.
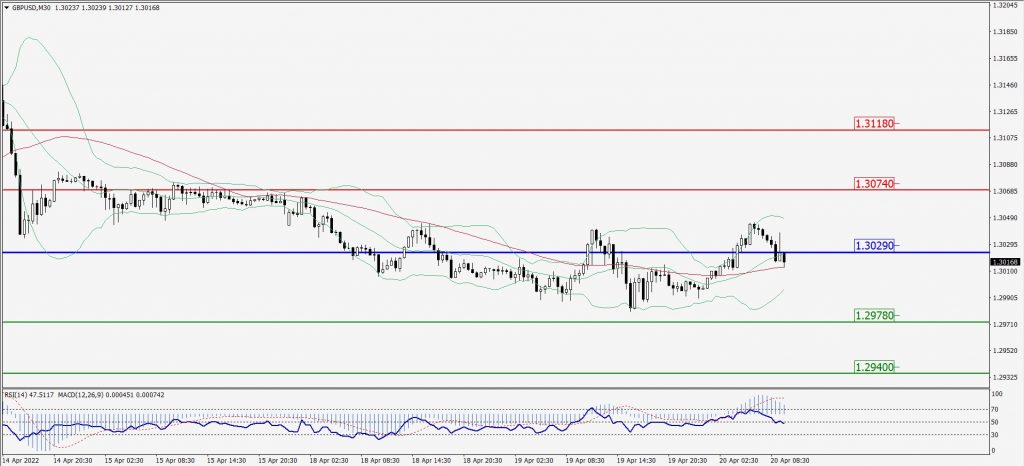
Green Lines Indicate Resistance Levels – Red Lines Indicates Support Levels
Light Blue is a Pivot Point – Black represents the price when the report was produced
USD/JPY Intraday: May Trend Reverse from 129.060
Our pivot point is at 129.060
Preferable Price Action: Sell position below pivot with the target at 127.820 and 126.650 in extension.
Alternative Price Action: The upside breakout of the pivot would call for 130.110 and 130.920.
Comment: MACD in negative territory and Pair below 20MA.
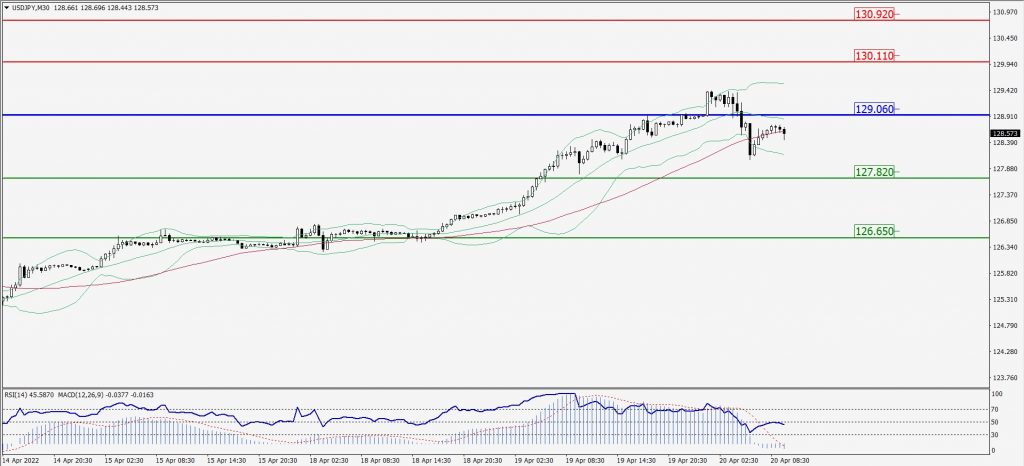
Green Lines Indicate Resistance Levels – Red Lines Indicates Support Levels
Light Blue is a Pivot Point – Black represents the price when the report was produced
AUD/USD Intraday: Major Trend on The Upside
Our pivot point is at 0.74050
Preferable Price Action: Buy Positions above pivot with targets at 0.74500 & 0.74800 in extension.
Alternative Price Action: Below pivot looks for a further downside with 0.73640 & 0.73370 as targets.
Comment: RSI above 50 levels and Pair above its 20MA & 55MA.
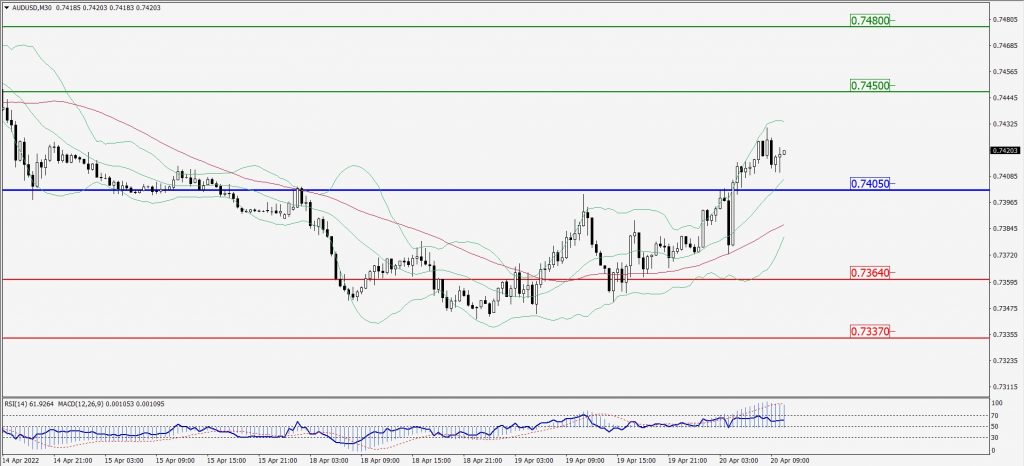
Green Lines Indicate Resistance Levels – Red Lines Indicates Support Levels
Light Blue is a Pivot Point – Black represents the price when the report was produced
CRUDEOIL Intraday: In a Consolidation Zone
Our pivot point is at 105.00
Preferable Price Action: Below pivots sell oil with 100.27 & 96.08 as targets.
Alternative Price Action: Buy crude above pivot with targets at 109.81 and 113.60 in extension.
Comment: MACD is in the flat territory and Pair below 55MA.
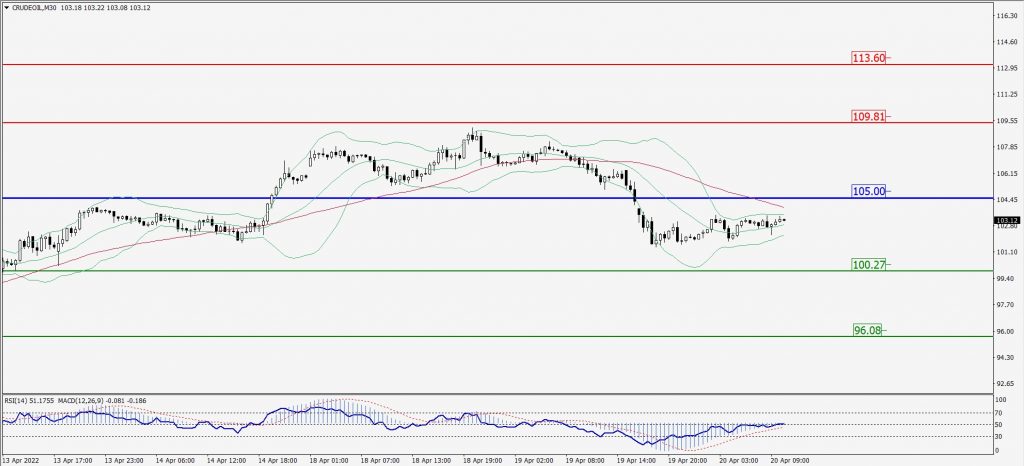
Green Lines Indicate Resistance Levels – Red Lines Indicates Support Levels
Light Blue is a Pivot Point – Black represents the price when the report was produced
XAU/USD Intraday: Trend on the Downside
Our pivot point is 1952.40
Preferable Price Action: Further downside to 1925.90 and 1903.00.
Alternative Price Action: If the price gives an upside breakout of a pivot, then the price extends to 1978.70 and 2002.70.
Comment: MACD is a negative territory and Pair below its 20MA & 55MA.
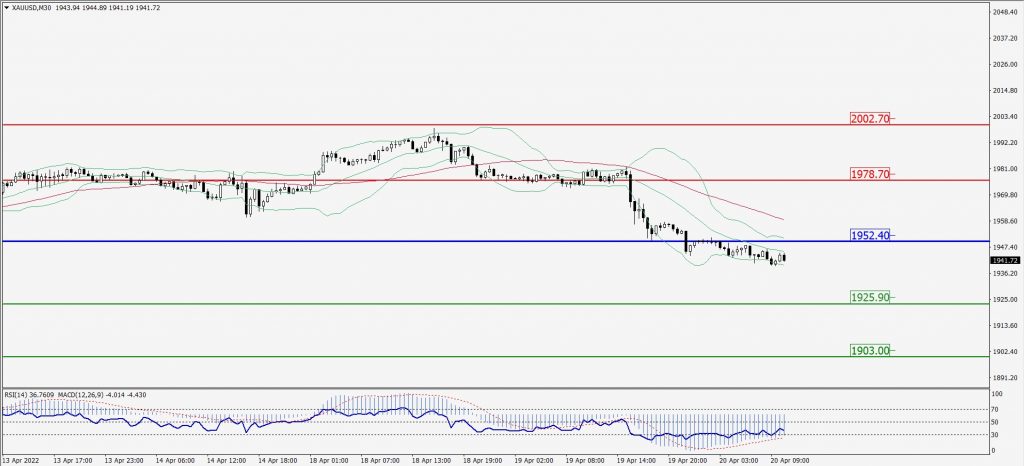
Green Lines Indicate Resistance Levels – Red Lines Indicates Support Levels
Light Blue is a Pivot Point – Black represents the price when the report was produced
Dow Jones Intraday: Trend on The Upside
Our pivot point is 34,826.00
Preferable Price Action: Take Buy positions above pivot with targets at 35,131.00 & 35,353.00.
Alternative Price Action: Above 34,826.00 looks for further downside to 34,551.00 & 34,318.00.
Comment: RSI above 50 levels and pair above its 20MA & 55MA.
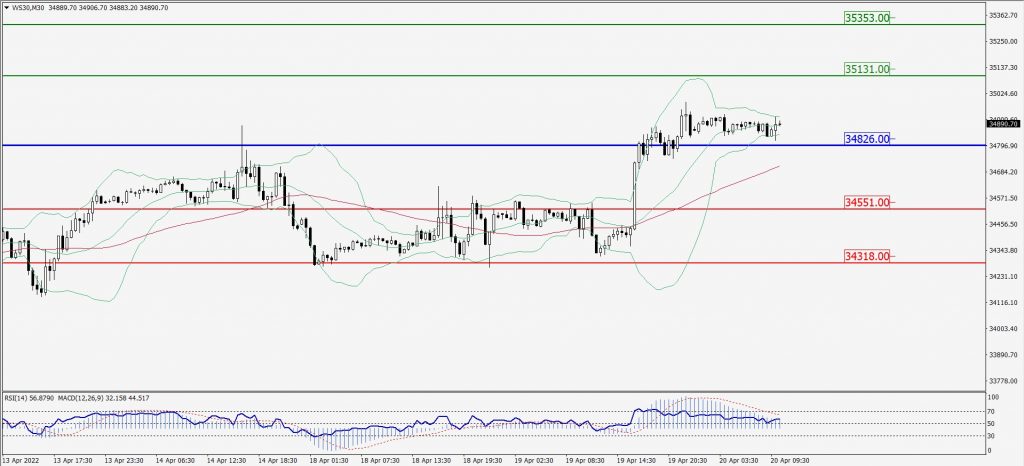
Green Lines Indicate Resistance Levels – Red Lines Indicates Support Levels
Light Blue is a Pivot Point – Black represents the price when the report was produced