Market Wrap: Stocks, Bonds, Commodities
Wall Street ended the day lower in a choppy trading day on Monday, while US Treasury yields jumped as investors juggled strong earnings with what Russia’s invasion of Ukraine could mean for global growth.
The S&P 500 lose (0.02%) ended at 4,391.69 points, while the Nasdaq Composite down 0.14% to 13,332.36. The Dow Jones Industrial was fell 0.11% to 34,411.69.
MSCI’s index of Asia-Pacific stocks outside Japan is drop 0.72% to 693.90 levels. Australian index higher 0.56% to 7,565.20. Japanese Nikkei Index surge 0.69% to 26,985.09.
European stocks were negative on Tuesday, with the Stoxx Europe 50 Index lose 0.54% to 3,827.95 Germany’s DAX drop 0.55% to 14,084.42, and France’s CAC down 0.66% to 6,546.00, and U.K.’s FTSE 100 decrease 0.03% to 7,614.27.
Benchmark 10-year U.S. Treasury fell as demand for safe assets ascend again, today 10-year bond yields a positive 2.866.
Oil prices rose more than one percent on Monday, with Brent crude topping $114 a barrel, as outages in Libya deepened concern over tight global supply amid the Ukraine crisis.
Spot Brent crude oil fell 0.69% to $112.39 per barrel. US West Texas Intermediate crude is down 0.88% to $106.72 a barrel.
The yellow metal gold is decline 0.19% to 1,982.75 dollars per ounce.
Market Wrap: Forex
Japanese Finance Minister Shunichi Suzuki said on Tuesday the damage to the economy from a weakening yen at present is greater than the benefits accruing to it, making the most explicit warning yet against the currency’s recent slump versus the dollar.
Today, the U.S. dollar index measures the Greenback against a trade-weighted basket of six major currencies, which is a decrease of 0.02% to 100.750.
The Euro US Dollar (EUR/USD) is a widely traded pair that is positive today. This left the pair trading around $1.08050.
The Japanese yen was positive against the U.S. dollar on Tuesday as the stock up. Today USD/JPY is rose 0.95% to 128.190 level.
Another commodity-related currency positive against the U.S dollar, AUD/USD up 0.70% to 0.73970, and NZD/USD higher 0.39% to 0.67610 level.
EUR/USD Intraday: Major Support Level at 1.07750
Our pivot point is at 1.07750
Preferable Price Action: Take Buy positions above pivot level with targets at 1.08280 & 1.08650 in extension.
Alternative Price Action: Below pivot looks for a further downside to 1.07350 & 1.07010.
Comment: RSI above 50 levels and Pair above 20MA.
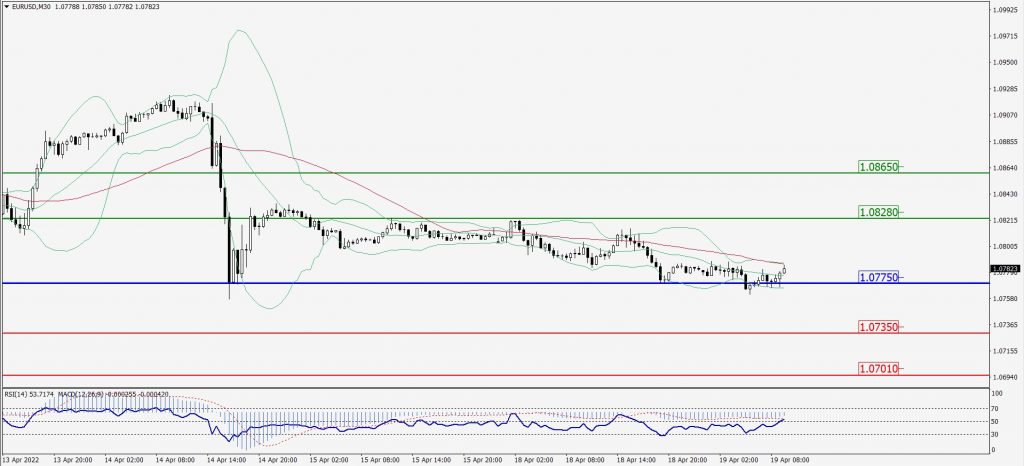
Green Lines Indicate Resistance Levels – Red Lines Indicates Support Levels
Light Blue is a Pivot Point – Black represents the price when the report was produced
GBP/USD Intraday: Trend on The Downside
Our pivot point is at 1.30270
Preferable Price Action: Sell positions below pivot with targets at 1.29790 & 1.29400 in extension.
Alternative Price Action: The price above pivot would call for further upside to 1.30740 & 1.31180.
Comment: RSI below 50 levels and Pair below 55MA.
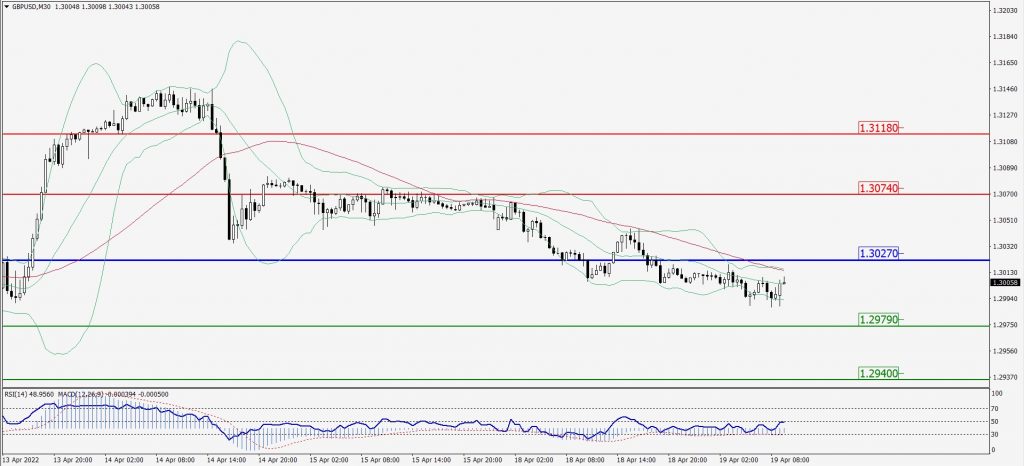
Green Lines Indicate Resistance Levels – Red Lines Indicates Support Levels
Light Blue is a Pivot Point – Black represents the price when the report was produced
USD/JPY Intraday: Major Trend on The Upside
Our pivot point is at 127.990
Preferable Price Action: Buy position above pivot with the target at 128.970 and 129.660 in extension.
Alternative Price Action: The downside breakout of the pivot would call for 127.140 and 126.380.
Comment: MACD in positive territory and Pair above its 20MA & 55MA.
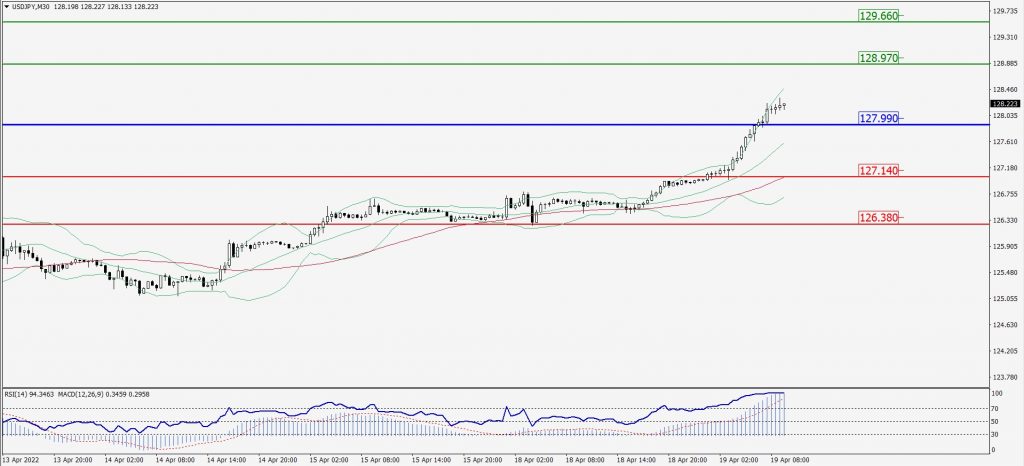
Green Lines Indicate Resistance Levels – Red Lines Indicates Support Levels
Light Blue is a Pivot Point – Black represents the price when the report was produced
AUD/USD Intraday: In a Consolidation Zone
Our pivot point is at 0.73580
Preferable Price Action: Buy Positions above pivot with targets at 0.74200 & 0.74640 in extension.
Alternative Price Action: Below pivot looks for a further downside with 0.73070 & 0.72690 as targets.
Comment: RSI above 50 levels and Pair above its 20MA & 55MA.
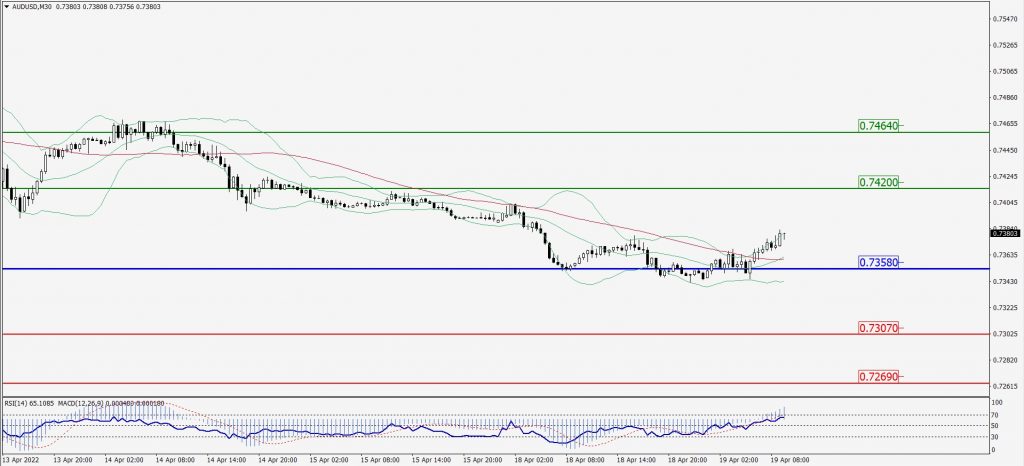
Green Lines Indicate Resistance Levels – Red Lines Indicates Support Levels
Light Blue is a Pivot Point – Black represents the price when the report was produced
CRUDEOIL Intraday: May Trend Reverse from 108.44
Our pivot point is at 108.44
Preferable Price Action: Below pivots sell oil with 103.71 & 99.67 as targets.
Alternative Price Action: Buy crude above pivot with targets at 113.22 and 116.72 in extension.
Comment: MACD is in the negative territory and Pair below 20MA.
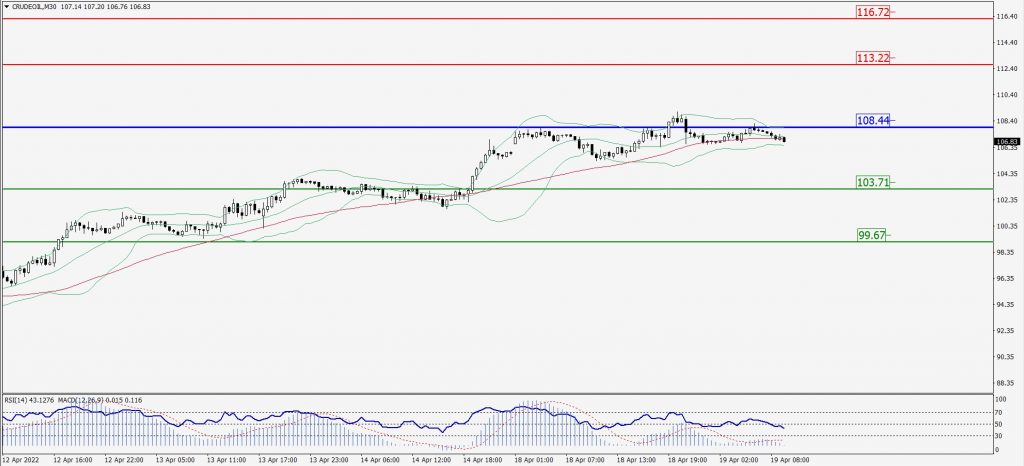
Green Lines Indicate Resistance Levels – Red Lines Indicates Support Levels
Light Blue is a Pivot Point – Black represents the price when the report was produced
XAU/USD Intraday: Trend on the Downside
Our pivot point is 1982.00
Preferable Price Action: Further downside to 1958.60 and 1940.90.
Alternative Price Action: If the price gives a downside breakout of a pivot, then the price extends to 2000.40 and 2018.00.
Comment: MACD is a negative territory and Pair below its 20MA & 55MA.
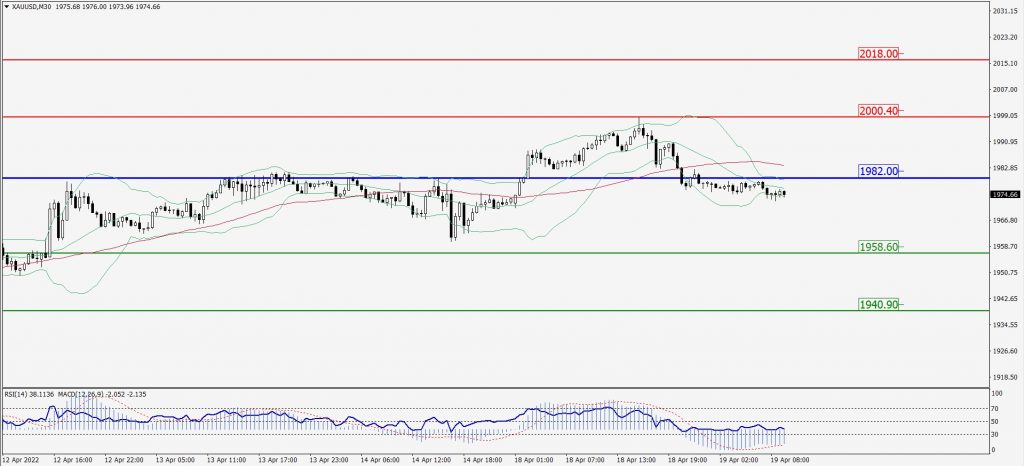
Green Lines Indicate Resistance Levels – Red Lines Indicates Support Levels
Light Blue is a Pivot Point – Black represents the price when the report was produced
Dow Jones Intraday: In a Consolidation Zone
Our pivot point is 34,474.00
Preferable Price Action: Take Buy positions above pivot with targets at 34,626.00 & 34,725.00.
Alternative Price Action: Above 34,474.00 looks for further downside to 34,347.00 & 34,239.00.
Comment: RSI above 50 levels and pair above its 20MA & 55MA.
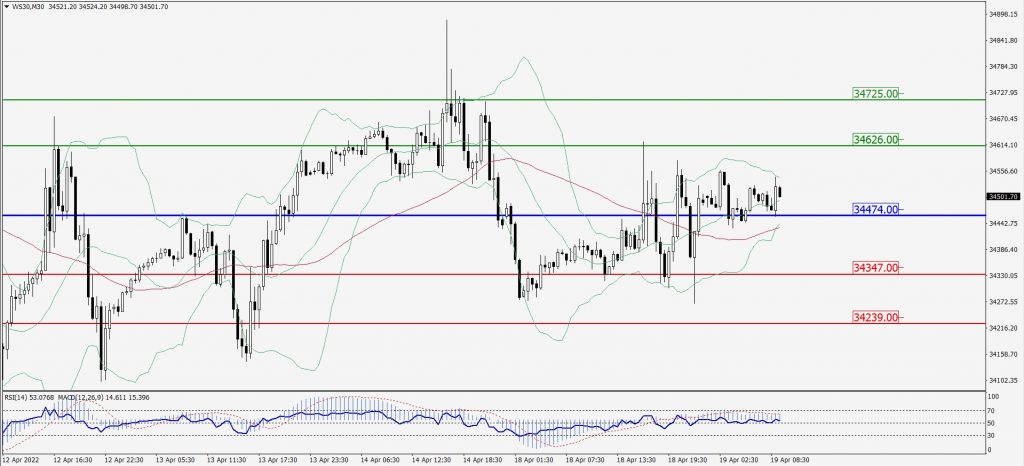
Green Lines Indicate Resistance Levels – Red Lines Indicates Support Levels
Light Blue is a Pivot Point – Black represents the price when the report was produced