Market Wrap: Stocks, Bonds, Commodities
Wall Street’s main indices fell on Tuesday, dragged by weakness in tech and other growth stocks after comments from Federal Reserve Governor Lael Brainard spooked investors about potential aggressive actions by the central bank to control inflation.
The S&P 500 lose(1.26%) ended at 4,525.12 points, while the Nasdaq Composite down 2.26% to 14,204.17. The Dow Jones Industrial was fell 0.80% to 34,641.18.
MSCI’s index of Asia-Pacific stocks outside Japan is drop 1.39% to 725.96 levels. Australian index lower 0.50% to 7,490.10. Japanese Nikkei Index sliped 1.58% to 27,350.98.
European stocks were Negative on wednesday, with the Stoxx Europe 50 Index lose 1.25% to 3,869.75 Germany’s DAX drop 1.14% to 14,260.51, and France’s CAC down 0.96% to 6,581.27, and U.K.’s FTSE 100 decrease 0.39% to 7,584.20.
Benchmark 10-year U.S. Treasury fell as demand for safe assets ascend again, today 10-year bond yields a positive 2.609.
Oil prices eased in volatile trade on Tuesday, pressured by a rising US dollar and growing worries that new coronavirus cases could slow demand but losses were limited by supply concerns due to sanctions on Russia for alleged war crimes.
Spot Brent crude oil gain 1.08% to $107.81 per barrel. US West Texas Intermediate crude up 1.07% to $103.00 a barrel.
The yellow metal gold is decline 0.28% to 1,922.00 dollars per ounce.
Market Wrap: Forex
The dollar edged up to its highest in nearly two years on Wednesday after jumping overnight on more hawkish comments from a Federal Reserve official, while the euro was hurt by the prospect of new Western sanctions on Russia.
Today, the U.S. dollar index measures the Greenback against a trade-weighted basket of six major currencies, which is an increase of 0.17% to 99.600.
The Euro US Dollar (EUR/USD) is a widely traded pair that is negative today. This left the pair trading around $1.0896.
The Japanese yen was positive against the U.S. dollar on Wednesday as the stock up. Today USD/JPY is rose 0.25% to 123.920 level.
Another commodity-related currency mixed against the U.S dollar, AUD/USD down 0.01% to 0.75780, and NZD/USD higher 0.14% to 0.69570 level.
EUR/USD Intraday: Trend on The Downside
Our pivot point is at 1.09310
Preferable Price Action: Take short positions below pivot level with targets at 1.08440 & 1.07730 in extension.
Alternative Price Action: Above pivot looks for a further upside to 1.10250 & 1.11050.
Comment: RSI below 50 levels and Pair below its 20MA & 55MA.
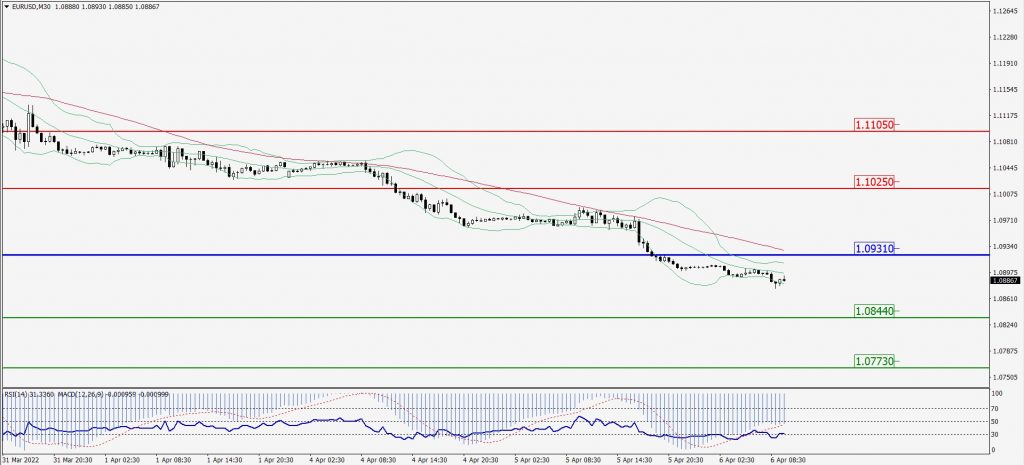
Green Lines Indicate Resistance Levels – Red Lines Indicates Support Levels
Light Blue is a Pivot Point – Black represents the price when the report was produced
GBP/USD Intraday: Trend on The Downside
Our pivot point is at 1.30890
Preferable Price Action: Sell positions below pivot with targets at 1.30300 & 1.29880 in extension.
Alternative Price Action: The price above pivot would call for further upside to 1.31420 & 1.31910.
Comment: RSI below 50 levels and Pair below its 20MA & 55MA.
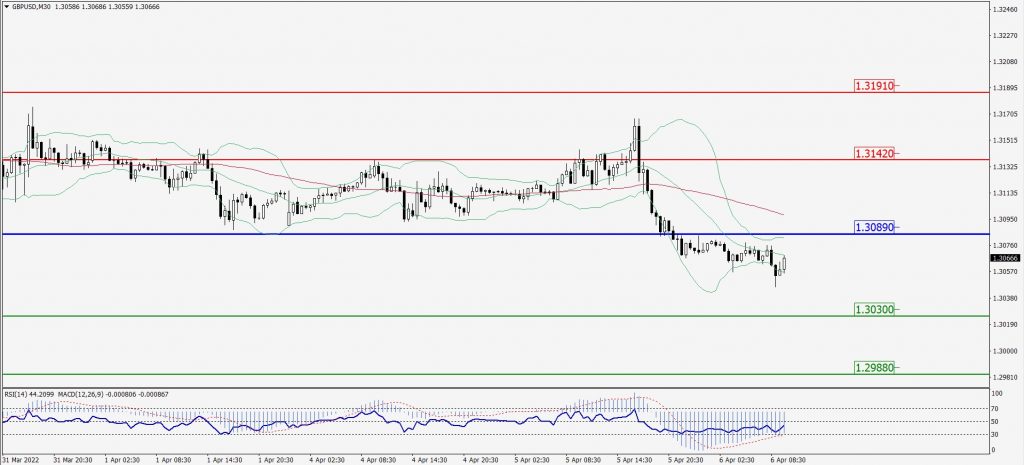
Green Lines Indicate Resistance Levels – Red Lines Indicates Support Levels
Light Blue is a Pivot Point – Black represents the price when the report was produced
USD/JPY Intraday: Major Trend on The Upside
Our pivot point is at 123.660
Preferable Price Action: Buy position above pivot with the target at 124.850 and 125.670 in extension.
Alternative Price Action: The downside breakout of the pivot would call for 122.670 and 121.880.
Comment: MACD in positive territory and Pair above its 20MA & 55MA.
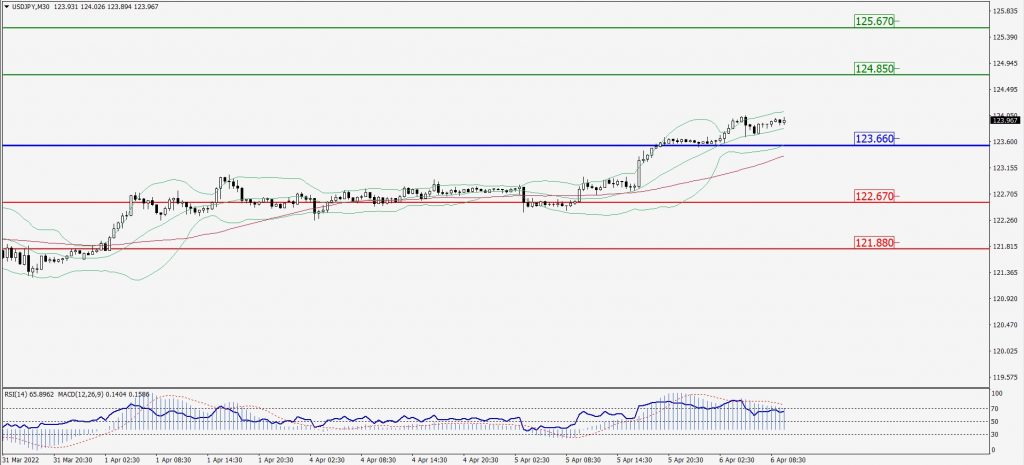
Green Lines Indicate Resistance Levels – Red Lines Indicates Support Levels
Light Blue is a Pivot Point – Black represents the price when the report was produced
AUD/USD Intraday: Trend on The Downside
Our pivot point is at 0.76160
Preferable Price Action: Sell Positions below pivot with targets at 0.75380 & 0.74770 in extension.
Alternative Price Action: Above pivot looks for a further upside with 0.76750 & 0.77300 as targets.
Comment: RSI below 50 levels and Pair below 55MA.
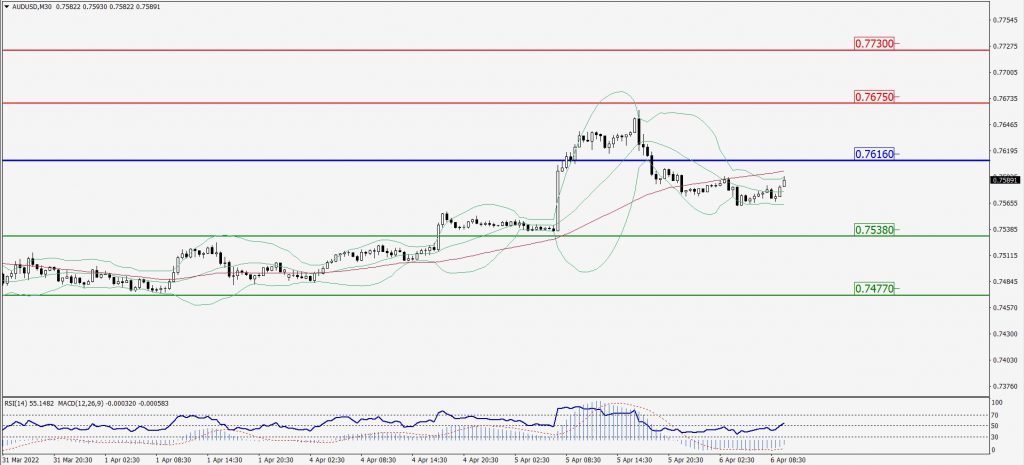
Green Lines Indicate Resistance Levels – Red Lines Indicates Support Levels
Light Blue is a Pivot Point – Black represents the price when the report was produced
CRUDEOIL Intraday: Trend on the Downside
Our pivot point is at 102.70
Preferable Price Action: Below pivots Sell oil with 99.09 & 96.80 as targets.
Alternative Price Action: Buy crude above pivot with targets at 105.81 and 108.08 in extension.
Comment: MACD is in the Negative territory and Pair below 55MA.
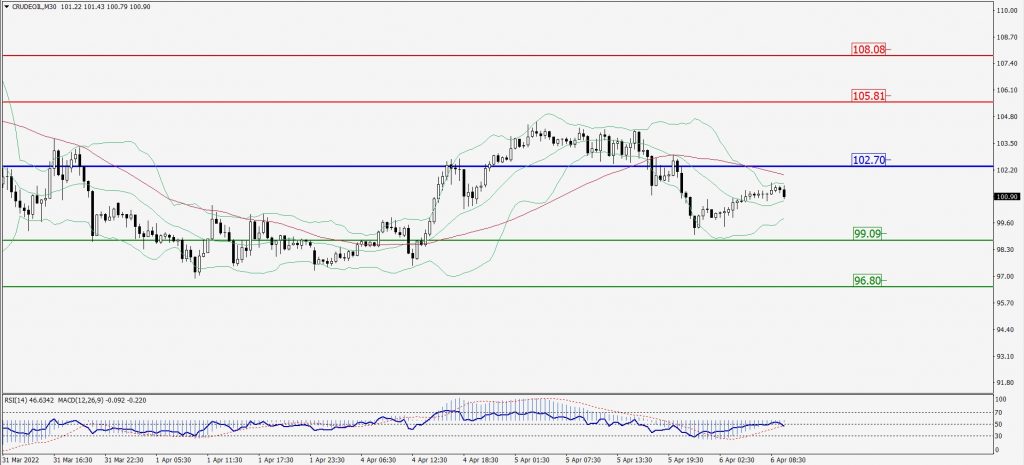
Green Lines Indicate Resistance Levels – Red Lines Indicates Support Levels
Light Blue is a Pivot Point – Black represents the price when the report was produced
XAU/USD Intraday: Major Support Level at 1924.10
Our pivot point is 1924.10
Preferable Price Action: Further downside to 1909.00 and 1897.00.
Alternative Price Action: If the price gives an upside breakout of a pivot, then the price extends to 1936.60 and 1948.00.
Comment: MACD is a negative territory and Pair below its 20MA & 55MA.
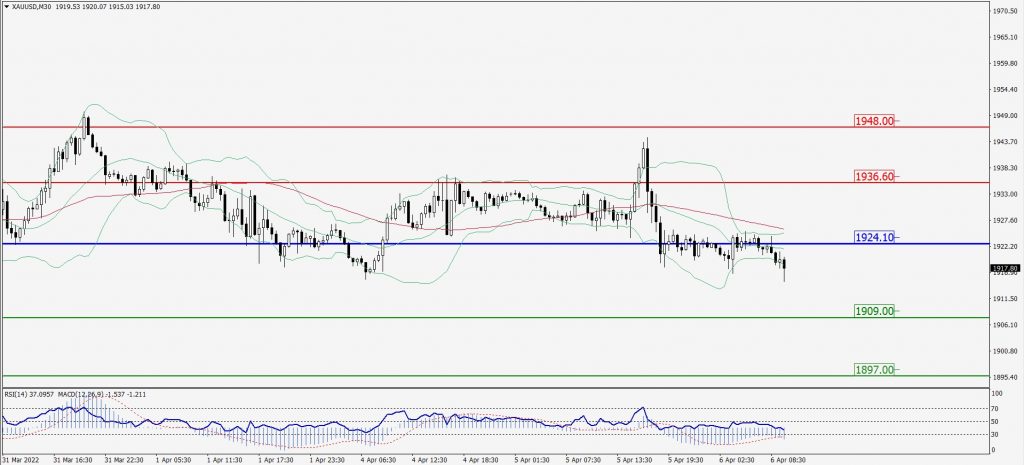
Green Lines Indicate Resistance Levels – Red Lines Indicates Support Levels
Light Blue is a Pivot Point – Black represents the price when the report was produced
Dow Jones Intraday: In a Consolidation Zone
Our pivot point is 34,806.00
Preferable Price Action: Take short positions below pivot with targets at 34,463.00 & 34,221.00.
Alternative Price Action: Above 34,806.00 looks for further upside to 35,103.00 & 35,339.00.
Comment: RSI Below 50 levels and pair below 55MA.
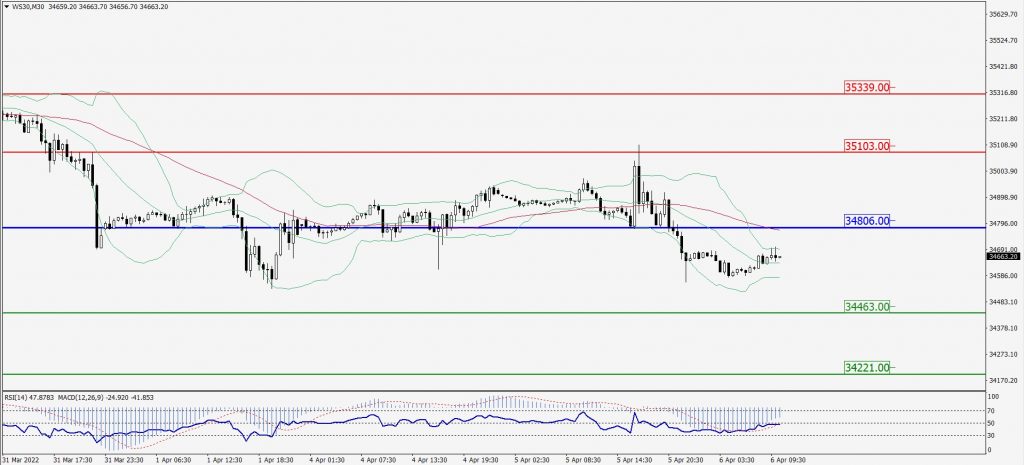
Green Lines Indicate Resistance Levels – Red Lines Indicates Support Levels
Light Blue is a Pivot Point – Black represents the price when the report was produced