Market Wrap: Stocks, Bonds, Commodities
Wall Street resumed its slide on Thursday, ending in the red as inflation hit a four-decade high, cementing expectations that the US Federal Reserve would hike key interest rates at the conclusion of next week’s monetary policy meeting to prevent the economy from overheating.
The S&P 500 lose (0.43%) ended at 4,259.52 points, while the Nasdaq Composite decline 0.95% to 13,129.96. The Dow Jones Industrial was down 0.34% to 33,174.07.
MSCI’s index of Asia-Pacific stocks outside Japan is fell 1.13% to 695.87 levels. Australian index lower 0.94% to 7,063.78. Japanese Nikkei Index decline 2.05% to 25,162.78.
European stocks were Positive on Thursday, with the Stoxx Europe 50 Index up 0.42% to 3,666.95 Germany’s DAX collect 0.55% to 13,515.82, and France’s CAC surged 0.38% to 6,230.50, and U.K.’s FTSE 100 gain 0.84% to 7,157.90.
Benchmark 10-year U.S. Treasury down as demand for safe assets lost again, today 10-year bond yields a negative 1.978.
Oil prices settled about 2% lower on Thursday after a volatile session, a day after its biggest daily dive in two years, as Russia pledged to fulfill contractual obligations and some traders said supply disruption concerns were overdone.
Spot Brent crude oil rose 2.33% to $111.89 per barrel. US West Texas Intermediate crude up 2.04% to $108.19 a barrel.
The yellow metal gold is descended 0.28% to 1,994.60 dollars per ounce.
Market Wrap: Forex
The dollar hit a new five-year top on the yen on Friday after a strong U.S. inflation report, while the euro struggled to hold its own as a hawkish turn from the European Central Bank was offset by growth risks emanating from the Ukraine crisis.
Today, the U.S. dollar index measures the Greenback against a trade-weighted basket of six major currencies, which is up 0.19% to 98.688.
The Euro US Dollar (EUR/USD) is a widely traded pair that is negative today. This left the pair trading around $1.09750.
The Japanese yen was positive against the U.S. dollar on Thursday as the stock up. Today USD/JPY is rose 0.57% to 116.780 level.
Another commodity-related currency negative against the U.S dollar, AUD/USD down 0.22% to 0.73410, and NZD/USD fell 0.20% to 0.68490 level.
EUR/USD Intraday: Trend on the Downside
Our pivot point is at 1.10620
Preferable Price Action: Take Short positions below pivot level with targets at 1.09710 & 1.08990 in extension.
Alternative Price Action: Above pivot looks for a further upside to 1.11550 & 1.12240.
Comment: RSI below 50 levels and Pair below 55MA.
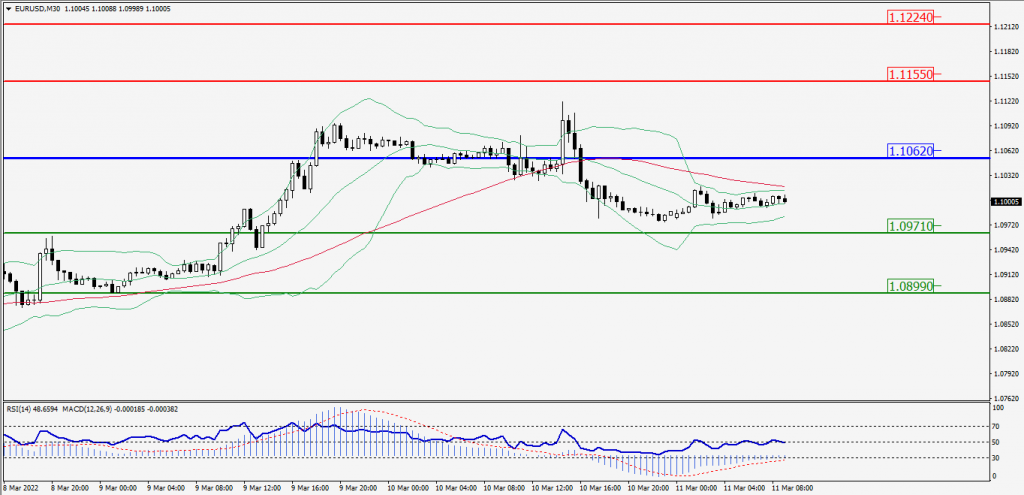
Green Lines Indicate Resistance Levels – Red Lines Indicates Support Levels
Light Blue is a Pivot Point – Black represents the price when the report was produced
GBP/USD Intraday: Trend on the Downside
Our pivot point is at 1.31220
Preferable Price Action: Sell positions below pivot with targets at 1.30750 & 1.30360 in extension.
Alternative Price Action: The price above pivot would call for further upside to 1.31680 & 1.32070.
Comment: RSI below 50 levels and Pair below 55MA.
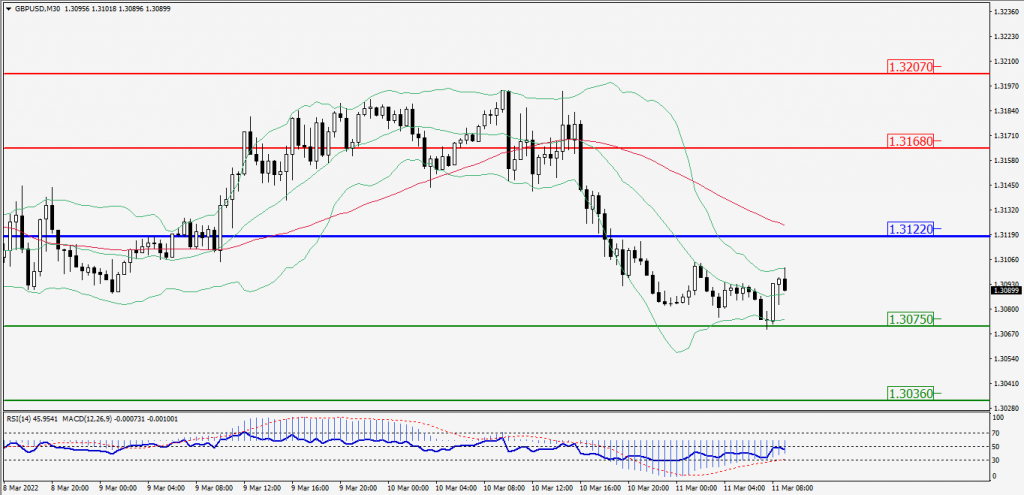
Green Lines Indicate Resistance Levels – Red Lines Indicates Support Levels
Light Blue is a Pivot Point – Black represents the price when the report was produced
USD/JPY Intraday: Trend on the Major Upside
Our pivot point is at 116.650
Preferable Price Action: Buy position Above pivot with the target at 116.970 and 117.290 in extension.
Alternative Price Action: The Downside breakout of the pivot would call for 116.320 and 115.980.
Comment: MACD in Positive territory and Pair Above its 20MA & 55MA.
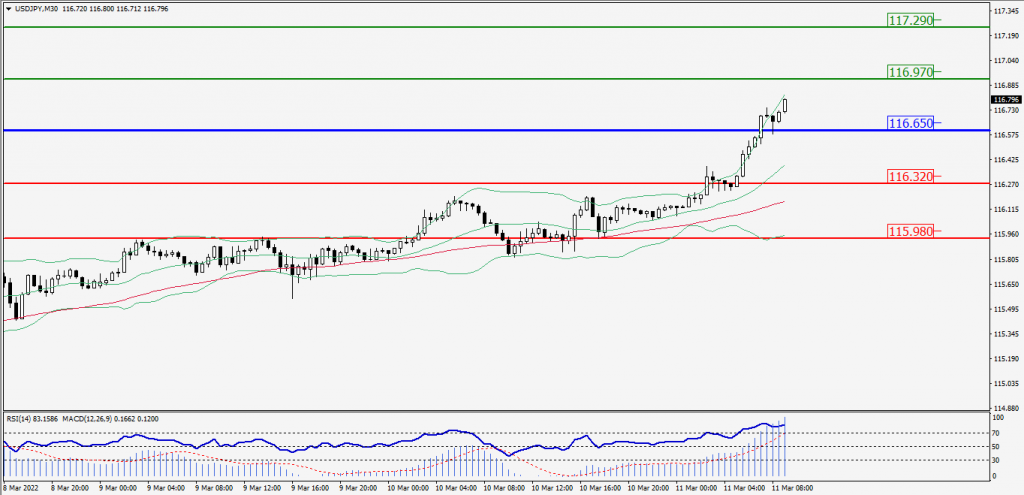
Green Lines Indicate Resistance Levels – Red Lines Indicates Support Levels
Light Blue is a Pivot Point – Black represents the price when the report was produced
AUD/USD Intraday: In a Consolidation Zone
Our pivot point is at 0.73240
Preferable Price Action: Buy Positions Above pivot with targets at 0.73660 & 0.74010 in extension.
Alternative Price Action: Below pivot looks for a further Downside with 0.72830 & 0.72470 as targets.
Comment: RSI at 50 levels.
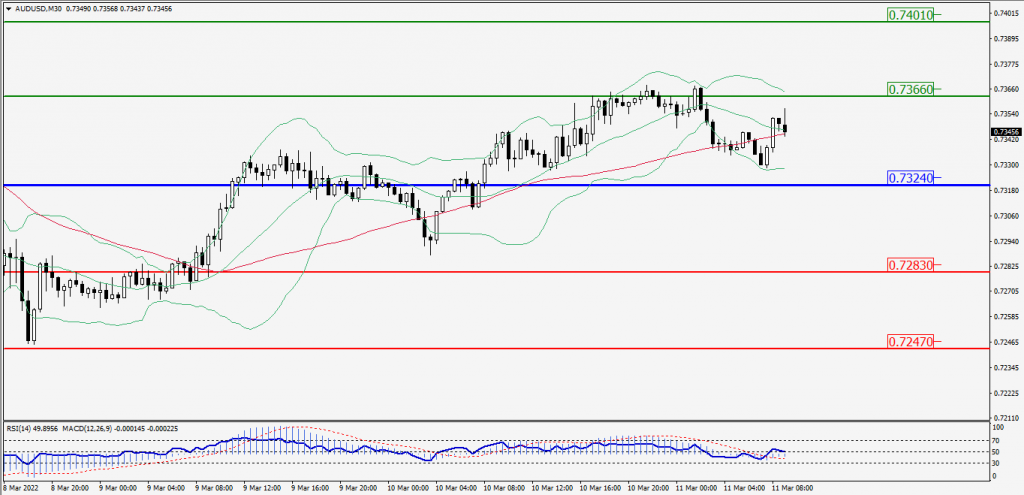
Green Lines Indicate Resistance Levels – Red Lines Indicates Support Levels
Light Blue is a Pivot Point – Black represents the price when the report was produced
CRUDEOIL Intraday: Trend on the Downside
Our pivot point is at 109.50
Preferable Price Action: Below pivots Sell Oil with 102.00 & 95.90 as targets.
Alternative Price Action: Buy crude above pivot with targets at 116.90 and 123.10 in extension.
Comment: MACD is in the natural territory and Pair Below 55MA.
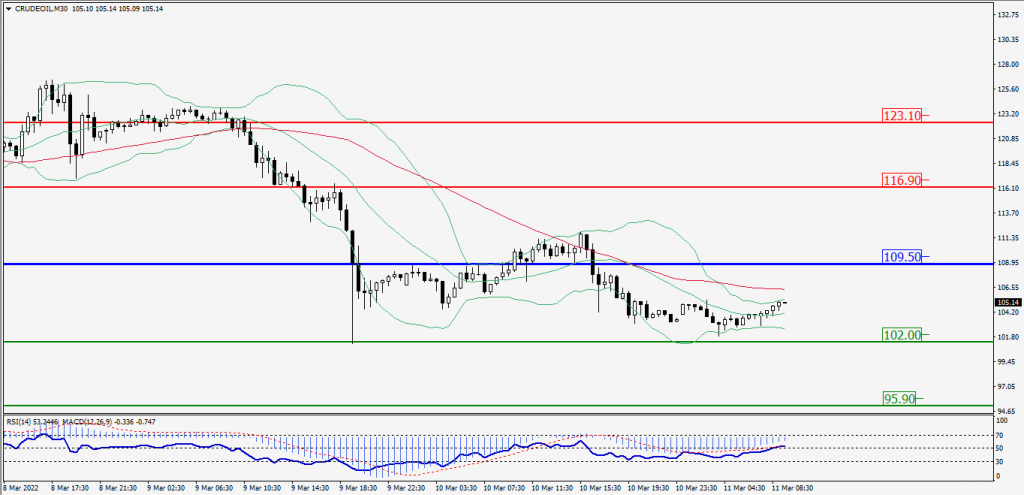
Green Lines Indicate Resistance Levels – Red Lines Indicates Support Levels
Light Blue is a Pivot Point – Black represents the price when the report was produced
XAU/USD Intraday: Resistance Level at 2000.60
Our pivot point is 2000.60
Preferable Price Action: Further Downside to 1978.10 and 1961.30.
Alternative Price Action: If the price gives an Upside breakout of a pivot, then the price extends to 2022.70 and 2039.50.
Comment: MACD is a negative territory and Pair Below its 20MA & 55MA.
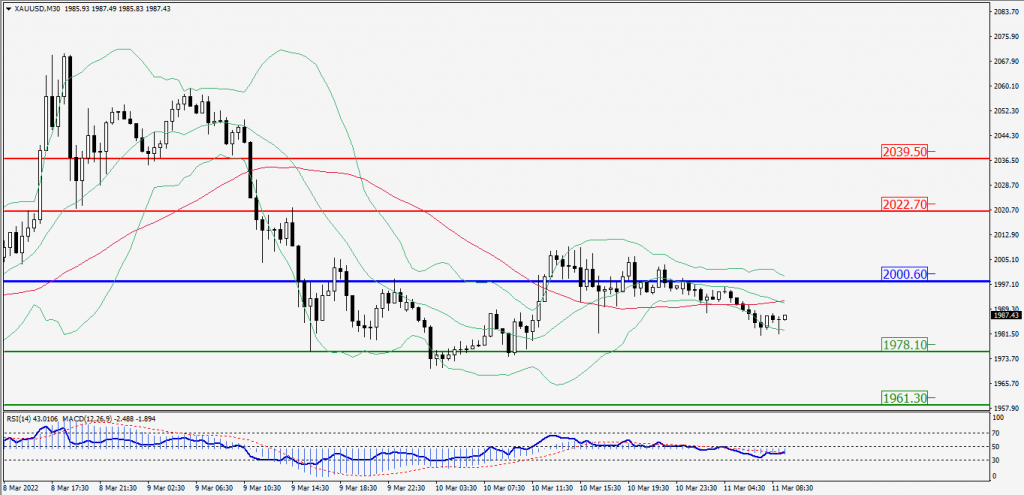
Green Lines Indicate Resistance Levels – Red Lines Indicates Support Levels
Light Blue is a Pivot Point – Black represents the price when the report was produced
Dow Jones Intraday: In a Consolidation Zone
Our pivot point is 33,027.00
Preferable Price Action: Take Long positions Above pivot with targets at 33,574.00 & 34,038.00.
Alternative Price Action: Below 33,027.00 looks for further downside to 32,474.00 & 32,005.00.
Comment: Price above its 20MA & 55MA and RSI above 50 levels.
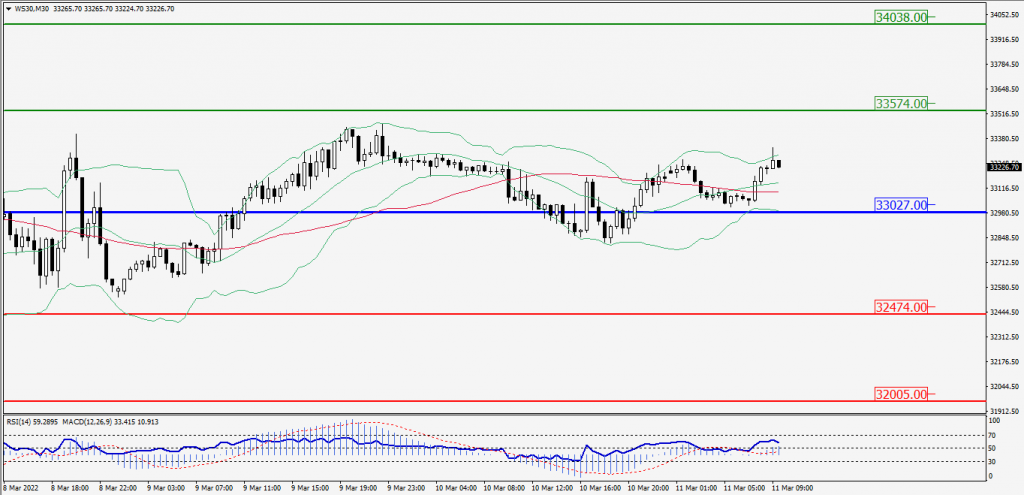
Green Lines Indicate Resistance Levels – Red Lines Indicates Support Levels
Light Blue is a Pivot Point – Black represents the price when the report was produced