Market Wrap: Stocks, Bonds, Commodities
US stocks surged on Wednesday, led by financial and tech shares, rebounding from several down days as oil prices pulled back sharply after fanning inflationary fears and investors gauged developments in the Ukraine crisis.
The S&P 500 Gain (2.57%) ended at 4,277.88 points, while the Nasdaq Composite Collected 3.59% to 13,255.55. The Dow Jones Industrial was up 2.00% to 33,286.25.
MSCI’s index of Asia-Pacific stocks outside Japan is rose 1.84% to 705.80 levels. Australian index lifted 1.10% to 7,130.80. Japanese Nikkei Index climbed 3.94% to 25,690.40.
European stocks were Positive on Thursday, with the Stoxx Europe 50 Index down 1.86% to 3,696.05 Germany’s DAX declined 1.84% to 13,593.81, and France’s CAC slipped 1.69% to 6,280.10, and U.K.’s FTSE 100 lower 0.88% to 7,127.50.
Benchmark 10-year U.S. Treasury down as demand for safe assets lost again, today 10-year bond yields a negative 1.934.
Global oil prices fell on Wednesday by the most in nearly two years after OPEC member United Arab Emirates said it supported pumping more oil into a market roiled by supply disruptions due to sanctions on Russia after it invaded Ukraine.
Spot Brent crude oil rose 3.54% to $115.07 per barrel. US West Texas Intermediate crude up 2.35% to $111.25 a barrel.
The yellow metal gold is descended 0.24% to 1,983.40 dollars per ounce.
Market Wrap: Forex
The U.S. dollar edged higher Thursday, while the euro handed back some of the previous session’s hefty gains ahead of high-level talks between Ukraine and Russia as well as the latest European Central Bank meeting.
Today, the U.S. dollar index measures the Greenback against a trade-weighted basket of six major currencies, which is up 0.08% to 98.032.
The Euro US Dollar (EUR/USD) is a widely traded pair that is negative today. This left the pair trading around $1.1065.
The Japanese yen was positive against the U.S. dollar on Thursday as the stock up. Today USD/JPY is rose 0.13% to 115.970 level.
Another commodity-related currency positive against the U.S dollar, AUD/USD collected 0.23% to 0.73390, and NZD/USD up 0.10% to 0.68450 level.
EUR/USD Intraday: Trend on the Upside
Our pivot point is at 1.10290
Preferable Price Action: Take Long positions Above pivot level with targets at 1.11130 & 1.11780 in extension.
Alternative Price Action: Below pivot looks for a further Downside to 1.09490 & 1.08850.
Comment: RSI above 50 levels and Pair above 55MA.
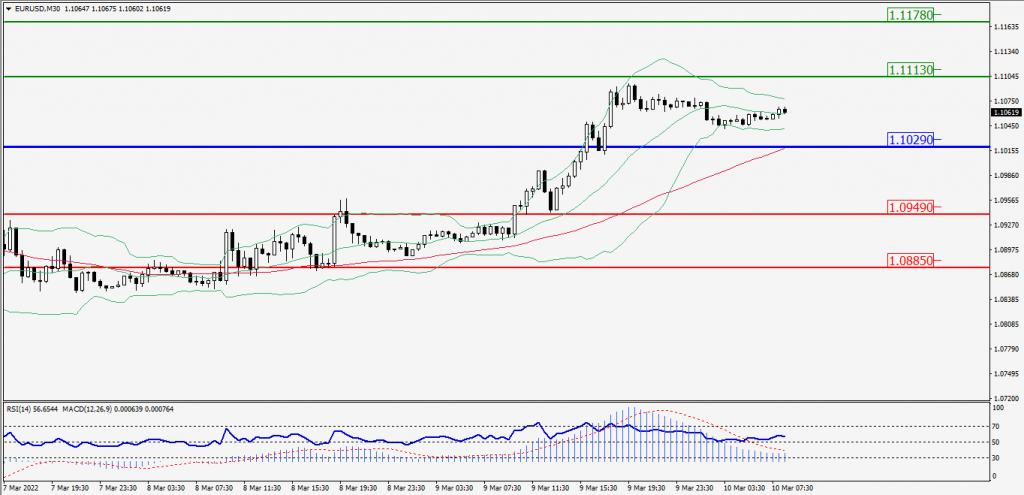
Green Lines Indicate Resistance Levels – Red Lines Indicates Support Levels
Light Blue is a Pivot Point – Black represents the price when the report was produced
GBP/USD Intraday: Support Level at 1.31640
Our pivot point is at 1.31640
Preferable Price Action: Buy positions Above pivot with targets at 1.32170 & 1.32620 in extension.
Alternative Price Action: The price Below pivot would call for further Downside to 1.31110 & 1.30670.
Comment: RSI Above 50 levels and Pair Above its 20MA & 55MA.
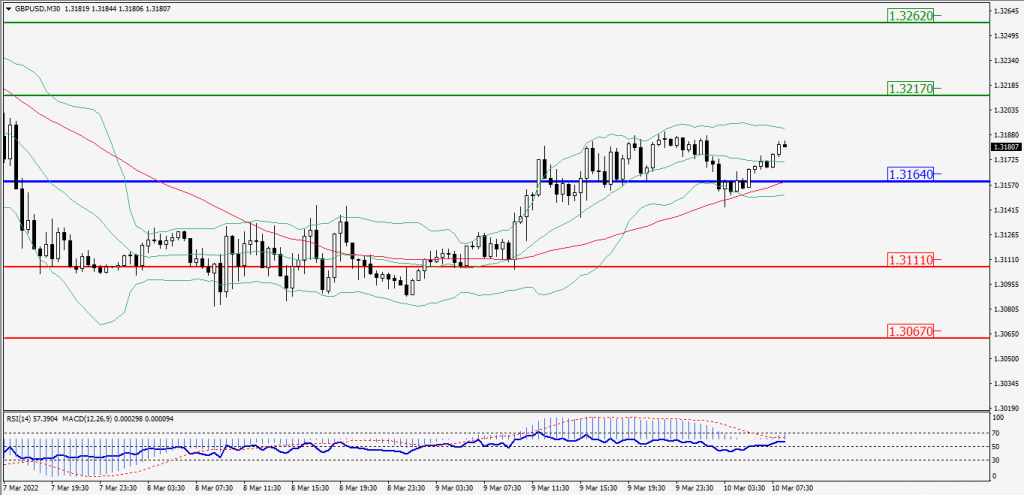
Green Lines Indicate Resistance Levels – Red Lines Indicates Support Levels
Light Blue is a Pivot Point – Black represents the price when the report was produced
USD/JPY Intraday: Trend on the Major Upside
Our pivot point is at 115.920
Preferable Price Action: Buy position Above pivot with the target at 116.270 and 116.540 in extension.
Alternative Price Action: The Downside breakout of the pivot would call for 115.570 and 115.290.
Comment: MACD in Positive territory and Pair Above its 20MA & 55MA.
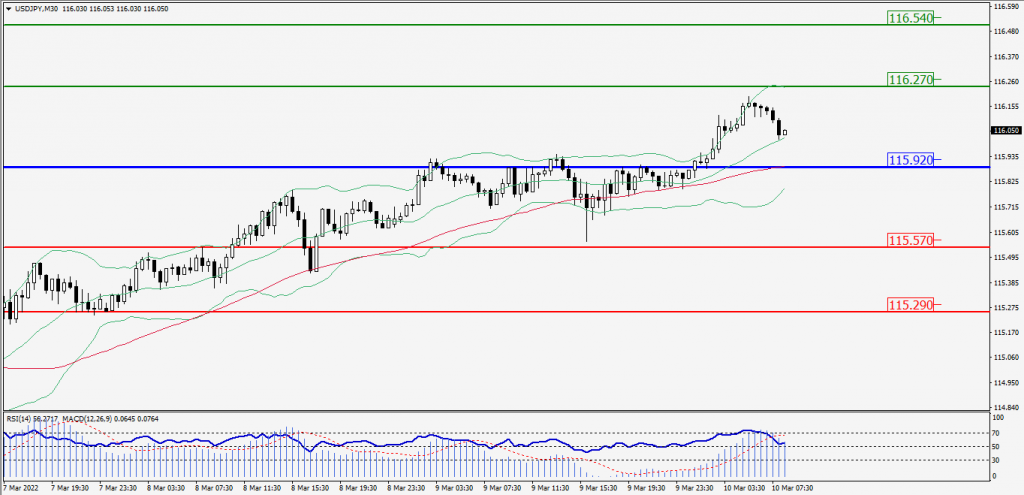
Green Lines Indicate Resistance Levels – Red Lines Indicates Support Levels
Light Blue is a Pivot Point – Black represents the price when the report was produced
AUD/USD Intraday: In a Consolidation Zone
Our pivot point is at 0.73190
Preferable Price Action: Buy Positions Above pivot with targets at 0.73660 & 0.74060 in extension.
Alternative Price Action: Below pivot looks for a further Downside with 0.72720 & 0.72310 as targets.
Comment: Pair above its 20MA & 55MA and RSI above 50 levels.
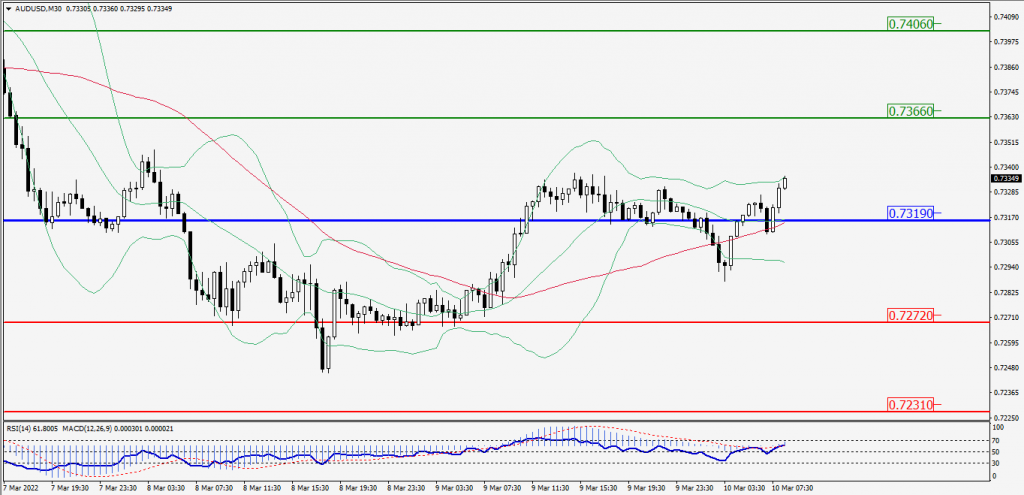
Green Lines Indicate Resistance Levels – Red Lines Indicates Support Levels
Light Blue is a Pivot Point – Black represents the price when the report was produced
CRUDEOIL Intraday: Trend on the Downside
Our pivot point is at 111.45
Preferable Price Action: Below pivots Sell Oil with 105.35 & 100.35 as targets.
Alternative Price Action: Buy crude above pivot with targets at 117.60 and 122.05 in extension.
Comment: MACD is in the Negative territory and Pair Below 55MA.
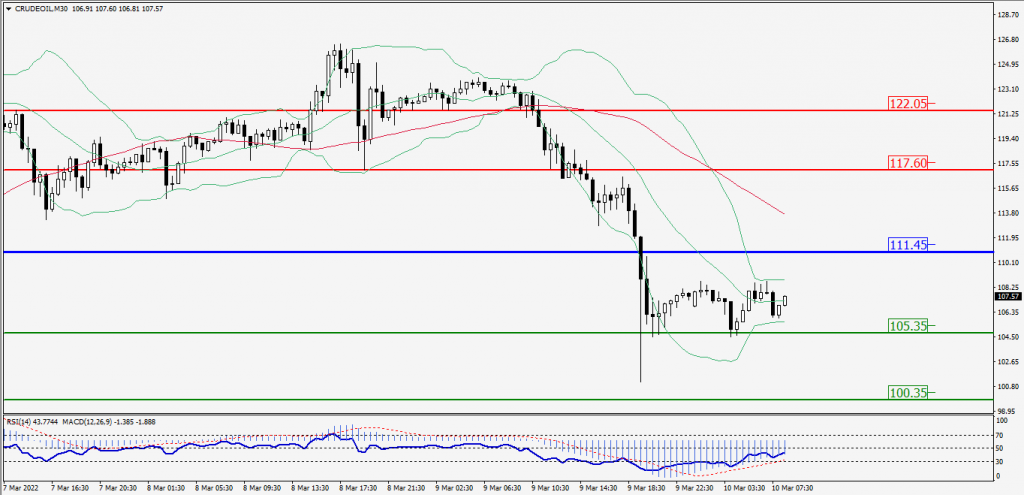
Green Lines Indicate Resistance Levels – Red Lines Indicates Support Levels
Light Blue is a Pivot Point – Black represents the price when the report was produced
XAU/USD Intraday: Resistance Level at 2006.40
Our pivot point is 2006.40
Preferable Price Action: Further Downside to 1969.50 and 1937.40.
Alternative Price Action: If the price gives an Upside breakout of a pivot, then the price extends to 2041.90 and 2074.60.
Comment: MACD is a negative territory and Pair Below 55MA.
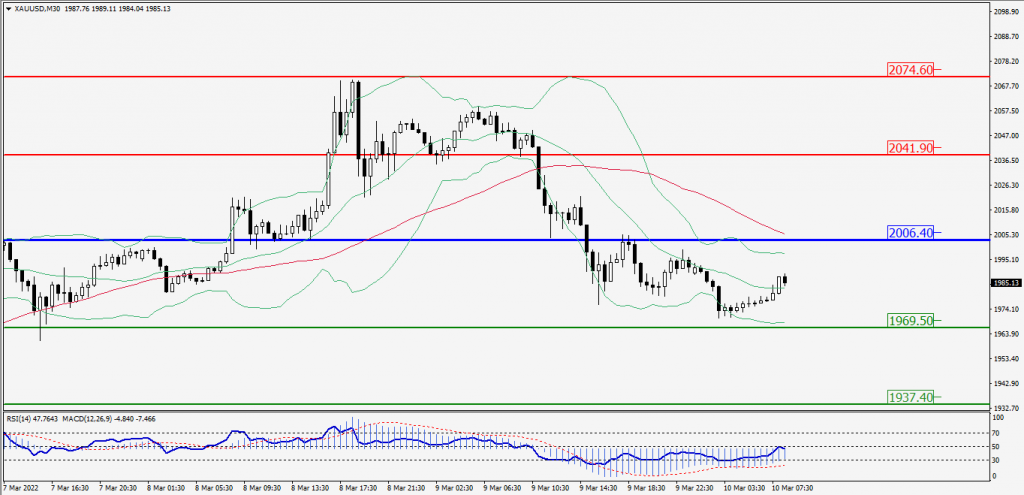
Green Lines Indicate Resistance Levels – Red Lines Indicates Support Levels
Light Blue is a Pivot Point – Black represents the price when the report was produced
Dow Jones Intraday: In a Consolidation Zone
Our pivot point is 33,006.00
Preferable Price Action: Take Long positions Above pivot with targets at 33,546.00 & 34,012.00.
Alternative Price Action: Below 33,006.00 looks for further downside to 32,467.00 & 32,000.00.
Comment: Price above 55MA and RSI negative 50 levels.
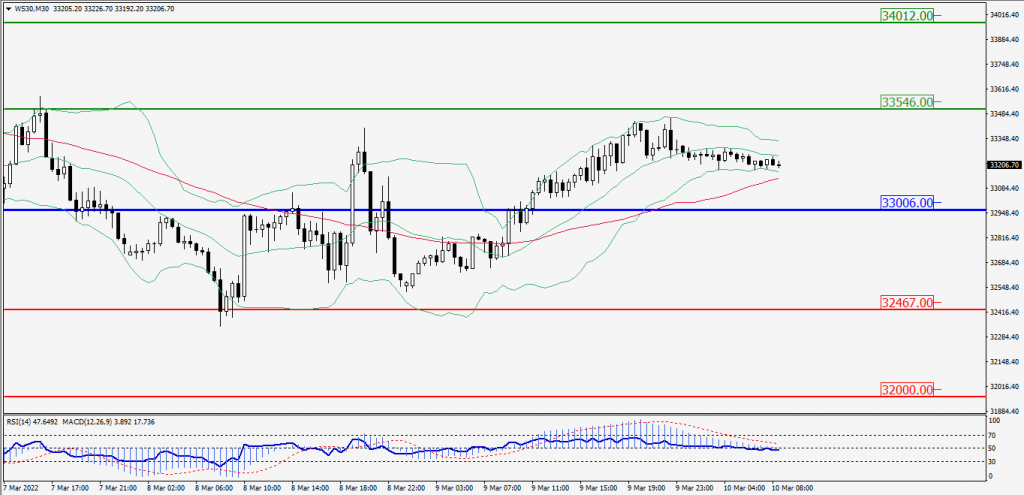
Green Lines Indicate Resistance Levels – Red Lines Indicates Support Levels
Light Blue is a Pivot Point – Black represents the price when the report was produced