Market Wrap: Stocks, Bonds, Commodities
Major US stock indices ended lower in rocky trading on Wednesday, as investors weighed fast-paced developments around the crisis in Ukraine as the United States banned Russian oil and other energy imports over the invasion.
The S&P 500 Lost (0.73%) ended at 4,170.62 points, while the Nasdaq Composite fell 0.28% to 12,795.55. The Dow Jones Industrial was down 0.56% to 32,632.64.
MSCI’s index of Asia-Pacific stocks outside Japan is rose 0.29% to 690.90 levels. Australian index lifted 1.04% to 7,053.00. Japanese Nikkei Index down 0.30% to 24,717.53.
European stocks were Positive on Wednesday, with the Stoxx Europe 50 Index up 3.57% to 3,630.95 Germany’s DAX collected 3.78% to 13,316.10, and France’s CAC pulled gain 3.63% to 6,179.70, and U.K.’s FTSE 100 climbed 2.12% to 7,111.90.
Benchmark 10-year U.S. Treasury down as demand for safe assets lost again, today 10-year bond yields a negative 1.870.
US President Joe Biden made the announcement on Tuesday, while Britain said it would phase out imports of Russian oil and oil products by the end of 2022.
Spot Brent crude oil rose 0.56% to $128.70 per barrel. US West Texas Intermediate crude up 0.49% to $124.31 a barrel.
The yellow metal gold is ascended to 0.46% to 2,052.85 dollars per ounce.
Market Wrap: Forex
The dollar was down on Wednesday morning in Asia, while the euro took a breather. Commodity currencies also fell from recent highs, as investors calculate that sky-high energy, grains, and metals prices could decrease demand in the long run.
Today, the U.S. dollar index measures the Redback against a trade-weighted basket of six major currencies, which is down 0.18% to 98.900.
The Euro US Dollar (EUR/USD) is a widely traded pair that is positive today. This left the pair trading around $1.0926.
The Japanese yen was positive against the U.S. dollar on Wednesday as the stock up. Today USD/JPY is rose 0.18% to 115.870 level.
Another commodity-related currency positive against the U.S dollar, AUD/USD collected 0.48% to 0.73010, and NZD/USD up 0.34% to 0.68270 level.
EUR/USD Intraday: In a Consolidation Zone
Our pivot point is at 1.08880
Preferable Price Action: Take Long positions Above pivot level with targets at 1.09650 & 1.10260 in extension.
Alternative Price Action: Below pivot looks for a further Downside to 1.08120 & 1.07490.
Comment: RSI above 50 levels and Pair above its 20MA & 55MA.
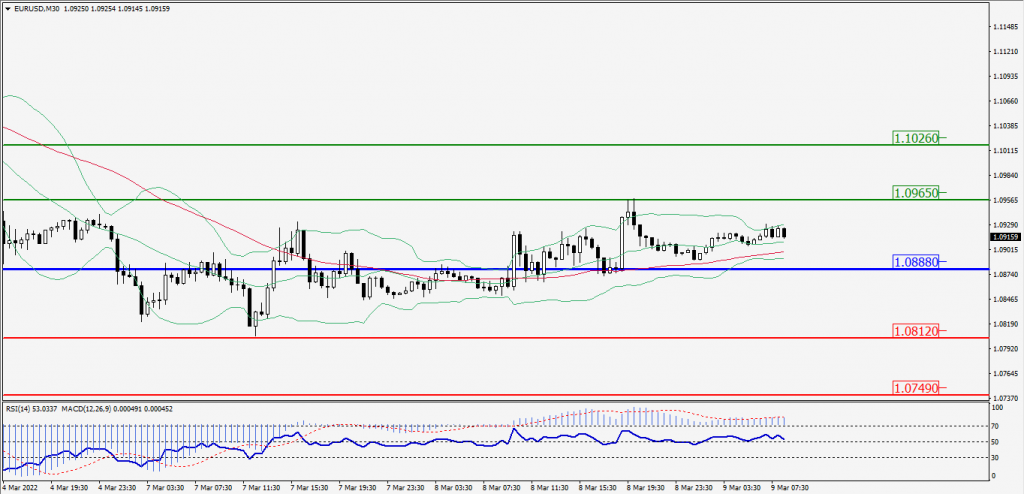
Green Lines Indicate Resistance Levels – Red Lines Indicates Support Levels
Light Blue is a Pivot Point – Black represents the price when the report was produced
GBP/USD Intraday: Trend on the Downside
Our pivot point is at 1.30860
Preferable Price Action: Buy positions Above pivot with targets at 1.31710 & 1.32380 in extension.
Alternative Price Action: The price Below pivot would call for further Downside to 1.29960 & 1.29280.
Comment: RSI Above 50 levels and Pair Above its 20MA & 55MA.
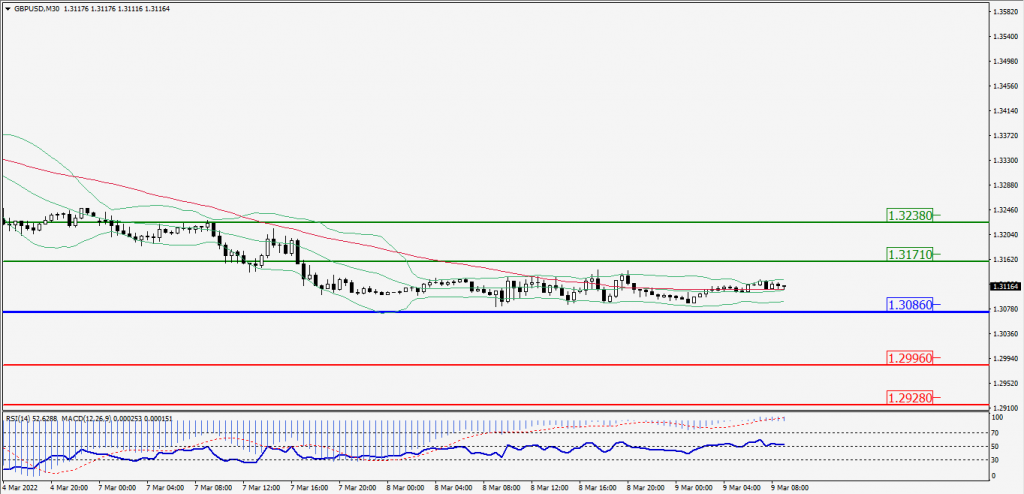
Green Lines Indicate Resistance Levels – Red Lines Indicates Support Levels
Light Blue is a Pivot Point – Black represents the price when the report was produced
USD/JPY Intraday: Support Level at 115.560
Our pivot point is at 115.560
Preferable Price Action: Buy position Above pivot with the target at 116.070 and 116.480 in extension.
Alternative Price Action: The Downside breakout of the pivot would call for 115.040 and 114.610.
Comment: MACD in Positive territory and Pair Above 55MA.
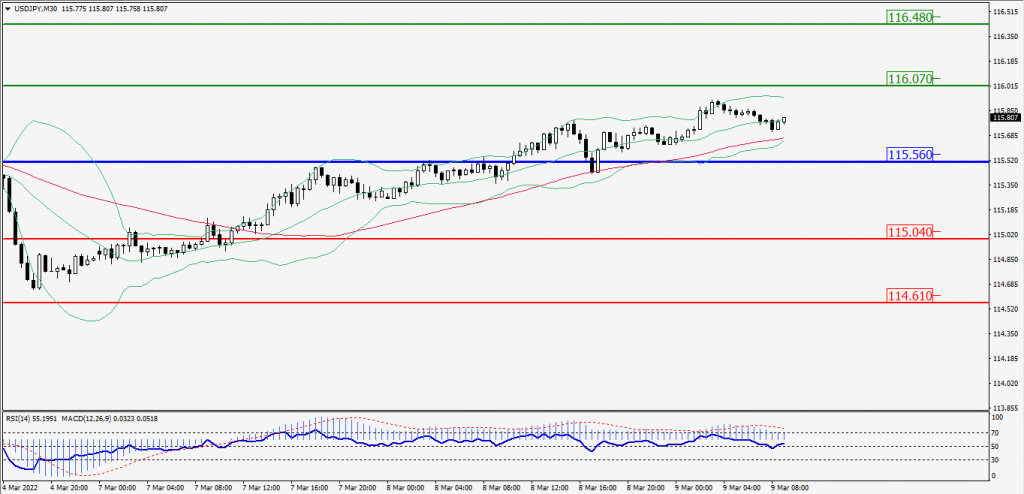
Green Lines Indicate Resistance Levels – Red Lines Indicates Support Levels
Light Blue is a Pivot Point – Black represents the price when the report was produced
AUD/USD Intraday: Trend on the Downside
Our pivot point is at 0.73320
Preferable Price Action: Sell Positions Below pivot with targets at 0.72590 & 0.72030 in extension.
Alternative Price Action: Above pivot looks for a further Upside with 0.74020 & 0.74610 as targets.
Comment: Pair above its 20MA & 55MA and RSI above 50 levels.
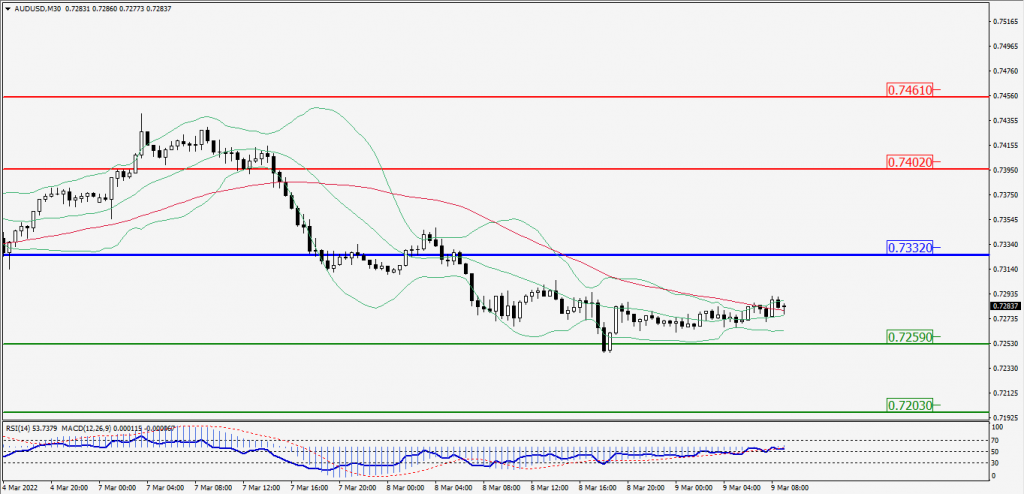
Green Lines Indicate Resistance Levels – Red Lines Indicates Support Levels
Light Blue is a Pivot Point – Black represents the price when the report was produced
CRUDEOIL Intraday: In a Consolidation Zone
Our pivot point is at 120.90
Preferable Price Action: Above pivots Buy Oil with 127.35 & 132.70 as targets.
Alternative Price Action: Sell crude Below pivot with targets at 114.10 and 108.70 in extension.
Comment: MACD is in the Neutral territory and Pair Above its 20MA & 55MA.
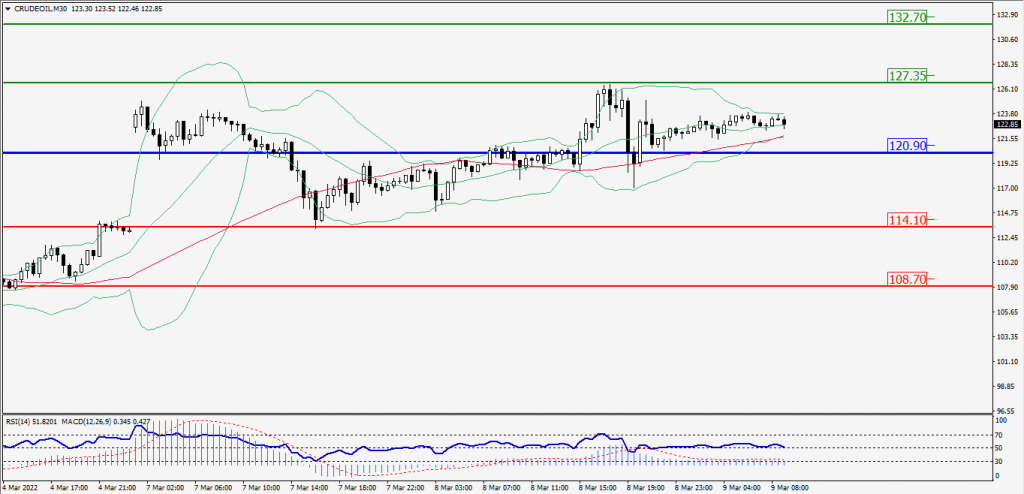
Green Lines Indicate Resistance Levels – Red Lines Indicates Support Levels
Light Blue is a Pivot Point – Black represents the price when the report was produced
XAU/USD Intraday: Support Level at 2034.10
Our pivot point is 2034.10
Preferable Price Action: Further Upside to 2068.50 and 2092.80.
Alternative Price Action: If the price gives a Downside breakout of a pivot, then the price extends to 2001.20 and 1975.80.
Comment: MACD is a Positive territory and Pair Above 55MA.
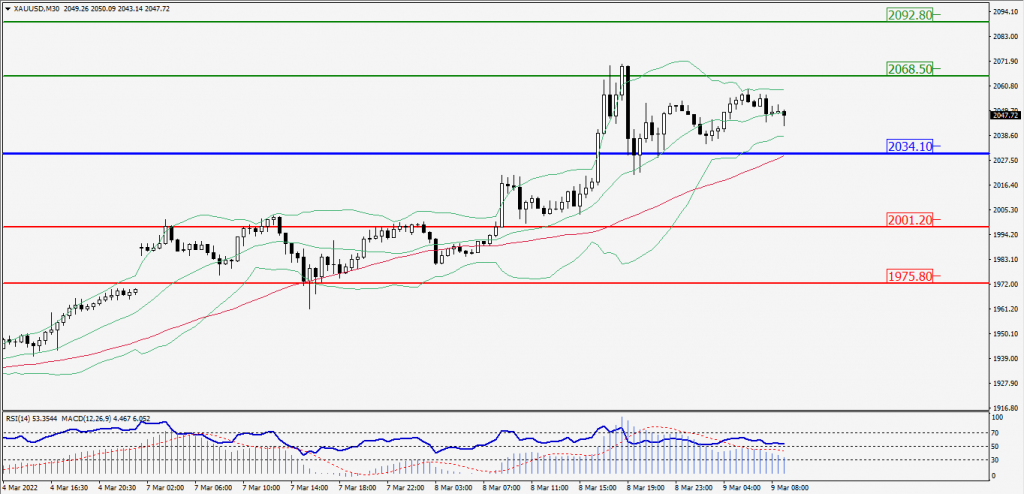
Green Lines Indicate Resistance Levels – Red Lines Indicates Support Levels
Light Blue is a Pivot Point – Black represents the price when the report was produced
Dow Jones Intraday: Trend on the Major Downside
Our pivot point is 33,269.00
Preferable Price Action: Take Short positions Below pivot with targets at 32,637.00 & 32,122.00.
Alternative Price Action: Above 33,269.00 looks for further upside to 33,932.00 & 34,407.00.
Comment: Price above 20MA and RSI Positive 50 levels.
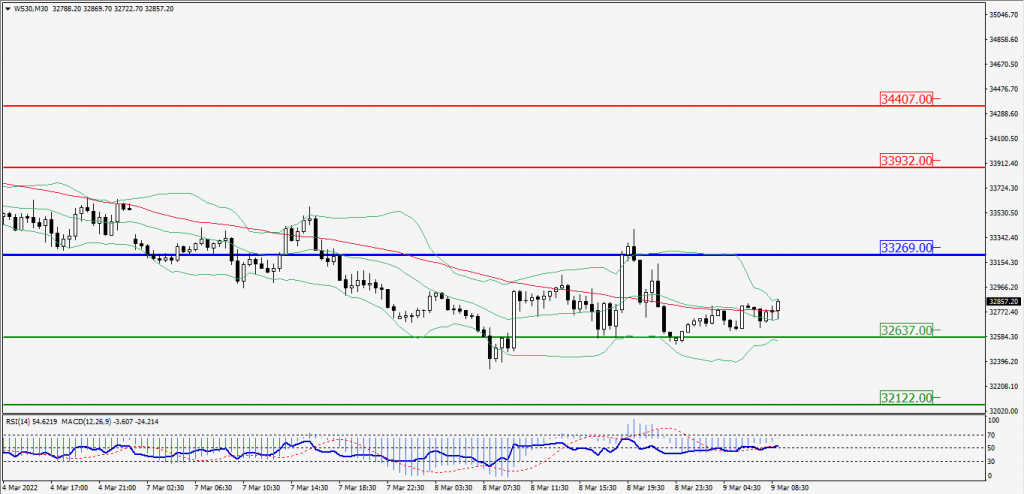
Green Lines Indicate Resistance Levels – Red Lines Indicates Support Levels
Light Blue is a Pivot Point – Black represents the price when the report was produced