Market Wrap: Stocks, Bonds, Commodities
Wall Street’s main indices fell sharply on Monday, with the Nasdaq Composite confirming it was in a bear market, as the prospect of a ban on oil imports from Russia sent crude prices soaring and fuelled concerns about rising inflation.
The S&P 500 Lost (2.95%) ended at 4,201.09 points, while the Nasdaq Composite fell 3.62% to 12,830.96. The Dow Jones Industrial was down 2.37% to 32,817.38.
MSCI’s index of Asia-Pacific stocks outside Japan is dropped 1.66% to 687.37 levels. Australian index lost 0.83% to 6,980.30. Japanese Nikkei Index down 1.71% to 24,790.95.
European stocks were Negative on Tuesday, with the Stoxx Europe 50 Index down 1.10% to 3,473.55 Germany’s DAX fell 1.57% to 12,633.24, and France’s CAC pulled down 1.14% to 5,914.36, and U.K.’s FTSE 100 dropped 0.53% to 6,922.52.
Benchmark 10-year U.S. Treasury rose as demand for safe assets gain again, today 10-year bond yields a positive 1.791.
Oil and other commodities prices soared while global shares tanked on Monday as the United States said it was willing to ban Russian oil imports, stoking investor fears over inflation and slowing economic growth.
Spot Brent crude oil rose 2.27% to $126.01 per barrel. US West Texas Intermediate crude up 1.85% to $121.61 a barrel.
The yellow metal gold is ascended to 1.42% to 2,024.20 dollars per ounce.
Market Wrap: Forex
The U.S. dollar edged lower Tuesday while the euro traded marginally above the previous session’s 22-month low as the war in Ukraine threatens the European growth outlook.
Today, the U.S. dollar index measures the Grayback against a trade-weighted basket of six major currencies, which is flat today to 99.280.
The Euro US Dollar (EUR/USD) is a widely traded pair that is positive today. This left the pair trading around $1.08590.
The Japanese yen was positive against the U.S. dollar on Tuesday as the stock up. Today USD/JPY is rose 0.15% to 115.470 level.
Another commodity-related currency negative against the U.S dollar, AUD/USD lost 0.59% to 0.72730, and NZD/USD fell 0.25% to 0.68130 level.
EUR/USD Intraday: Trend on the Downside
Our pivot point is at 1.09320
Preferable Price Action: Take Short positions Below pivot level with targets at 1.08180 & 1.07230 in extension.
Alternative Price Action: Above pivot looks for a further Upside to 1.10440 & 1.11370.
Comment: RSI below 50 levels and Pair Below 55MA.
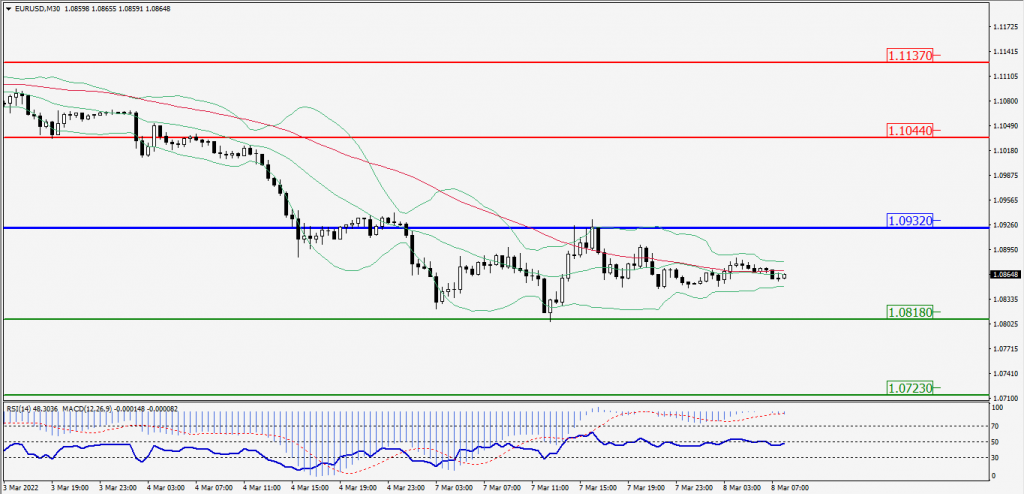
Green Lines Indicate Resistance Levels – Red Lines Indicates Support Levels
Light Blue is a Pivot Point – Black represents the price when the report was produced
GBP/USD Intraday: Trend on the Downside
Our pivot point is at 1.31530
Preferable Price Action: Sell positions Below pivot with targets at 1.30950 & 1.30500 in extension.
Alternative Price Action: The price Above pivot would call for further Upside to 1.32090 & 1.32570.
Comment: RSI Below 50 levels and Pair Below 55MA.
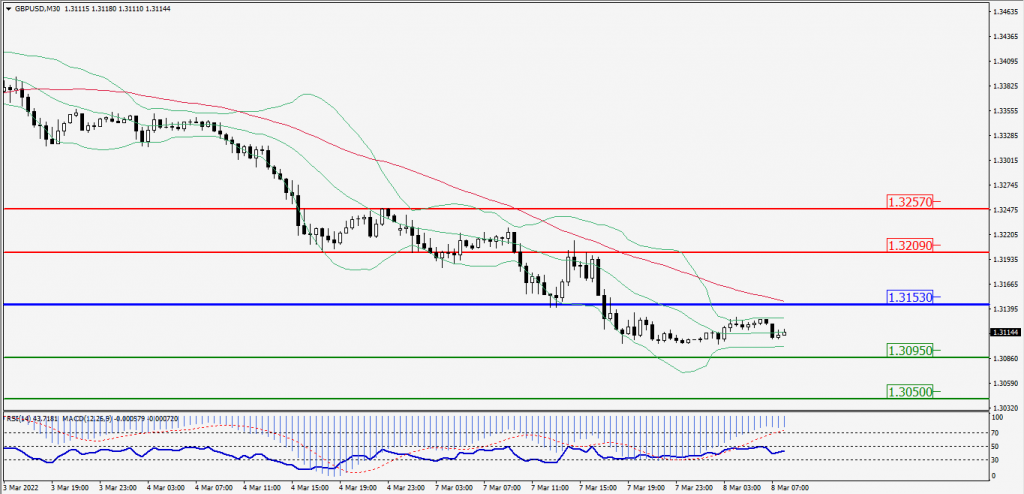
Green Lines Indicate Resistance Levels – Red Lines Indicates Support Levels
Light Blue is a Pivot Point – Black represents the price when the report was produced
USD/JPY Intraday: In a Consolidation Zone
Our pivot point is at 115.400
Preferable Price Action: Buy position Above pivot with the target at 115.740 and 115.990 in extension.
Alternative Price Action: The Downside breakout of the pivot would call for 115.060 and 114.790.
Comment: MACD in Positive territory and Pair Above its 20MA & 55MA.
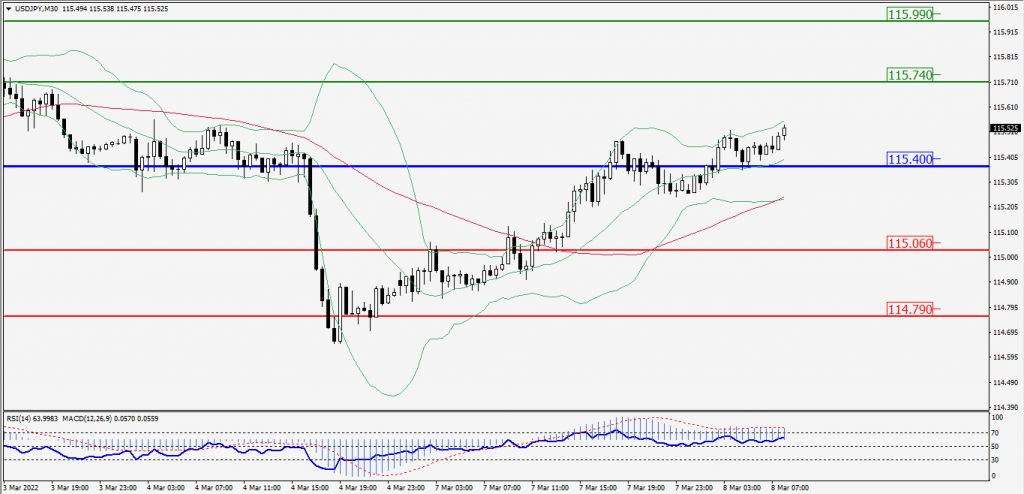
Green Lines Indicate Resistance Levels – Red Lines Indicates Support Levels
Light Blue is a Pivot Point – Black represents the price when the report was produced
AUD/USD Intraday: Trend on the Downside
Our pivot point is at 0.73100
Preferable Price Action: Sell Positions Below pivot with targets at 0.72660 & 0.72320 in extension.
Alternative Price Action: Above pivot looks for a further Upside with 0.73510 & 0.73850 as targets.
Comment: Pair Below its 20MA & 55MA and RSI below 50 levels.
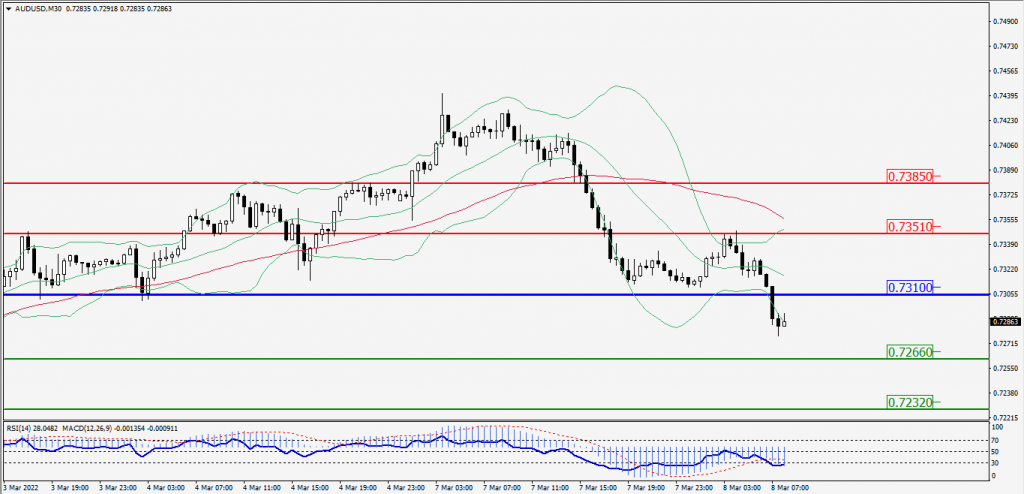
Green Lines Indicate Resistance Levels – Red Lines Indicates Support Levels
Light Blue is a Pivot Point – Black represents the price when the report was produced
CRUDEOIL Intraday: In a Consolidation Zone
Our pivot point is at 118.10
Preferable Price Action: Above pivots Buy Oil with 124.85 & 130.40 as targets.
Alternative Price Action: Sell crude Below pivot with targets at 111.30 and 105.65 in extension.
Comment: MACD is in the Positive territory and Pair Above its 20MA & 55MA.
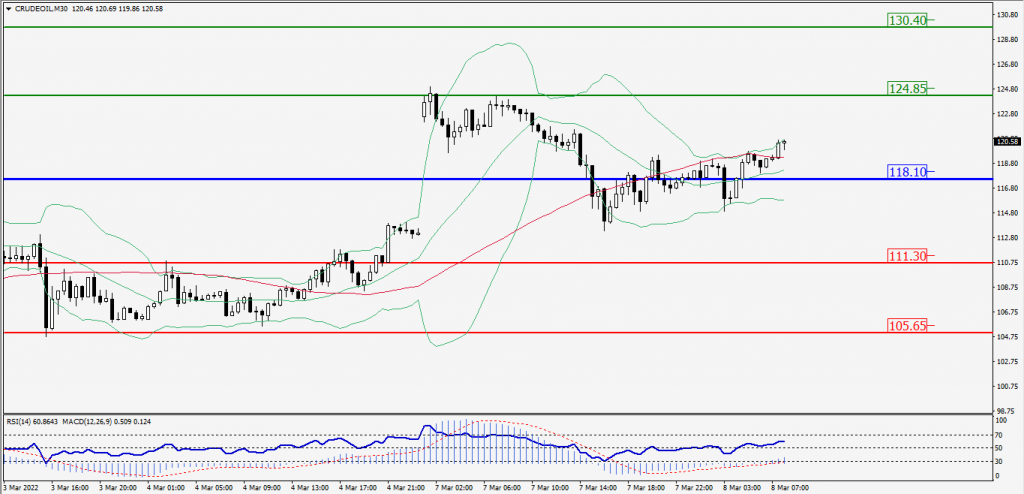
Green Lines Indicate Resistance Levels – Red Lines Indicates Support Levels
Light Blue is a Pivot Point – Black represents the price when the report was produced
XAU/USD Intraday: Support Level at 1985.20
Our pivot point is 1985.20
Preferable Price Action: Further Upside to 2014.20 and 2038.20.
Alternative Price Action: If the price gives a Downside breakout of a pivot, then the price extends to 1956.40 and 1931.40.
Comment: MACD is a Positive territory and Pair Above its 20MA & 55MA.
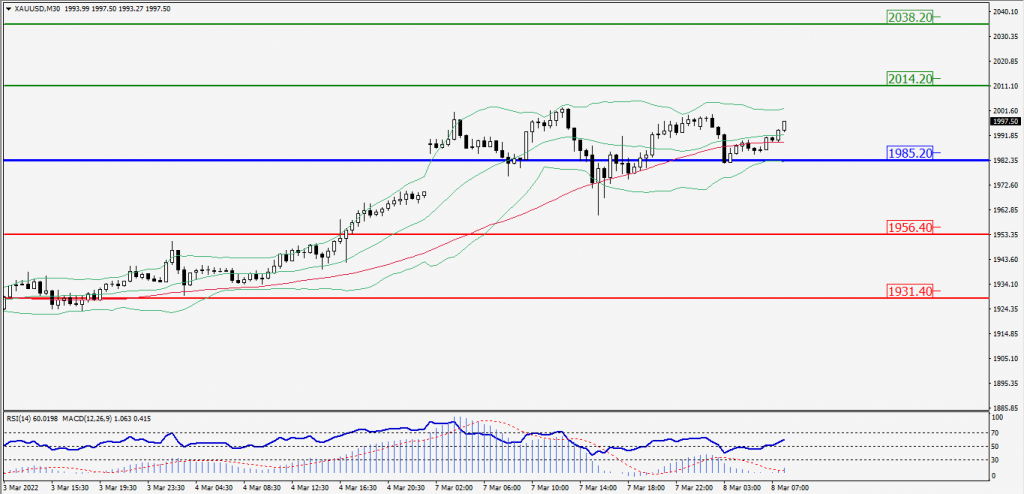
Green Lines Indicate Resistance Levels – Red Lines Indicates Support Levels
Light Blue is a Pivot Point – Black represents the price when the report was produced
Dow Jones Intraday: Trend on the Major Downside
Our pivot point is 33,111.00
Preferable Price Action: Take Short positions Below pivot with targets at 32,091.00 & 31,272.00.
Alternative Price Action: Above 33,111.00 looks for further upside to 34,102.00 & 34,941.00.
Comment: Price Below its 20MA & 55MA and RSI negative 50 levels.
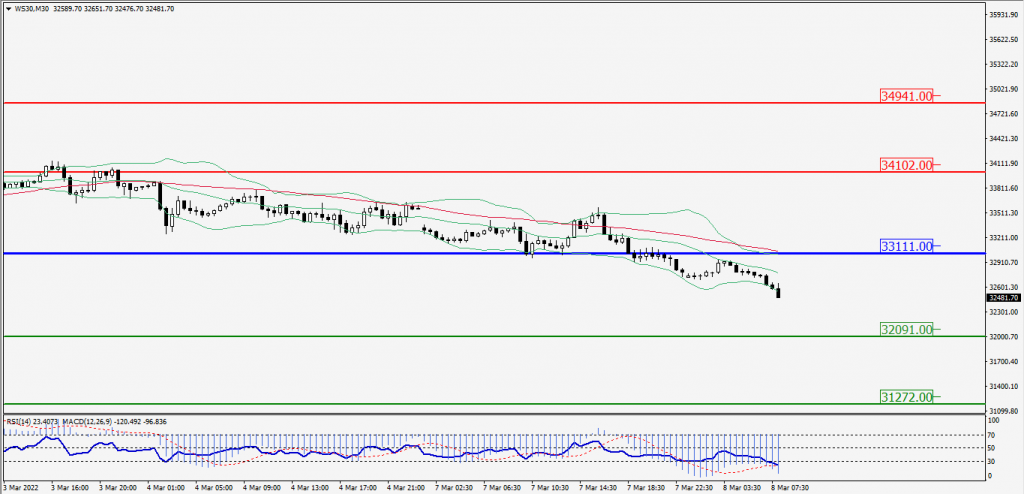
Green Lines Indicate Resistance Levels – Red Lines Indicates Support Levels
Light Blue is a Pivot Point – Black represents the price when the report was produced