Market Wrap: Stocks, Bonds, Commodities
Global shares dropped on Monday on rising worries over escalating Ukraine-Russia tensions and the prospect of a tightened interest rate hike timeline from the US Federal Reserve in response to decades-high inflation.
The S&P 500 Lost (1.90%) ended at 4,418.64 points, while the Nasdaq Composite down 2.78% to 13,791.15. The Dow Jones Industrial was fell 1.43% to 34,738.06.
MSCI’s index of Asia-Pacific stocks outside Japan is Down 1.69%, to 773.60 levels. Australian index down 0.98% to 7,217.30. Japanese Nikkei Index fell 2.23% to 27,079.59.1
European stocks were Negative on Monday, with the Stoxx Europe 50 Index fell 3.48% to 4,011.85 Germany’s DAX fell 3.61% to 14,861.50, and France’s CAC pulled lower 3.38% to 6,775.60, and U.K.’s FTSE 100 down 1.97% to 7,514.57.
Benchmark 10-year U.S. Treasury ascend as demand for safe assets gain again, today 10-year bond yields negative 1.42% to 1.923.
Oil prices were steady on Monday after hitting their highest in more than seven years on fears that a possible invasion of Ukraine by Russia could trigger U.S. and European sanctions that would disrupt exports from one of the world’s top oil producers.
Spot Brent crude oil fell 0.13% to $94.31 per barrel. US West Texas Intermediate crude flat $92.09 a barrel.
The yellow metal gold gain 0.80% to 1,856.80 dollars per ounce.
Market Wrap: Forex
The U.S. dollar has largely held on to last week’s gains with traders fretting over the potential of a war in Eastern Europe as well as high inflation and potentially aggressive Federal Reserve interest rate hikes.
Today, the U.S. dollar index measures the redback against a trade-weighted basket of six major currencies, which is gain 0.20% today 96.260.
The Euro US Dollar (EUR/USD) is a widely traded pair that is negative today. This left the pair trading around $1.13150.
The Japanese yen was Weak against the U.S. dollar on Monday as the stock up. Today USD/JPY is lost 0.22% at the 115.160 level.
Another commodity-related currency Negative against the U.S dollar, AUD/USD lost 0.53% to 0.71000, and NZD/USD fell 0.66% to 0.66030 level.
EUR/USD Intraday: Trend on the Downside
Our pivot point is at 1.13710
Preferable Price Action: Take Short positions Below pivot level with targets at 1.13150 & 1.12690 in extension.
Alternative Price Action: Above pivot looks for a further Upside to 1.14270 & 1.14740.
Comment: Pair Below its 20MA & 55MA and RSI below 50 levels.
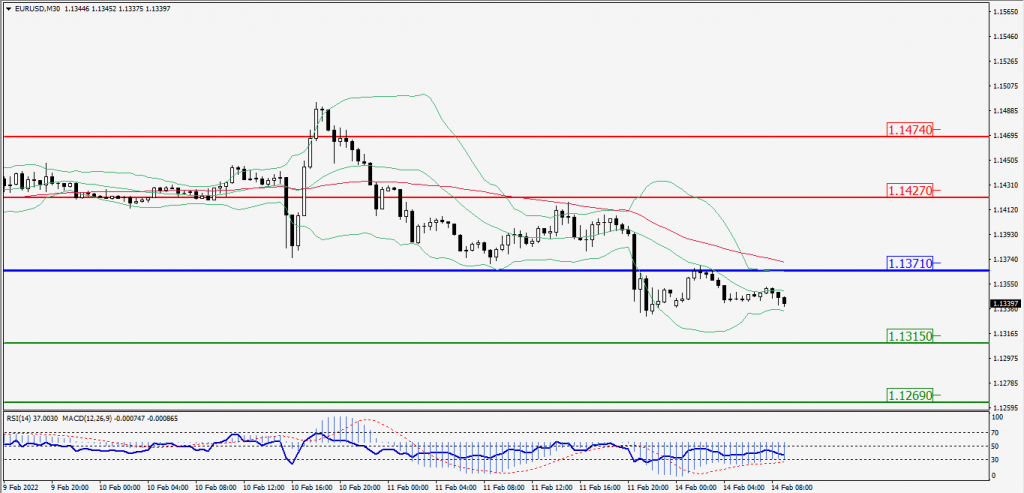
Green Lines Indicate Resistance Levels – Red Lines Indicates Support Levels
Light Blue is a Pivot Point – Black represents the price when the report was produced
GBP/USD Intraday: In a Consolidation Zone
Our pivot point is at 1.35670
Preferable Price Action: Sell positions Below pivot with targets at 1.35170 & 1.34740 in extension.
Alternative Price Action: The price Above pivot would call for further Upside to 1.36170 & 1.36580.
Comment: RSI below 50 levels and Pair below its 20MA & 55MA.
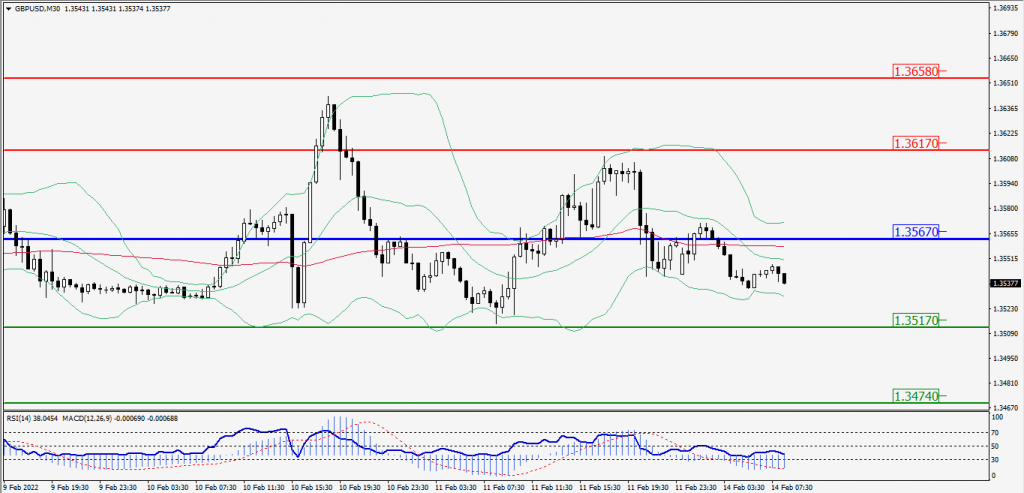
Green Lines Indicate Resistance Levels – Red Lines Indicates Support Levels
Light Blue is a Pivot Point – Black represents the price when the report was produced
USD/JPY Intraday: Trend on the Downside
Our pivot point is at 115.510
Preferable Price Action: Sell position Below pivot with the target at 115.280 and 115.080 in extension.
Alternative Price Action: The Upside breakout of the pivot would call for 115.720 and 115.910.
Comment: MACD in Negative territory and Pair Below its 20MA & 55MA.
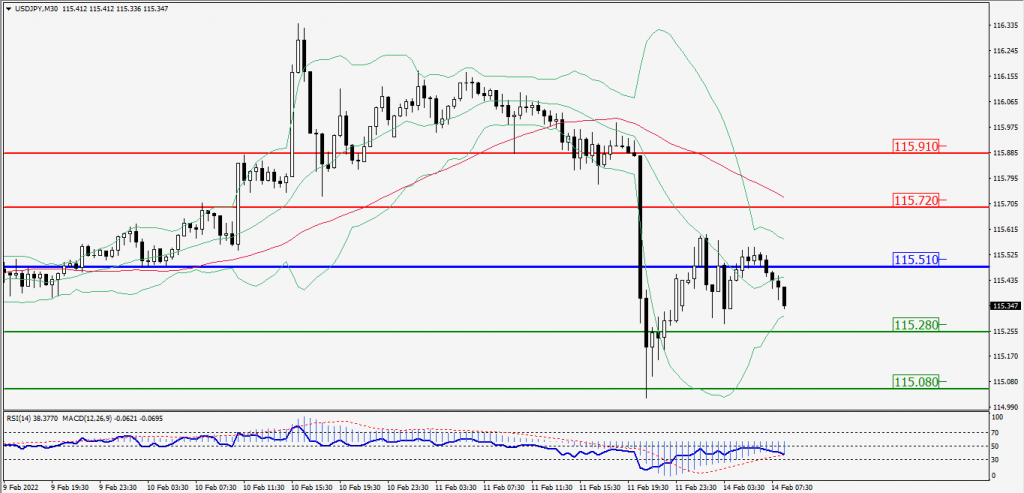
Green Lines Indicate Resistance Levels – Red Lines Indicates Support Levels
Light Blue is a Pivot Point – Black represents the price when the report was produced
AUD/USD Intraday: Resistance Level at 0.71530
Our pivot point is at 0.71530
Preferable Price Action: Sell Positions Below pivot with targets at 0.71010 & 0.70570 in extension.
Alternative Price Action: Above pivot looks for a further Upside with 0.72040 & 0.72480 as targets.
Comment: Pair Below its 20MA & 55MA and RSI below 50 levels.
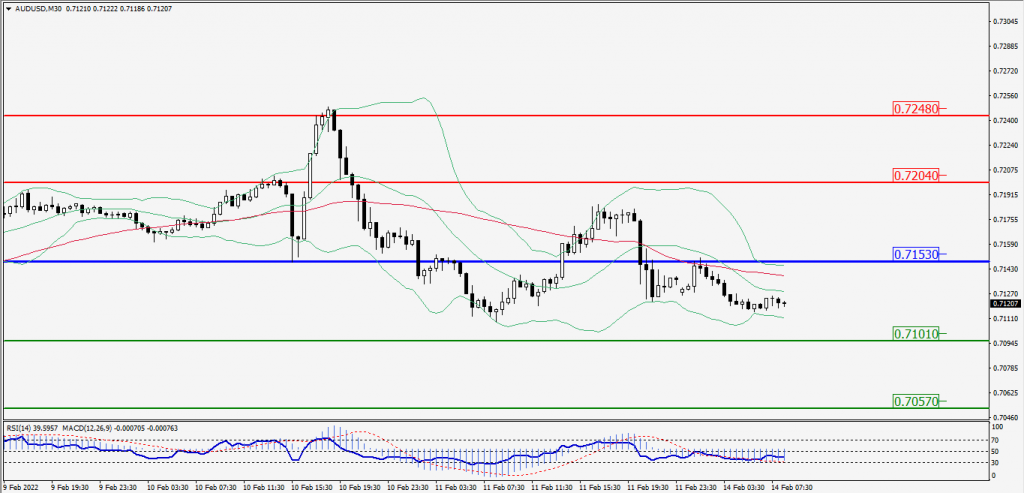
Green Lines Indicate Resistance Levels – Red Lines Indicates Support Levels
Light Blue is a Pivot Point – Black represents the price when the report was produced
CRUDEOIL Intraday: Trend on the Upside
Our pivot point is at 92.25
Preferable Price Action: Above pivots Buy Oil with 93.55 & 94.55 as targets.
Alternative Price Action: Sell crude Below pivot with targets at 90.95 and 89.95 in extension.
Comment: MACD is in the Positive territory and Pair Above 55MA.
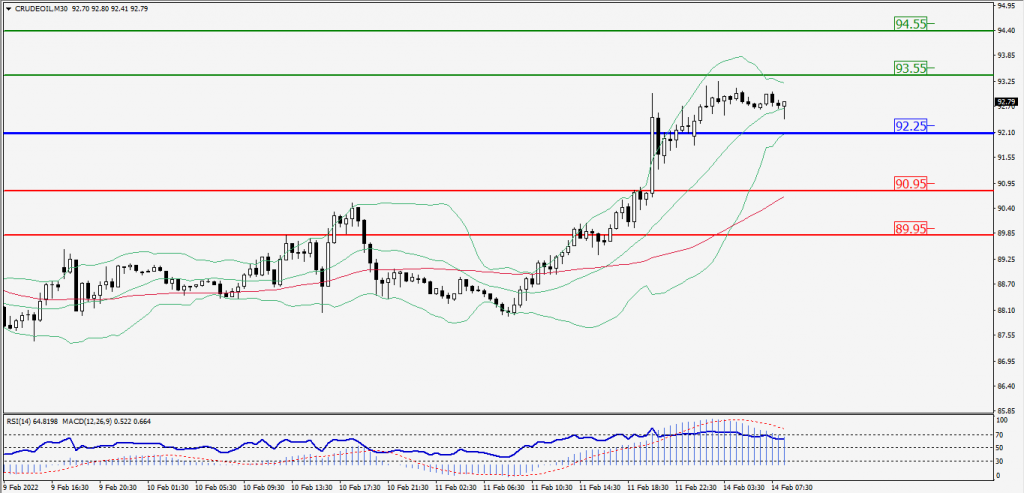
Green Lines Indicate Resistance Levels – Red Lines Indicates Support Levels
Light Blue is a Pivot Point – Black represents the price when the report was produced
XAU/USD Intraday: Trend on the Upside
Our pivot point is 1847.30
Preferable Price Action: Further Upside to 1862.50 and 1875.40.
Alternative Price Action: If the price gives a Downside breakout of a pivot, then the price extends to 1832.80 and 1820.40.
Comment: MACD is a Positive territory And Price Above 55MA.
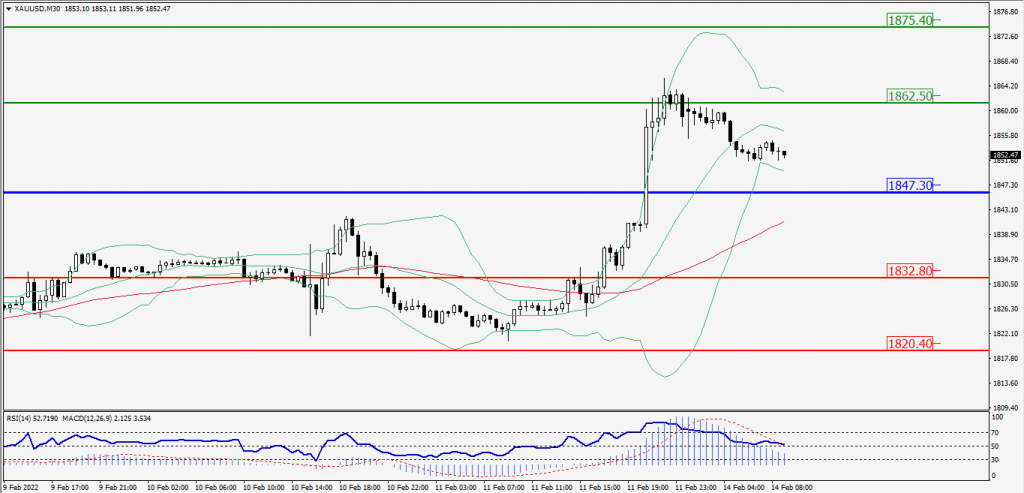
Green Lines Indicate Resistance Levels – Red Lines Indicates Support Levels
Light Blue is a Pivot Point – Black represents the price when the report was produced
Dow Jones Intraday: Trend on the Downside
Our pivot point is 34,904.00
Preferable Price Action: Take Short positions Below pivot with targets at 34,656.00 & 34,456.00.
Alternative Price Action: Above 34,904.00 looks for further Upside to 35,144.00 & 35,332.00.
Comment: RSI below 50 levels And Price Below 55MA.
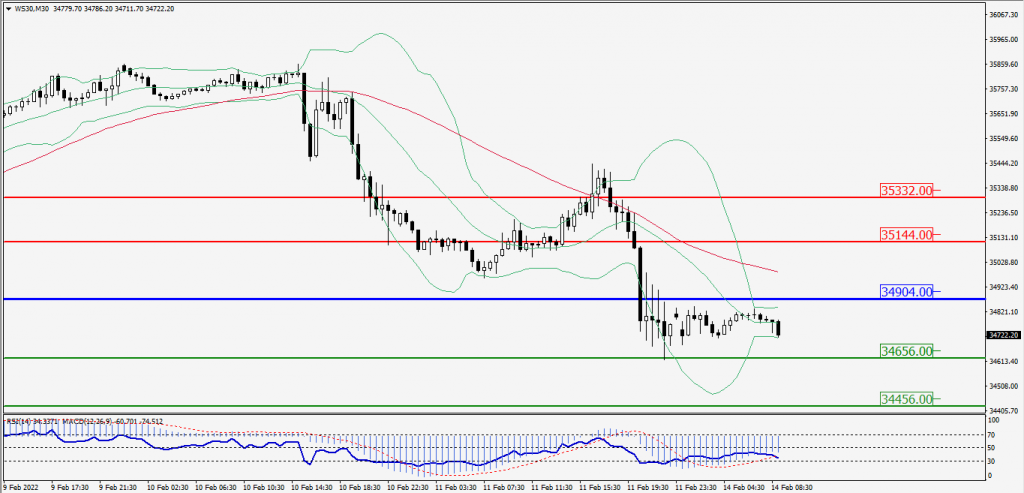
Green Lines Indicate Resistance Levels – Red Lines Indicates Support Levels
Light Blue is a Pivot Point – Black represents the price when the report was produced