Market Wrap: Stocks, Bonds, Commodities
Wall Street ended sharply lower on Friday after US consumer prices data came in hotter than expected and subsequent comments from a Federal Reserve official raised fears the US central bank will hike rates aggressively to fight inflation.
The S&P 500 Lost (1.81%) ended at 4,504.06 points, while the Nasdaq Composite rose 2.10% to 14,185.64. The Dow Jones Industrial was fell 0.1.47% to 35,241.59.
MSCI’s index of Asia-Pacific stocks outside Japan is Down 0.63%, to 788.33 levels. Australian index down 0.98% to 7,217.30. Japanese Nikkei Index up 0.42% to 27,696.08.
European stocks were Negattive on Friday, with the Stoxx Europe 50 Index fell 1.21% to 4,146.45 Germany’s DAX surged 0.96% to 15,342.00, and France’s CAC pulled lower 1.07% to 7,025.63, and U.K.’s FTSE 100 down 0.74% to 7,615.57.
Benchmark 10-year U.S. Treasury ascend as demand for safe assets gain again, today 10-year bond yields negative 1.36% to 2.001.
Oil prices eased early on Friday as hot US inflation fanned worries about aggressive interest rate hikes and as investors await the outcome of US-Iran talks that could lead to increased global crude supply.
Spot Brent crude oil rose 0.05% to $91.46 per barrel. US West Texas Intermediate crude up 0.23% to $90.09 a barrel.
The yellow metal gold lost 0.53% to 1,827.65 dollars per ounce.
Market Wrap: Forex
The dollar swung in choppy trade on Friday after U.S. consumer prices rose higher than forecast in January, leading markets to boost expectations for the Federal Reserve to aggressively fight soaring inflation.
Today, the U.S. dollar index measures the redback against a trade-weighted basket of six major currencies, which is gain 0.3% today 95.520.
The Euro US Dollar (EUR/USD) is a widely traded pair that is negative today. This left the pair trading around $1.13870.
The Japanese yen was strong against the U.S. dollar on Friday as the stock up. Today USD/JPY is collected 0.05% at the 116.060 level.
Another commodity-related currency Negative against the U.S dollar, AUD/USD lost 0.46% to 0.71320, and NZD/USD fell 0.23% to 0.66540 level.
EUR/USD Intraday: Trend on the Downside
Our pivot point is at 1.14020
Preferable Price Action: Take Short positions Below pivot level with targets at 1.13680 & 1.13410 in extension.
Alternative Price Action: Above pivot looks for a further Upside to 1.14360 & 1.14630.
Comment: Pair Below its 20MA & 55MA and RSI below 50 levels.
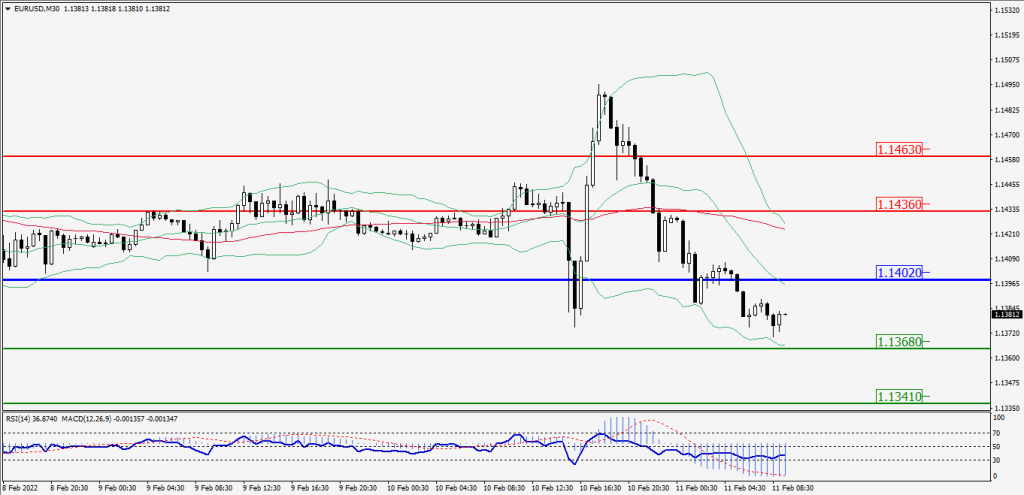
Green Lines Indicate Resistance Levels – Red Lines Indicates Support Levels
Light Blue is a Pivot Point – Black represents the price when the report was produced
GBP/USD Intraday: In a Consolidation Zone
Our pivot point is at 1.35590
Preferable Price Action: Sell positions Below pivot with targets at 1.35250 & 1.34930 in extension.
Alternative Price Action: The price Above pivot would call for further Upside to 1.35930 & 1.36270.
Comment: RSI below 50 levels and Pair below 55MA.
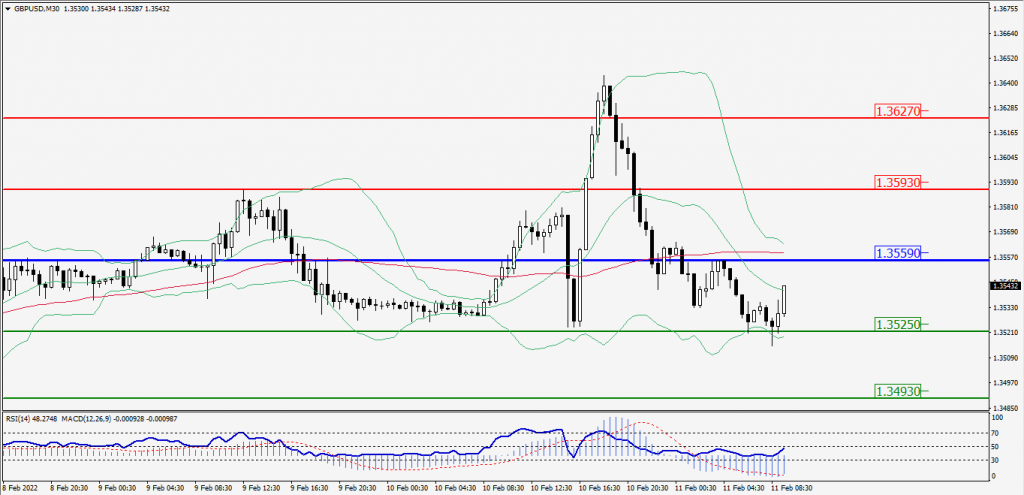
Green Lines Indicate Resistance Levels – Red Lines Indicates Support Levels
Light Blue is a Pivot Point – Black represents the price when the report was produced
USD/JPY Intraday: Trend on the Upside
Our pivot point is at 115.870
Preferable Price Action: Buy position Above pivot with the target at 116.210 and 116.480 in extension.
Alternative Price Action: The Downside breakout of the pivot would call for 115.540 and 115.260.
Comment: MACD in Negative territory and Pair Above 55MA.
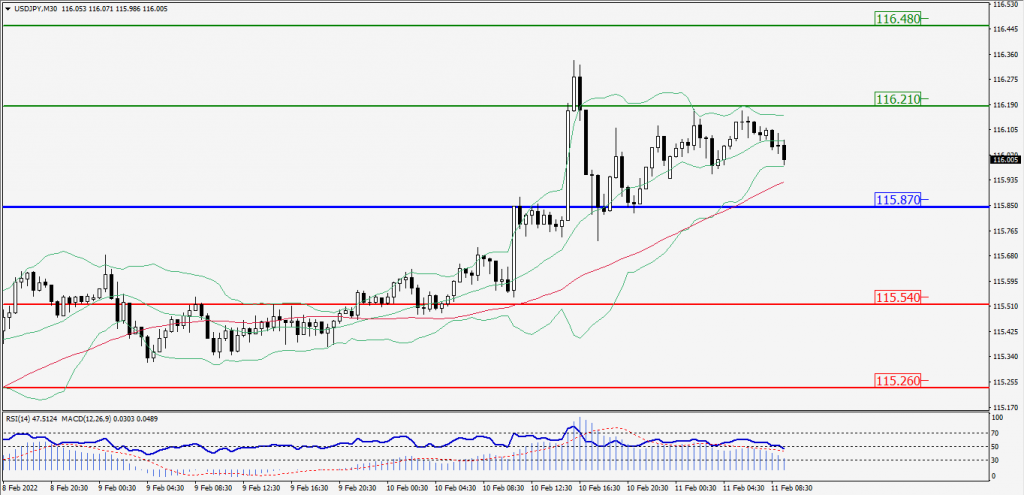
Green Lines Indicate Resistance Levels – Red Lines Indicates Support Levels
Light Blue is a Pivot Point – Black represents the price when the report was produced
AUD/USD Intraday: Trend on the Downside
Our pivot point is at 0.71520
Preferable Price Action: Sell Positions Below pivot with targets at 0.71090 & 0.70810 in extension.
Alternative Price Action: Above pivot looks for a further Upside with 0.71950 & 0.72230 as targets.
Comment: Pair Below 20MA & 55MA and RSI below 50 levels.
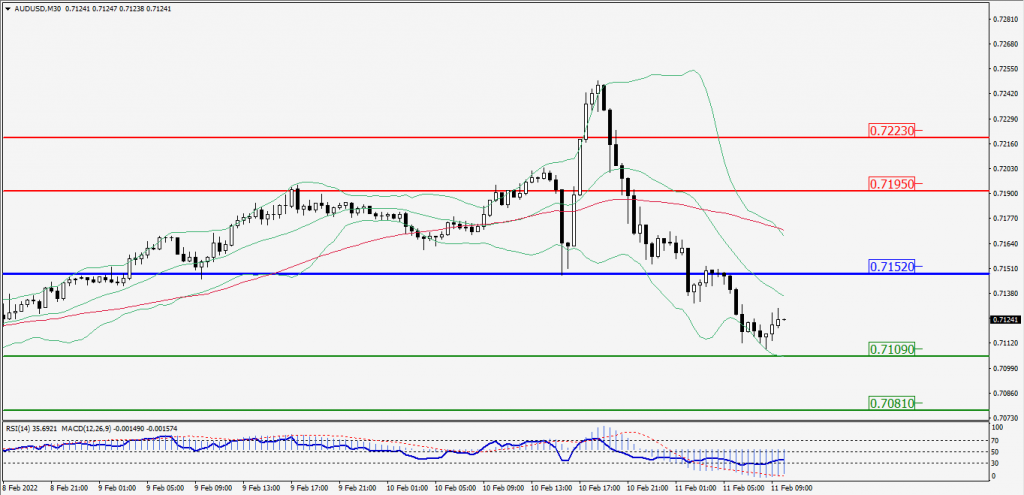
Green Lines Indicate Resistance Levels – Red Lines Indicates Support Levels
Light Blue is a Pivot Point – Black represents the price when the report was produced
CRUDEOIL Intraday: Resistance Level at 89.00
Our pivot point is at 89.00
Preferable Price Action: Below pivots Sell Oil with 88.10 & 87.25 as targets.
Alternative Price Action: Buy crude Above pivot with targets at 89.90 and 90.80 in extension.
Comment: MACD is in the Negative territory and Pair Below 55MA.
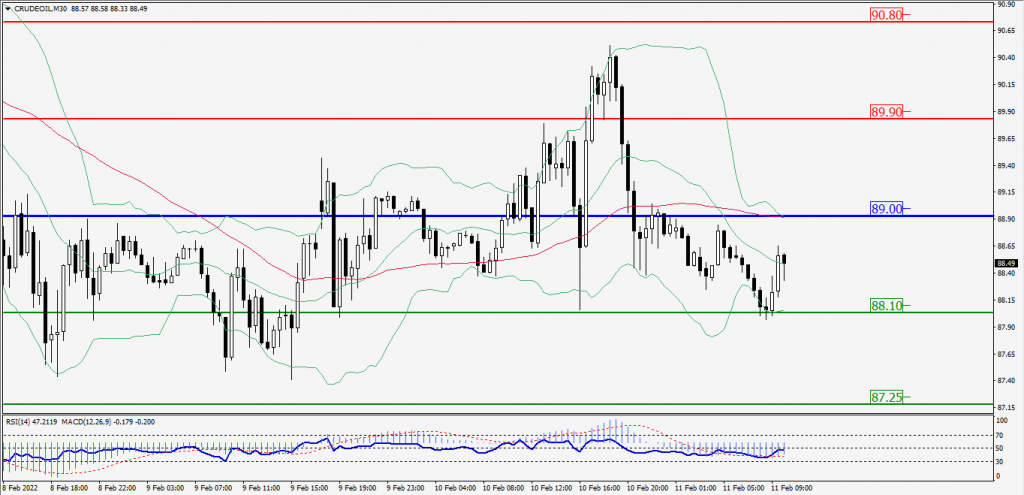
Green Lines Indicate Resistance Levels – Red Lines Indicates Support Levels
Light Blue is a Pivot Point – Black represents the price when the report was produced
XAU/USD Intraday: Trend on the Downside
Our pivot point is 1832.80
Preferable Price Action: Further Downside to 1821.20 and 1811.10.
Alternative Price Action: If the price gives an Upside breakout of a pivot, then the price extends to 1844.30 and 1853.80.
Comment: MACD is a Neutral territory And Price Below 55MA.

Green Lines Indicate Resistance Levels – Red Lines Indicates Support Levels
Light Blue is a Pivot Point – Black represents the price when the report was produced
Dow Jones Intraday: Trend on the Downside
Our pivot point is 35,326.00
Preferable Price Action: Take Short positions Below pivot with targets at 35,009.00 & 34,743.00.
Alternative Price Action: Above 35,326.00 looks for further Upside to 35,650.00 & 35,910.00.
Comment: RSI below 50 levels And Price Below 55MA.
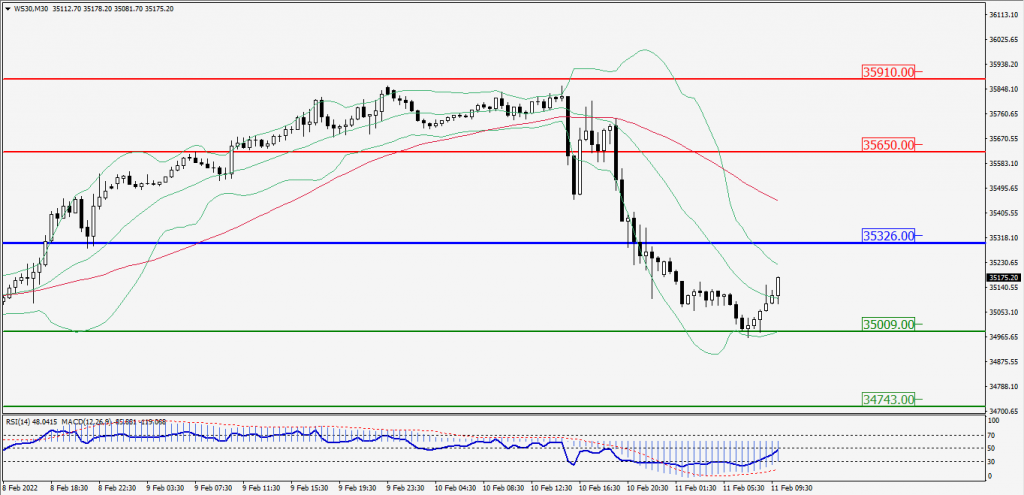
Green Lines Indicate Resistance Levels – Red Lines Indicates Support Levels
Light Blue is a Pivot Point – Black represents the price when the report was produced