Market Wrap: Stocks, Bonds, Commodities
All three Wall Street benchmarks ended higher on Thursday, rising for a fourth straight session after a turbulent start to the year, aided by upbeat earnings from Google-parent Alphabet and chipmaker Advanced Micro Devices.
The S&P 500 Gain (0.94%) ended at 4,589.32 points, while the Nasdaq Composite rose 0.50% to 14,417.50. The Dow Jones Industrial was climbed 0.63% reach 35,629.33.
MSCI’s index of Asia-Pacific stocks outside Japan is up 0.08%, to 767.77 levels. Australian index spread 0.14% to 7,078.00. Japanese Nikkei Index lost 1.06% to 27,241.31.
European stocks were mixed on Thursday, with the Stoxx Europe 50 Index fell 0.37% to 4,206.35 Germany’s DAX drop 0.31% to 15,591.75, and France’s CAC pulled flat 7,114.16, and U.K.’s FTSE 100 higher 0.18% to 7,596.95.
Benchmark 10-year U.S. Treasury descend as demand for safe assets fell again, today 10-year bond yields rise 0.32% to 1.772.
Oil prices surged on Thursday after OPEC+ stuck to their planned moderate output increases despite pressure from top consumers to raise output.
Spot Brent crude oil lost 0.40% to $89.11 per barrel. US West Texas Intermediate crude down 0.52% to $87.80 a barrel.
The yellow metal gold declines 0.28% to 1,805.15 dollars per ounce.
Market Wrap: Forex
The U.S. dollar edged higher Thursday, benefiting from a degree of risk aversion after disappointing results from Facebook owner Meta Platforms, but the focus will be on central bank meetings in the U.K. and Europe.
Today, the U.S. dollar index measures the greenback against a trade-weighted basket of six major currencies, which is rose 0.19% at 96.120.
The Euro US Dollar (EUR/USD) is a widely traded pair that is lost today. This left the pair trading around $1.12940.
The Japanese yen was strong against the U.S. dollar on Thursday as the stock up. Today USD/JPY is collected 0.22% at the 114.690 level.
Another commodity-related currency mixed against the U.S dollar, AUD/USD fell 0.18% to 0.71230, and NZD/USD constructed 0.11 to 0.66340 level.
EUR/USD Intraday: Trend on the Upside
Our pivot point is at 1.12740
Preferable Price Action: Take Long positions Above pivot level with targets at 1.13330 & 1.13850 in extension.
Alternative Price Action: Below pivot looks for a further Downside to 1.12150 & 1.11630.
Comment: Pair Below its 20MA & 55MA and RSI below 50 levels.
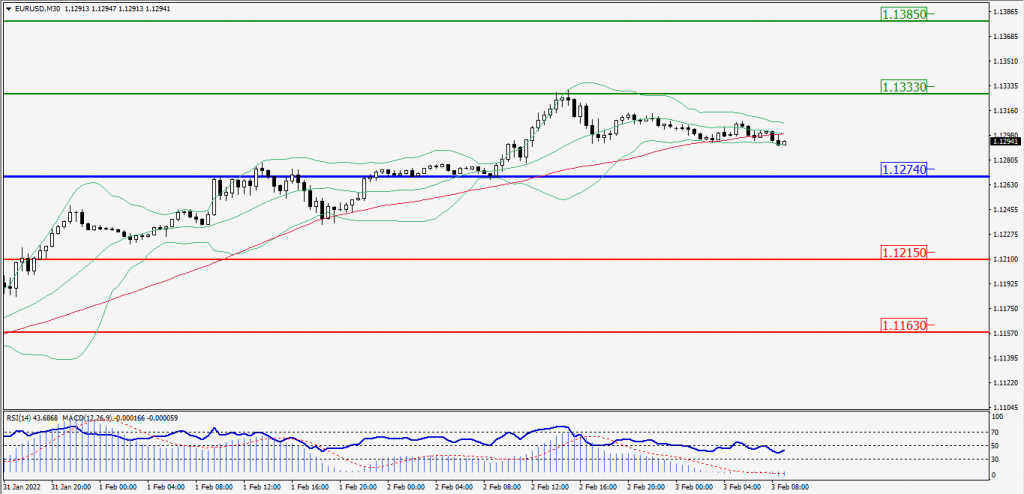
Green Lines Indicate Resistance Levels – Red Lines Indicates Support Levels
Light Blue is a Pivot Point – Black represents the price when the report was produced
GBP/USD Intraday: Trend on the Upside
Our pivot point is at 1.35350
Preferable Price Action: Buy positions Above pivot with targets at 1.35840 & 1.36260 in extension.
Alternative Price Action: The price Below pivot would call for further Downside to 1.34860 & 1.34440.
Comment: RSI below 50 levels and Pair below 20MA.
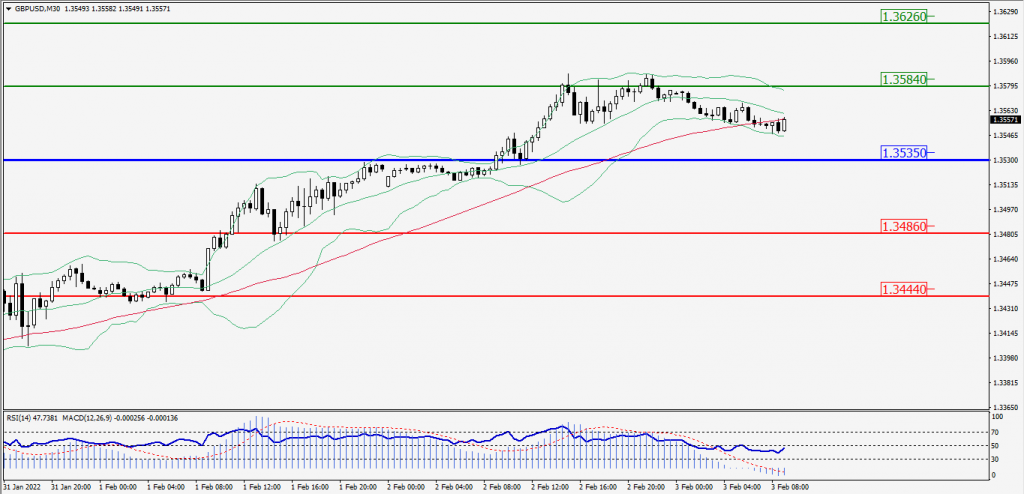
Green Lines Indicate Resistance Levels – Red Lines Indicates Support Levels
Light Blue is a Pivot Point – Black represents the price when the report was produced
USD/JPY Intraday: Support at 114.420
Our pivot point is at 114.420
Preferable Price Action: Buy position Above pivot with the target at 114.870 and 115.230 in extension.
Alternative Price Action: The Downside breakout of the pivot would call for 113.970 and 113.610.
Comment: MACD in positive territory and Pair Above its 20MA & 55MA.
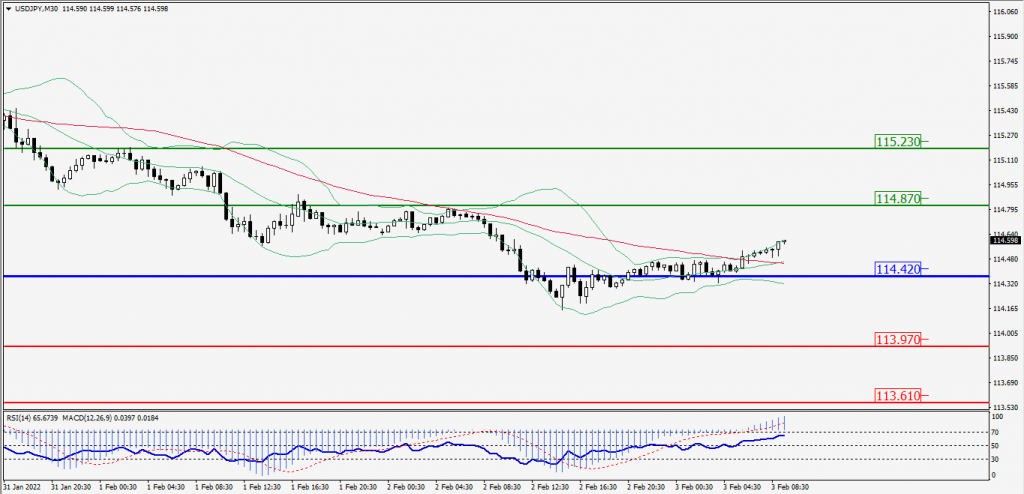
Green Lines Indicate Resistance Levels – Red Lines Indicates Support Levels
Light Blue is a Pivot Point – Black represents the price when the report was produced
AUD/USD Intraday: In a Consolidation Zone
Our pivot point is at 0.71390
Preferable Price Action: Sell Positions Below pivot with targets at 0.71010 & 0.70680 in extension.
Alternative Price Action: Above pivot looks for a further Upside with 0.71770 & 0.72100 as targets.
Comment: Pair below 55MA and RSI at 50 levels.
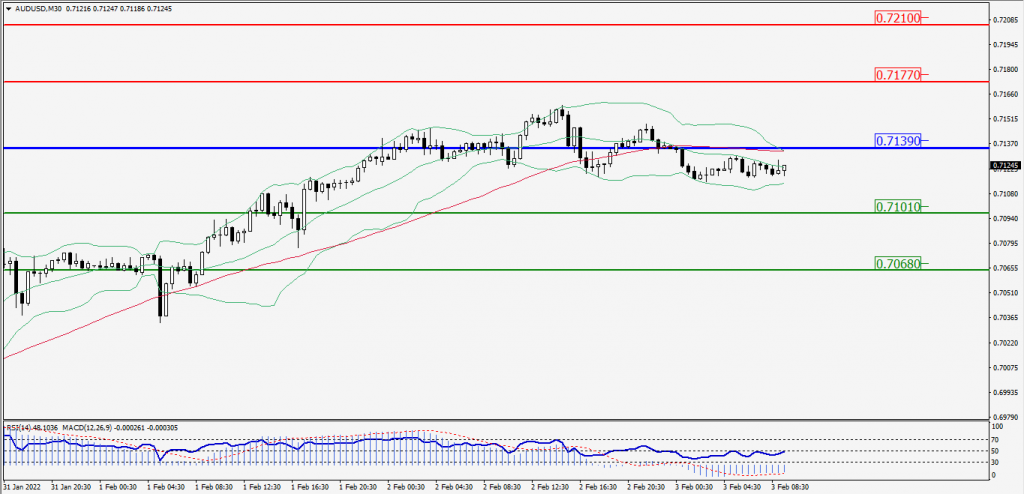
Green Lines Indicate Resistance Levels – Red Lines Indicates Support Levels
Light Blue is a Pivot Point – Black represents the price when the report was produced
CRUDEOIL Intraday: Support at 87.25
Our pivot point is at 87.25
Preferable Price Action: Below pivots Sell Oil with 86.65 & 86.15 as targets.
Alternative Price Action: Buy crude Above pivot with targets at 87.85 and 88.35 in extension.
Comment: MACD is in the Negative territory and Pair Below 55MA.
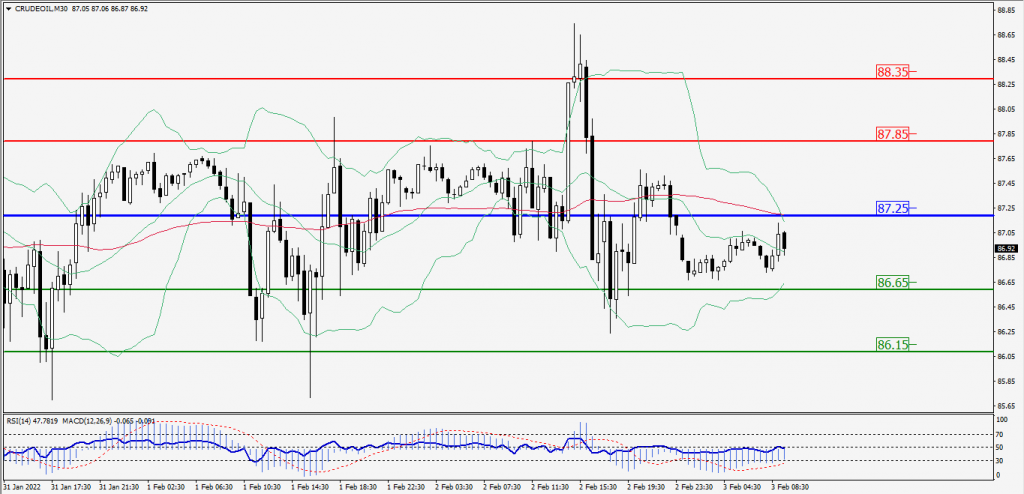
Green Lines Indicate Resistance Levels – Red Lines Indicates Support Levels
Light Blue is a Pivot Point – Black represents the price when the report was produced
XAU/USD Intraday: Major support at 1802.50
Our pivot point is 1802.50
Preferable Price Action: Further Upside to 1807.90 and 1812.40.
Alternative Price Action: If the price gives a Downside breakout of a pivot, then the price extends to 1797.10 and 1792.60.
Comment: MACD is a Negative territory And Price Below 20MA.
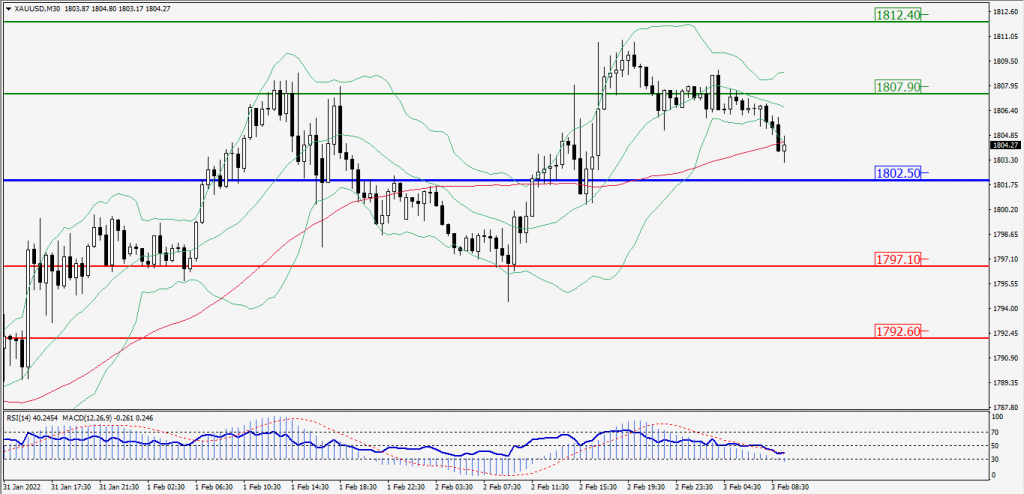
Green Lines Indicate Resistance Levels – Red Lines Indicates Support Levels
Light Blue is a Pivot Point – Black represents the price when the report was produced
Dow Jones Intraday: Trend on the Major Upside
Our pivot point is 35,448.00
Preferable Price Action: Take Long positions Above pivot with targets at 35,851.00 & 36,132.00.
Alternative Price Action: Below 35,448.00 looks for further Downside to 35,045.00 & 34,764.00.
Comment: RSI above 50 levels And price is Above 55MA.
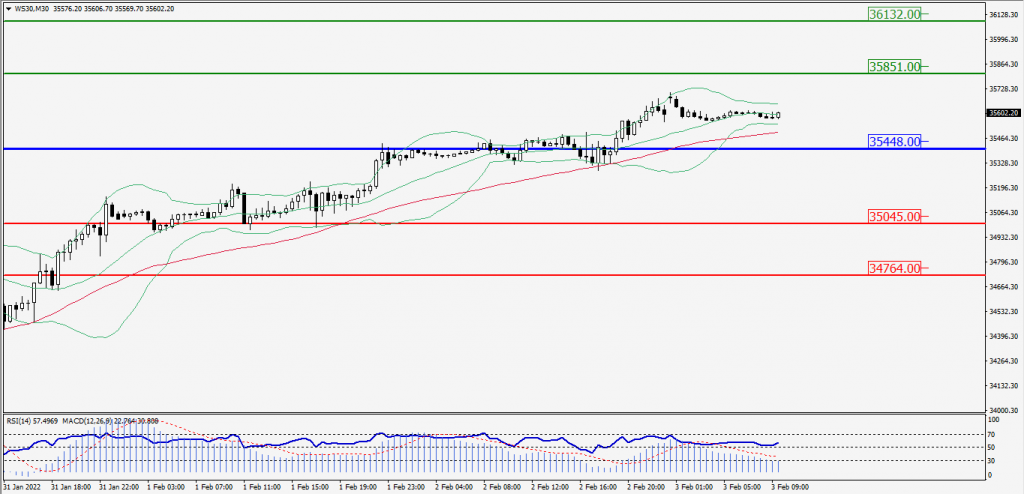
Green Lines Indicate Resistance Levels – Red Lines Indicates Support Levels
Light Blue is a Pivot Point – Black represents the price when the report was produced