Market Wrap: Stocks, Bonds, Commodities
All three Wall Street benchmarks advanced on Wednesday and the energy index closed at a multi-year high, although seesaw trading reflected investor uncertainty about how to play the current market.
The S&P 500 Gain (0.69%) ended at 4,546.54 points, while the Nasdaq Composite rose 0.75% to 14,346.00. The Dow Jones Industrial was climbed 0.78% reach 35,405.24.
MSCI’s index of Asia-Pacific stocks outside Japan is up 0.15%, to 768.05 levels. Australian index collect 1.17% to 7,087.70. Japanese Nikkei Index gathered 1.68% to 27,533.60.
European stocks were positive on Wednesday, with the Stoxx Europe 50 Index rose 0.46% to 4,243.75 Germany’s DAX lifted 0.43% to 15,687.14, and France’s CAC pulled upside 0.45% to 7,131.59, and U.K.’s FTSE 100 higher 0.55% to 7,577.20.
Benchmark 10-year U.S. Treasury descend as demand for safe assets fell again, today 10-year bond yields lost 1.28% to 1.777.
Oil prices rose on Wednesday towards last week’s seven-year highs after data showing a fall in US crude stocks underlined solid demand, but investors remained cautious ahead of an OPEC+ meeting due later in the day.
Spot Brent crude oil lost 0.25% to $88.94 per barrel. US West Texas Intermediate crude up 0.18% to $88.04 a barrel.
The yellow metal gold declines 0.08% to 1,800.05 dollars per ounce.
Market Wrap: Forex
The U.S. dollar edged lower Wednesday as gains in global equity markets boosted risk sentiment while Federal Reserve officials reined in interest rate hike expectations.
Today, the U.S. dollar index measures the redback against a trade-weighted basket of six major currencies, which is fell 0.24% at 96.150.
The Euro US Dollar (EUR/USD) is a widely traded pair that is gained today. This left the pair trading around $1.12920.
The Japanese yen was weak against the U.S. dollar on Wednesday as the stock down. Today USD/JPY is lost 0.16% at the 114.530 level.
Another commodity-related currency mixed against the U.S dollar, AUD/USD collect 0.11% to 0.70860, and NZD/USD deconstructed 0.06 to 0.66340 level.
EUR/USD Intraday: Trend on the Upside
Our pivot point is at 1.12490
Preferable Price Action: Take Long positions Above pivot level with targets at 1.13030 & 1.13480 in extension.
Alternative Price Action: Below pivot looks for a further Downside to 1.11950 & 1.11500.
Comment: Pair Above 55MA and RSI at 50 levels.
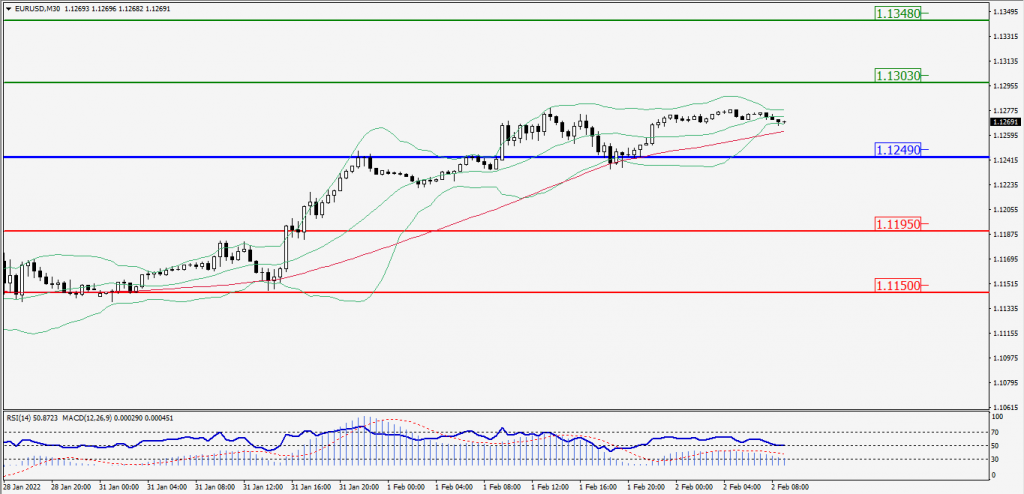
Green Lines Indicate Resistance Levels – Red Lines Indicates Support Levels
Light Blue is a Pivot Point – Black represents the price when the report was produced
GBP/USD Intraday: Trend on the Upside
Our pivot point is at 1.35100
Preferable Price Action: Buy positions Above pivot with targets at 1.35560 & 1.35950 in extension.
Alternative Price Action: The price Below pivot would call for further Downside to 1.34640 & 1.34250.
Comment: RSI above 50 levels and Pair Above 55MA.
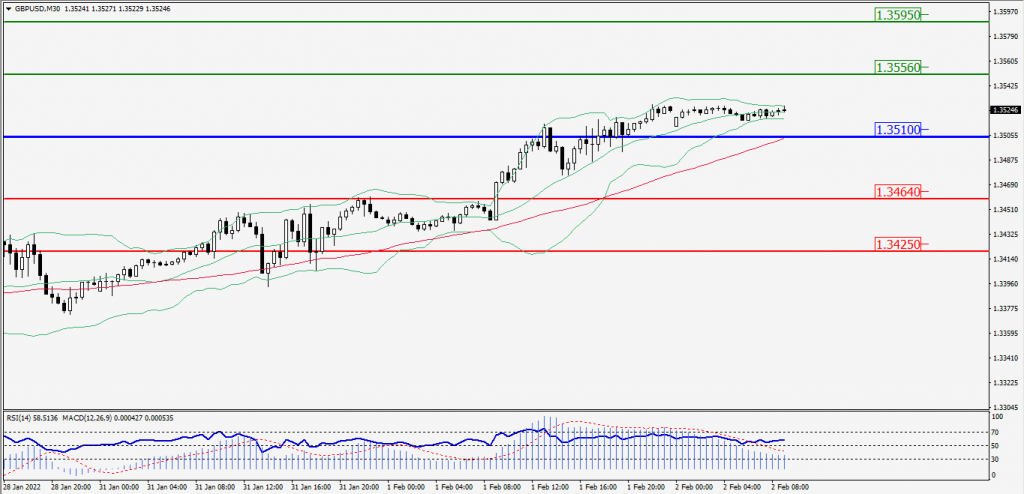
Green Lines Indicate Resistance Levels – Red Lines Indicates Support Levels
Light Blue is a Pivot Point – Black represents the price when the report was produced
USD/JPY Intraday: Resistance at 114.910
Our pivot point is at 114.910
Preferable Price Action: Sell position Below pivot with the target at 114.420 and 114.010 in extension.
Alternative Price Action: The Upside breakout of the pivot would call for 115.400 and 115.810.
Comment: MACD in negative territory and Pair Below its 20MA & 55MA.
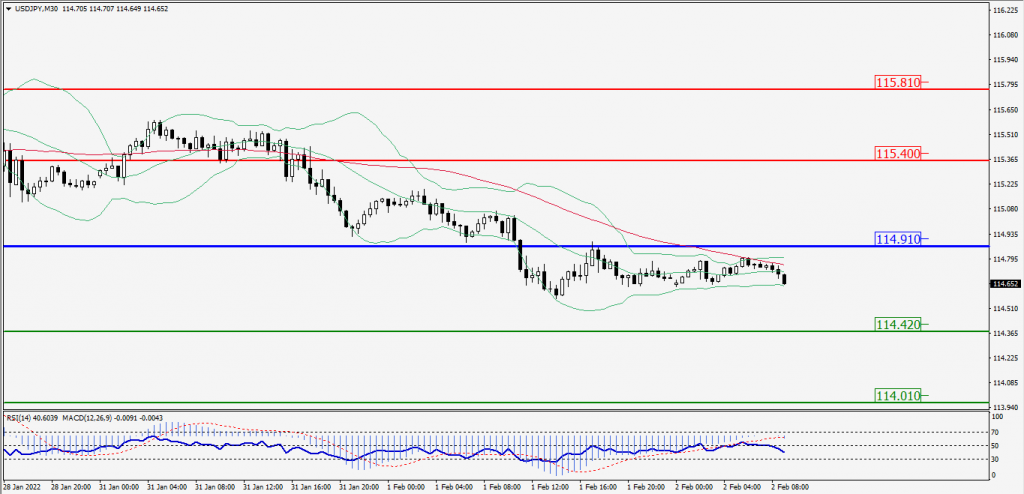
Green Lines Indicate Resistance Levels – Red Lines Indicates Support Levels
Light Blue is a Pivot Point – Black represents the price when the report was produced
AUD/USD Intraday: Trend on the Upside
Our pivot point is at 0.71150
Preferable Price Action: Buy Positions Above pivot with targets at 0.71580 & 0.71940 in extension.
Alternative Price Action: Below pivot looks for a further Downside with 0.70720 & 0.70360 as targets.
Comment: Pair Above 55MA and RSI above 50 levels.
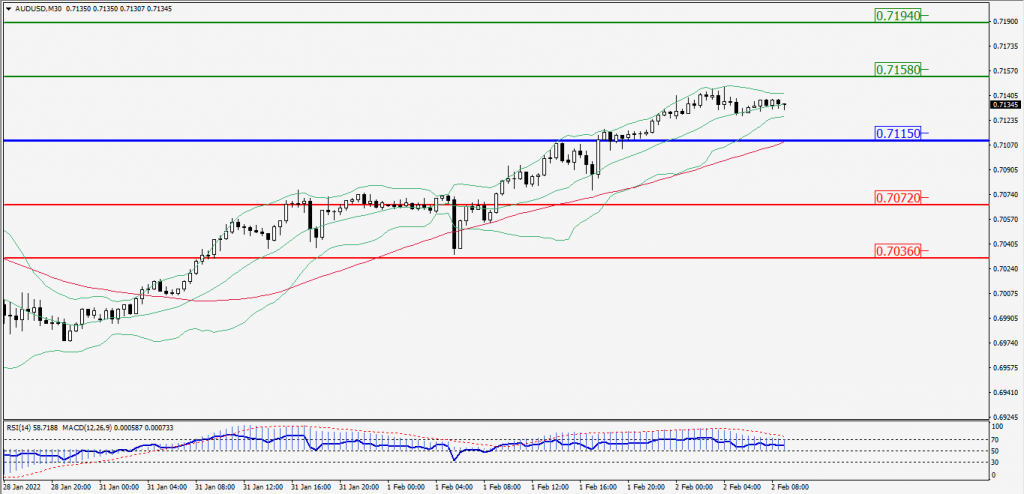
Green Lines Indicate Resistance Levels – Red Lines Indicates Support Levels
Light Blue is a Pivot Point – Black represents the price when the report was produced
CRUDEOIL Intraday: Support at 87.25
Our pivot point is at 87.25
Preferable Price Action: Above pivots Buy Oil with 87.90 & 88.45 as targets.
Alternative Price Action: Sell crude Below pivot with targets at 86.60 and 86.05 in extension.
Comment: MACD is in the Positive territory and Pair Above 55MA.
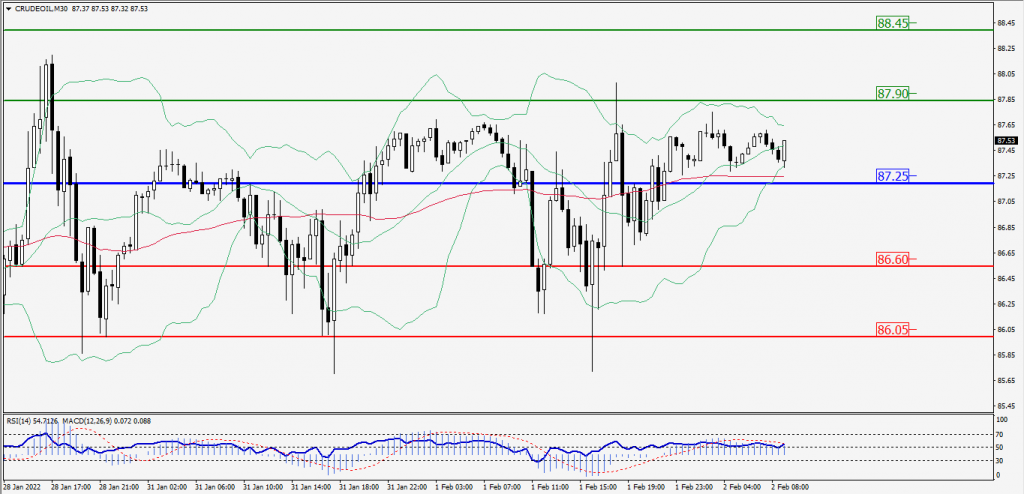
Green Lines Indicate Resistance Levels – Red Lines Indicates Support Levels
Light Blue is a Pivot Point – Black represents the price when the report was produced
XAU/USD Intraday: Trend on the Downside
Our pivot point is 1804.20
Preferable Price Action: Further Downside to 1791.70 and 1782.40.
Alternative Price Action: If the price gives an Upside breakout of a pivot, then the price extends to 1816.70 and 1826.00.
Comment: MACD is a Negative territory And Price Below its 20MA & 55MA.
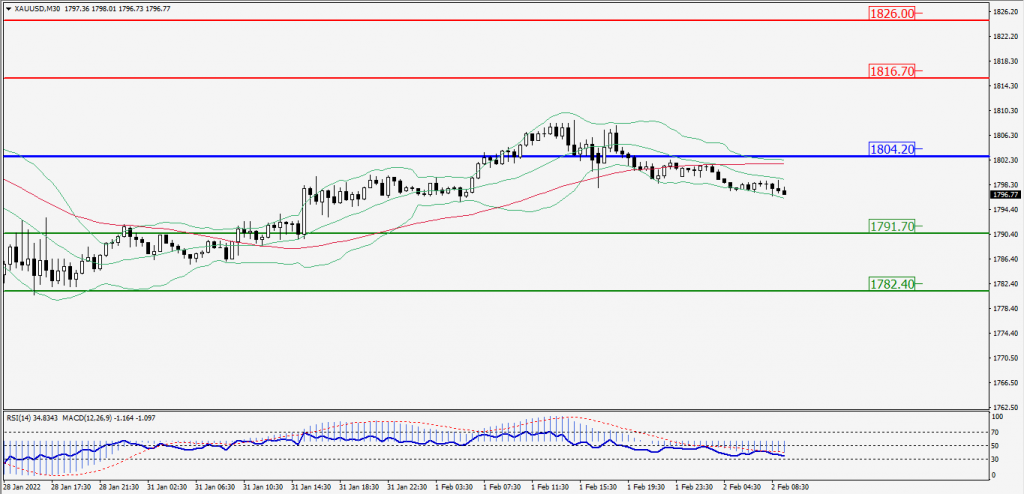
Green Lines Indicate Resistance Levels – Red Lines Indicates Support Levels
Light Blue is a Pivot Point – Black represents the price when the report was produced
Dow Jones Intraday: Support at 35,178.00
Our pivot point is 35,178.00
Preferable Price Action: Take Long positions Above pivot with targets at 35,745.00 & 36,106.00.
Alternative Price Action: Below 35,178.00 looks for further Downside to 34,611.00 & 34,250.00.
Comment: RSI above 50 levels And price is Above 55MA.
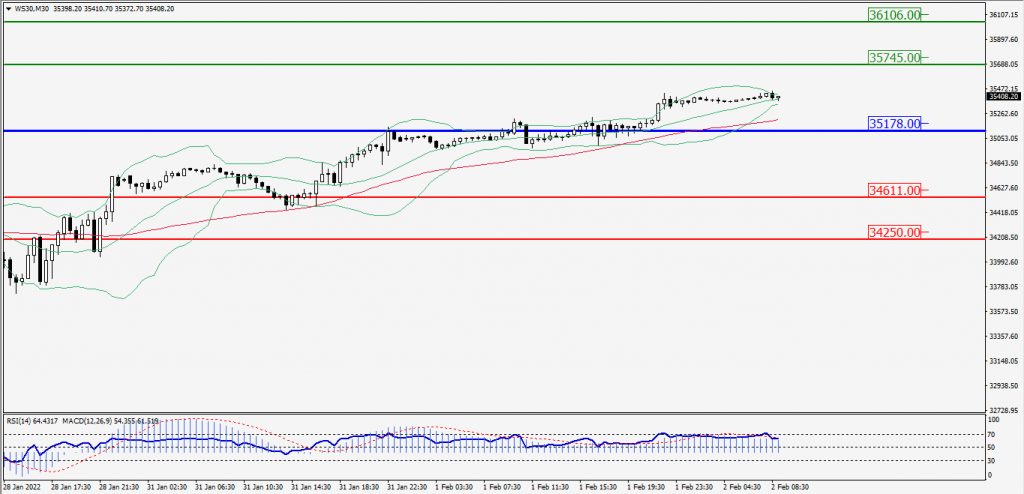
Green Lines Indicate Resistance Levels – Red Lines Indicates Support Levels
Light Blue is a Pivot Point – Black represents the price when the report was produced