Market Wrap: Stocks, Bonds, Commodities
US stocks closed higher on Tuesday, at the end of a volatile month for Wall Street where the tech-heavy Nasdaq narrowly avoided its worst-ever start to the year and the S&P 500 recorded its weakest January performance since 2009.
The S&P 500 Gain (1.89%) ended at 4,515.55 points, while the Nasdaq Composite rose 3.41% to 14,239.90. The Dow Jones Industrial was climbed 1.17% reach 35,131.86.
MSCI’s index of Asia-Pacific stocks outside Japan is up 0.13%, to 765.63 levels. Australian index collect 0.49% to 7,006.00. Japanese Nikkei Index gathered 0.28% to 27,078.48.
European stocks were positive on Tuesday, with the Stoxx Europe 50 Index rose 1.23% to 4,225.85 Germany’s DAX lifted 1.25% to 15,664.84, and France’s CAC pulled upside 1.05% to 7,072.93, and U.K.’s FTSE 100 higher 0.90% to 7,531.30.
Benchmark 10-year U.S. Treasury ascend as demand for safe assets gains again, today 10-year bond yields rose 0.61% to 1.793.
Oil prices rose on Monday to end January with their biggest monthly gain in a year, boosted by a supply shortage and political tensions in Eastern Europe and the Middle East.
Spot Brent crude oil gained 0.12% to $89.37 per barrel. US West Texas Intermediate crude up 0.20% to $88.33 a barrel.
The yellow metal gold accepts 0.47% to 1,803.50 dollars per ounce.
Market Wrap: Forex
The dollar fell again on Tuesday, while risk-sensitive currencies such as the British pound gained and the Australian dollar recovered from an overnight drop.
Today, the U.S. dollar index measures the redback against a trade-weighted basket of six major currencies, which is fell 0.16% at 96.380.
The Euro US Dollar (EUR/USD) is a widely traded pair that is gained today. This left the pair trading around $1.12540.
The Japanese yen was weak against the U.S. dollar on Tuesday as the stock down. Today USD/JPY is lost 0.08% at the 115.000 level.
Another commodity-related currency positive against the U.S dollar, AUD/USD collect 0.32% to 0.70860, and NZD/USD constructed 0.38 to 0.65990 level.
EUR/USD Intraday: Trend on the Upside
Our pivot point is at 1.12180
Preferable Price Action: Take Long positions Above pivot level with targets at 1.12720 & 1.13170 in extension.
Alternative Price Action: Below pivot looks for a further Downside to 1.11640 & 1.11190.
Comment: Pair Above its 20MA & 55MA and RSI above 50 levels.
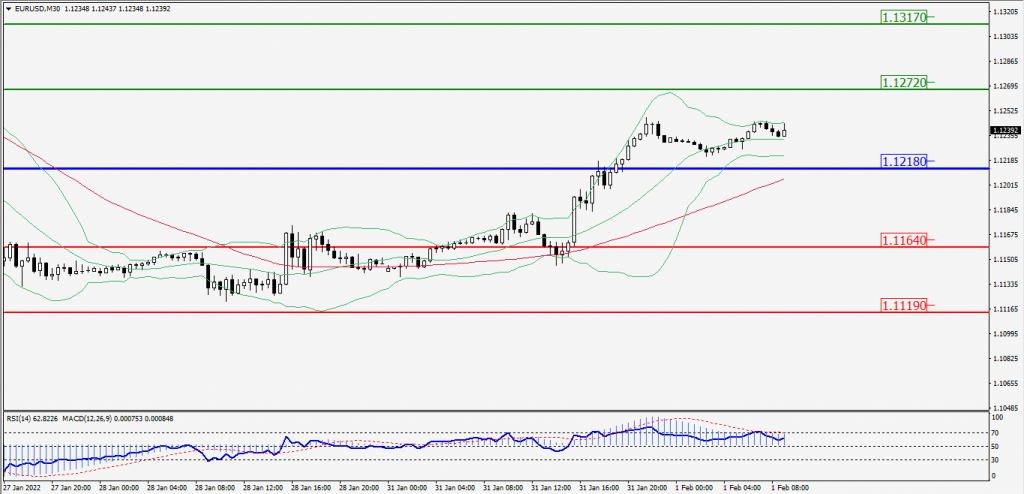
Green Lines Indicate Resistance Levels – Red Lines Indicates Support Levels
Light Blue is a Pivot Point – Black represents the price when the report was produced
GBP/USD Intraday: Trend on the Upside
Our pivot point is at 1.34360
Preferable Price Action: Buy positions Above pivot with targets at 1.34870 & 1.35330 in extension.
Alternative Price Action: The price Below pivot would call for further Downside to 1.33850 & 1.33390.
Comment: RSI above 50 levels and Pair Above 55MA.
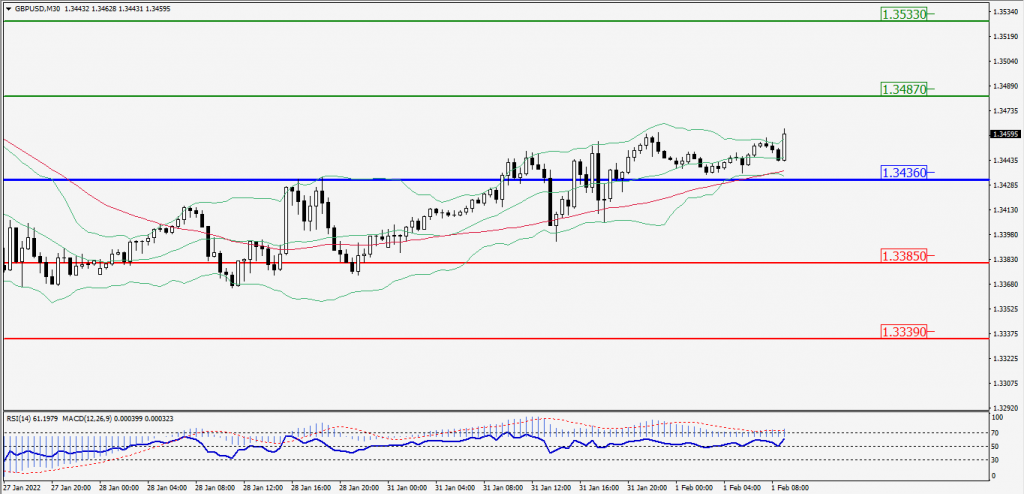
Green Lines Indicate Resistance Levels – Red Lines Indicates Support Levels
Light Blue is a Pivot Point – Black represents the price when the report was produced
USD/JPY Intraday: Resistance at 115.230
Our pivot point is at 115.230
Preferable Price Action: Sell position Below pivot with the target at 114.820 and 114.490 in extension.
Alternative Price Action: The Upside breakout of the pivot would call for 115.640 and 115.970.
Comment: MACD in negative territory and Pair Below its 20MA & 55MA.
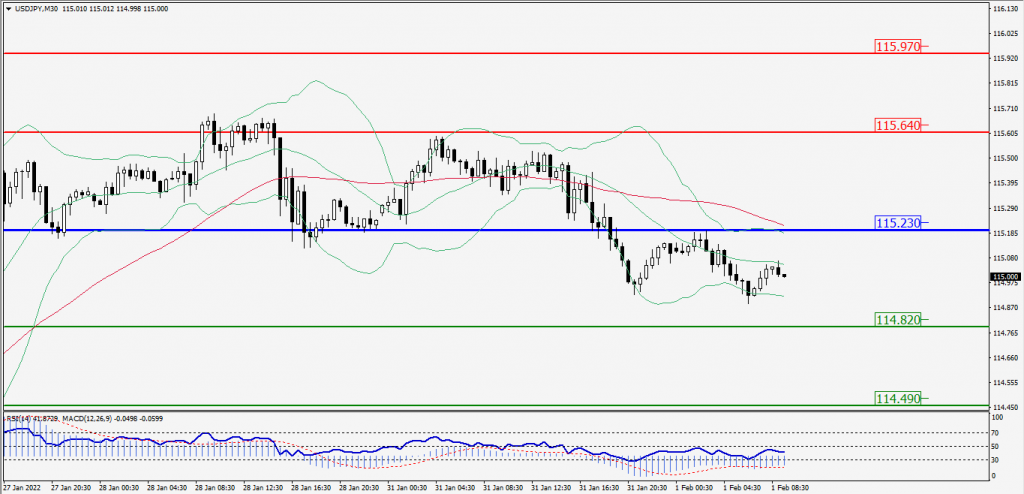
Green Lines Indicate Resistance Levels – Red Lines Indicates Support Levels
Light Blue is a Pivot Point – Black represents the price when the report was produced
AUD/USD Intraday: Trend on the Upside
Our pivot point is at 0.70540
Preferable Price Action: Buy Positions Above pivot with targets at 0.71040 & 0.71480 in extension.
Alternative Price Action: Below pivot looks for a further Downside with 0.70040 & 0.69600 as targets.
Comment: Pair Above its 55MA & 20MA and RSI above 50 levels.
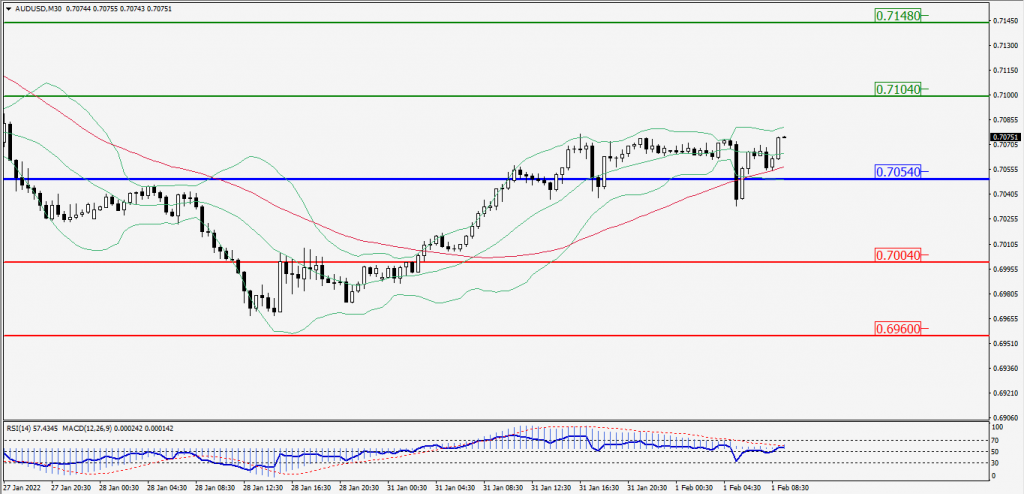
Green Lines Indicate Resistance Levels – Red Lines Indicates Support Levels
Light Blue is a Pivot Point – Black represents the price when the report was produced
CRUDEOIL Intraday: Support at 86.95
Our pivot point is at 86.95
Preferable Price Action: Above pivots Buy Oil with 88.00 & 88.85 as targets.
Alternative Price Action: Sell crude Below pivot with targets at 85.90 and 85.05 in extension.
Comment: MACD is in the Negative territory and Pair Above 55MA.
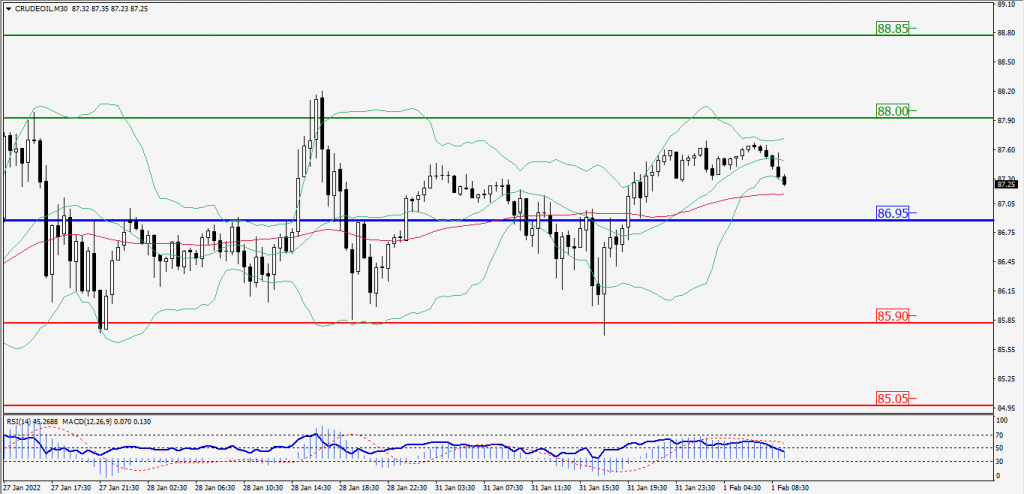
Green Lines Indicate Resistance Levels – Red Lines Indicates Support Levels
Light Blue is a Pivot Point – Black represents the price when the report was produced
XAU/USD Intraday: Trend on the Upside
Our pivot point is 1797.10
Preferable Price Action: Further Upside to 1812.70 and 1825.90.
Alternative Price Action: If the price gives a Downside breakout of a pivot, then the price extends to 1781.50 and 1768.30.
Comment: MACD is a Positive territory And Price Above its 20MA & 55MA.
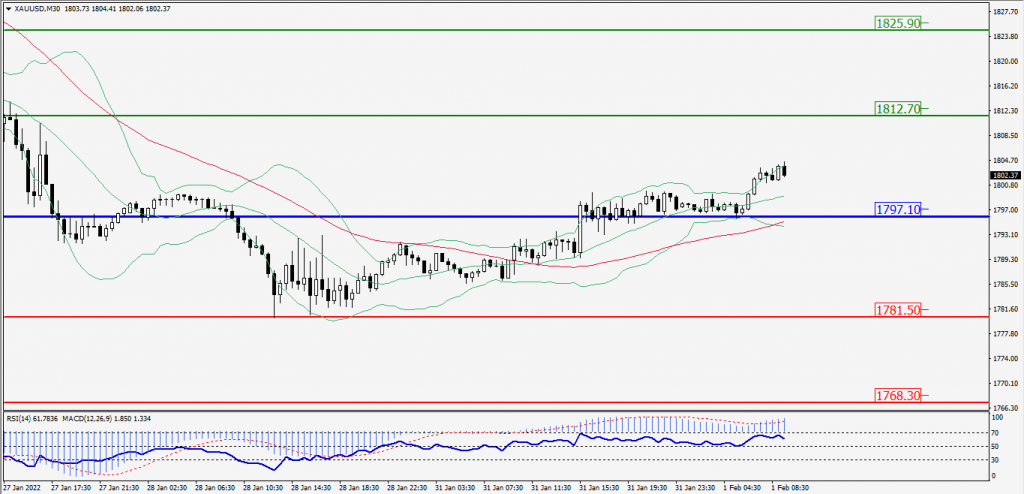
Green Lines Indicate Resistance Levels – Red Lines Indicates Support Levels
Light Blue is a Pivot Point – Black represents the price when the report was produced
Dow Jones Intraday: Support at 34,819.00
Our pivot point is 34,819.00
Preferable Price Action: Take Long positions Above pivot with targets at 35,540.00 & 36,125.00.
Alternative Price Action: Below 34,819.00 looks for further Downside to 34,098.00 & 33,513.00.
Comment: RSI above 50 levels And price is Above its 20MA & 55MA.
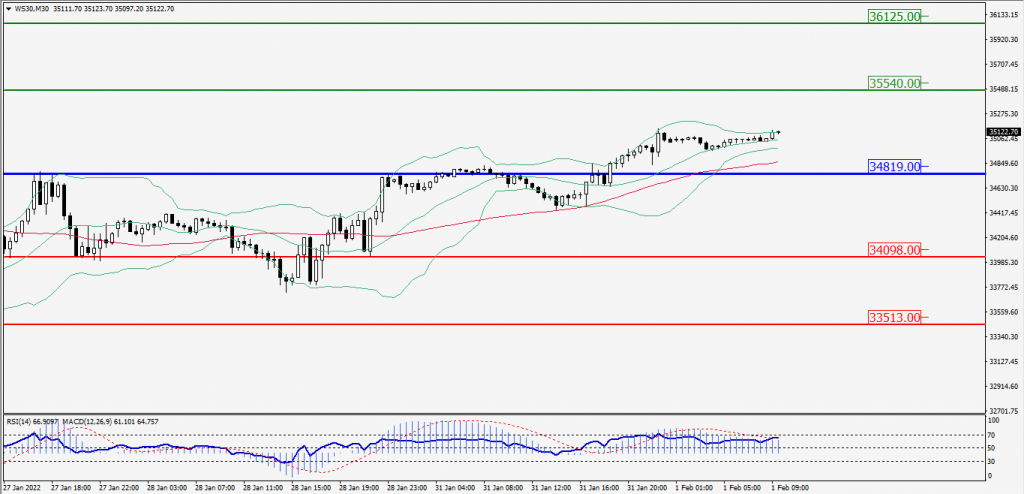
Green Lines Indicate Resistance Levels – Red Lines Indicates Support Levels
Light Blue is a Pivot Point – Black represents the price when the report was produced