Market Wrap: Stocks, Bonds, Commodities
U.S. stock indexes rose on Thursday after data showed that while U.S. inflation was at its highest in decades, it largely met economists’ expectations, cooling some fears that the Federal Reserve would have to pull back support even more forcibly than already expected.
The S&P 500 collect (0.28%) to end at 4,726.35 points, while the Nasdaq Composite gain 34.90 points (0.23%) to 15,188.40. The Dow Jones Industrial rose (0.11%) to 36,290.32.
MSCI’s index of Asia-Pacific stocks outside Japan rose 0.04%, to 808.31 levels. Australian index up 0.48% to 7,474.40. Japanese Nikkei Index fell 0.96% to 28,489.13.
European stocks were negative on Thursday, with the Stoxx Europe 50 Index lost 0.16% to 4,309.60 Germany’s DAX stair down 0.21% to 15,977.35, and France’s CAC down 0.54% to 7,197.82, and U.K.’s FTSE 100 pull down 0.19% to 7,537.24.
Benchmark 10-year U.S. Treasury descend as demand for safe assets loose again, today 10-year bond yields rose to 1.65% to 1.753.
Oil prices slipped on Thursday, trimming big gains from the previous two sessions, amid uncertainty over near-term demand as cases of the highly contagious Omicron variant of the coronavirus surge around the globe.
Spot Brent crude oil collected 0.11% to $84.76 per barrel. US West Texas Intermediate crude up to $82.66 a barrel.
The yellow metal gold is fell 0.37% to 1,820.45 dollars per ounce.
Market Wrap: Forex
The dollar was below key support levels on Thursday, having hit new lows overnight, after data showing U.S. consumer prices rose at their fastest rate in nearly 40 years was not deemed worrying enough to change an already hawkish rates outlook.
Today, the U.S. dollar index measures the greenback against a trade-weighted basket of six major currencies, which is dropped 0.16% to 94.760.
The Euro US Dollar (EUR/USD) is a widely traded pair that is gained today. This left the pair trading around $1.14670.
The Japanese yen fell against the U.S. dollar on Thursday as the stock pushes lower. Today US/JPY is down 0.12% at 114.490 level.
Another commodity-related currency gain against the U.S dollar, AUD/USD pulled 0.27% to 0.73040, and NZD/USD gained 0.46% to 0.68760 level.
EUR/USD Intraday: Trend on The Upside
Our pivot point is at 1.14120
Preferable Price Action: Take Long positions above pivot level with targets at 1.14970 & 1.15610 in extension.
Alternative Price Action: Below pivot looks for a further Downside to 1.13270 & 1.12630.
Comment: Pair Above 55MA and RSI above 50 levels.
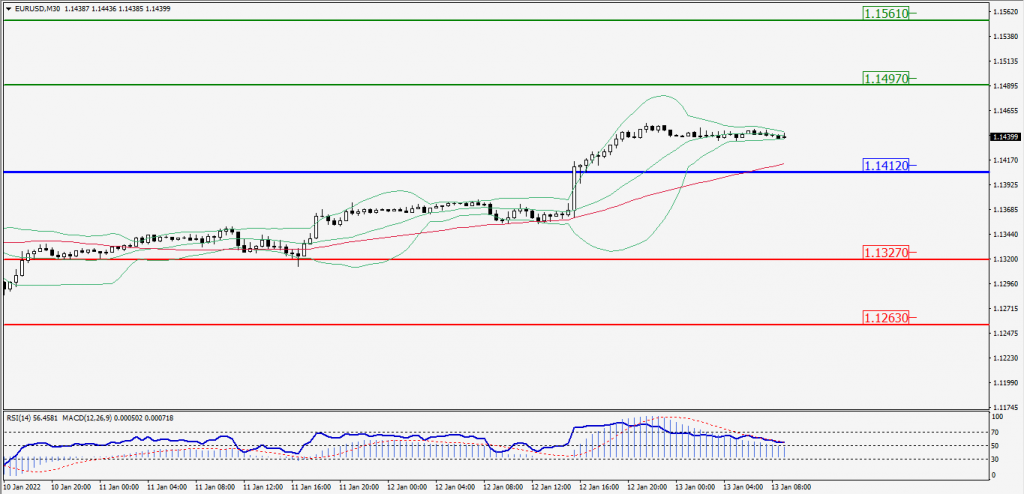
Green Lines Indicate Resistance Levels – Red Lines Indicates Support Levels
Light Blue is a Pivot Point – Black represents the price when the report was produced
GBP/USD Intraday: Support at 1.36810
Our pivot point is at 1.36810
Preferable Price Action: Buy positions Above pivot with targets at 1.37860 & 1.38650 in extension.
Alternative Price Action: The price Below pivot would call for further Downside to 1.35760 & 1.34970.
Comment: Pair Above its 55MA & 20MA and RSI above 50 levels.
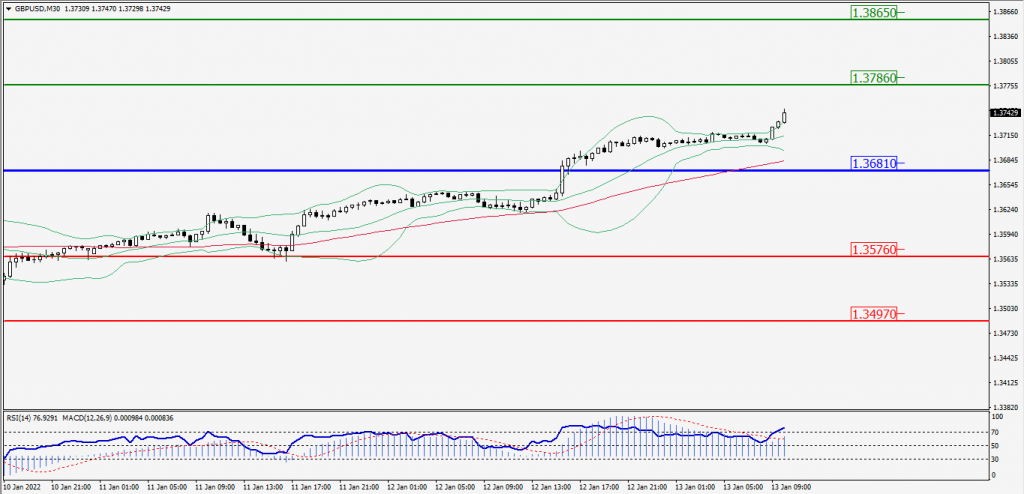
Green Lines Indicate Resistance Levels – Red Lines Indicates Support Levels
Light Blue is a Pivot Point – Black represents the price when the report was produced
USD/JPY Intraday: Trend on the Downside
Our pivot point is at 115.030
Preferable Price Action: Sell position Below pivot with the target at 114.020 and 113.540 in extension.
Alternative Price Action: The Upside breakout of the pivot would call for 115.850 and 116.410.
Comment: Pair Below its 55MA & 20MA and MACD in negative territory.
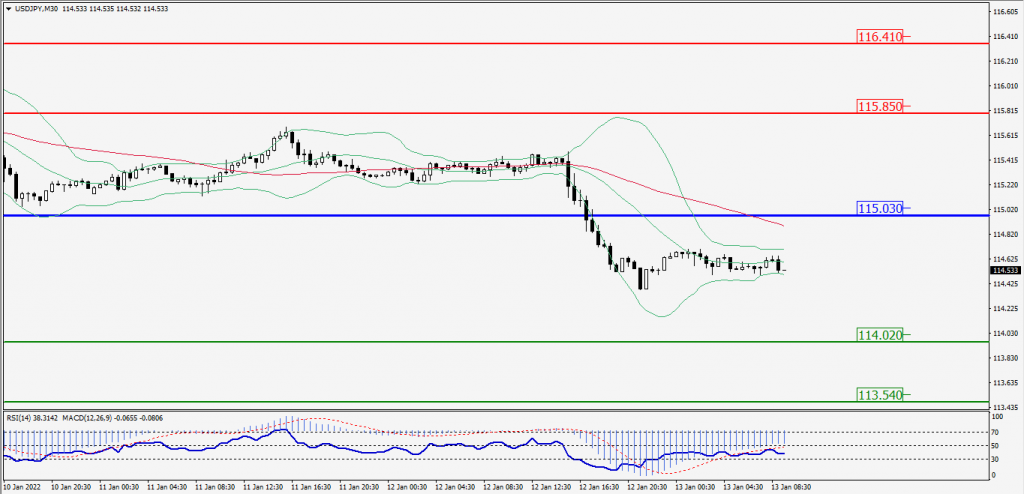
Green Lines Indicate Resistance Levels – Red Lines Indicates Support Levels
Light Blue is a Pivot Point – Black represents the price when the report was produced
AUD/USD Intraday: Major Support at 0.72590
Our pivot point is at 0.72590
Preferable Price Action: Buy Positions Above pivot with targets at 0.73590 & 0.74170 in extension.
Alternative Price Action: Below pivot looks for a further Downside with 0.71720 & 0.71120 as targets.
Comment: Pair above its 55MA 20MA and RSI Above 50 levels.
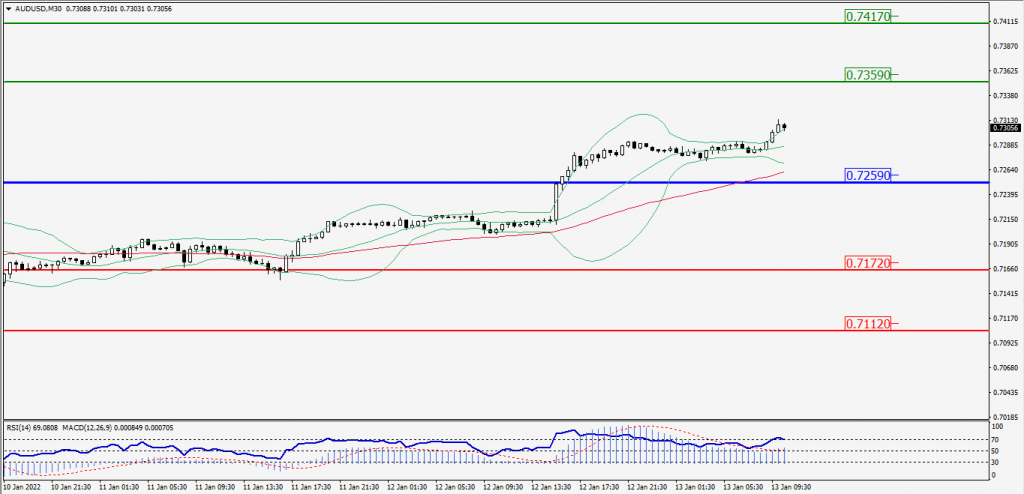
Green Lines Indicate Resistance Levels – Red Lines Indicates Support Levels
Light Blue is a Pivot Point – Black represents the price when the report was produced
CRUDEOIL Intraday: Trend on the Major Upside
Our pivot point is at 81.30
Preferable Price Action: Above pivots Buy Oil with 82.65 & 83.55 as targets.
Alternative Price Action: Sell crude Below pivot with targets at 80.00 and 79.20 in extension.
Comment: Price Below 20MA and MACD is in the negative territory.
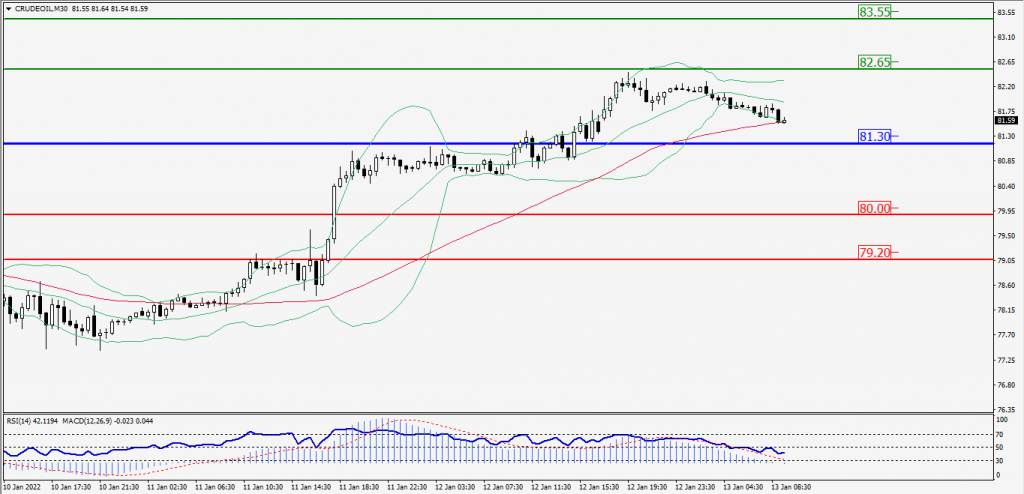
Green Lines Indicate Resistance Levels – Red Lines Indicates Support Levels
Light Blue is a Pivot Point – Black represents the price when the report was produced
XAU/USD Intraday: Trend on the Upside
Our pivot point is 1823.10
Preferable Price Action: Further Upside to 1837.80 and 1846.00.
Alternative Price Action: If the price gives a Downside breakout of a pivot, then the price extends to 1808.20 and 1799.30.
Comment: MACD is in positive territory and the price is above its 55MA & 20MA.
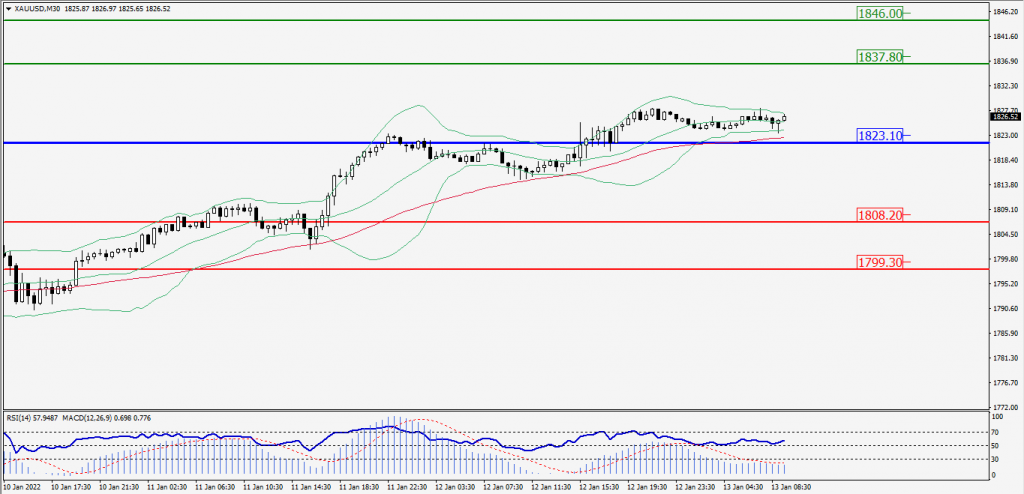
Green Lines Indicate Resistance Levels – Red Lines Indicates Support Levels
Light Blue is a Pivot Point – Black represents the price when the report was produced
Dow Jones Intraday: Resistance at 36,334.00
Our pivot point is 36,334.00
Preferable Price Action: Take Short positions Below pivot with targets at 35,999.00 & 35,773.00.
Alternative Price Action: Above 36,334.00 looks for further Upside to 36,652.00 & 36,858.00.
Comment: RSI Below 50 levels And price is Below its 55MA & 20MA.
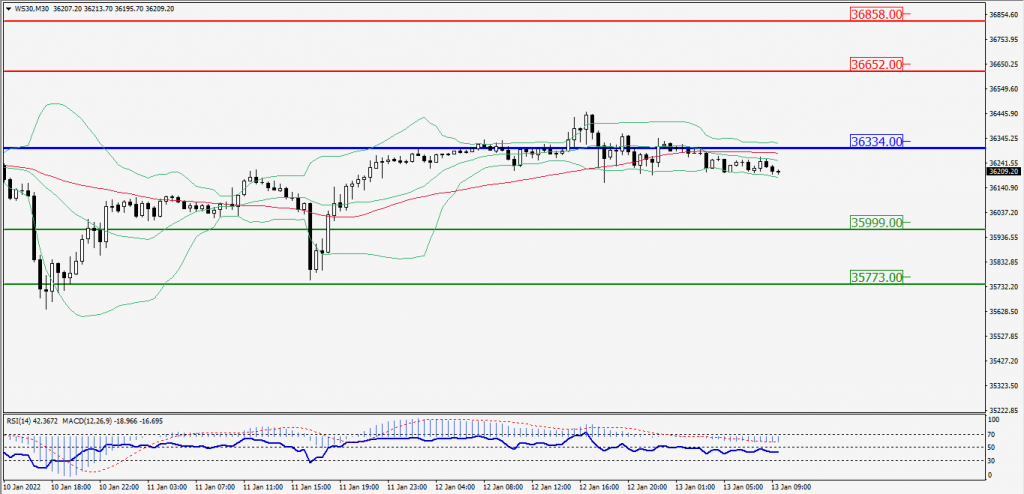
Green Lines Indicate Resistance Levels – Red Lines Indicates Support Levels
Light Blue is a Pivot Point – Black represents the price when the report was produced