Market Wrap: Stocks, Bonds, Commodities
The Nasdaq Composite Index closed above 16,000 points for the first time on Friday, in its second-straight record finish powered by technology stocks, while pandemic jitters sent the Dow to its fourth losing session in the last five. Both the Nasdaq and the S&P 500 index scored a winning week, up 1.2 percent and 0.3 percent, respectively, after last week’s declines snapped a five-week run of higher finishes.
The Dow Jones Industrial Average fell 268.97 points (0.75%) to 35,601.98, the S&P 500 lost 6.58 points (0.14%) at 4,697.96; and the Nasdaq Composite added 63.73 points (0.40%) to 16,057.44.
MSCI’s index of Asia-Pacific stocks outside Japan is fell 0.05% to 815.50 levels. Australian index rise 0.23% to 7,396.50. Japanese Nikkei Index highers 0.50% to 29,745.87.
European stocks were higher on Friday, with the Stoxx Europe 50 Index gaining 0.24% to 4,366.75, Germany’s DAX rose 0.13% to 16,181.09, and France’s CAC advances 0.27% to 7,131.67, and U.K.’s FTSE 100 added 0.29% to 7,244.81.
Benchmark 10-year U.S. Treasury rose as demand for safe assets grows again, today 10-year bond yields gained 0.78% to 1.599.
Crude oil fell to seven-week lows on Monday, extending declines after the previous session’s slide, on concerns about excess supply after Japan said it was weighing releasing oil reserves and over demand from a worsening COVID-19 situation in Europe.
Spot Brent crude oil rose 0.95% to $82.00 per barrel. US West Texas Intermediate crude gained 0.92% to $79.14 a barrel.
The yellow metal traded slipped 0.12% to 1859.35 dollars per ounce.
Market Wrap: Forex
The safe-haven U.S. dollar traded close to a 16-month high to the euro on Monday on growing anxiety over the impact of surging COVID-19 infections in Europe, with Austria reimposing a full lockdown and Germany considering following suit.
Today, the U.S. dollar index measures the greenback against a trade-weighted basket of six major currencies, which rose 0.19% to 95.722.
The Euro US Dollar (EUR/USD) is a widely traded pair that is falling 0.26% today. This left the pairing trading around $1.13400.
The Japanese yen fell against the U.S. dollar on Friday as the stock pushes higher. Today US/JPY is gained 0.10% to 114.340 level.
Another commodity-related currency gained against the U.S dollar, AUD/USD advanced 0.07% to 0.72840, and NZD/USD flat to 0.70310 level.
EUR/USD Intraday: Trend on the downside
Our pivot point is at 1.12940
Preferable Price Action: Take Short positions Below pivot level with targets at 1.12460 & 1.12180 in extension.
Alternative Price Action: Above pivot looks for a further Upside to 1.13460 & 1.13730.
Comment: Pair below its 55MA & 20MA and RSI below 50 levels.
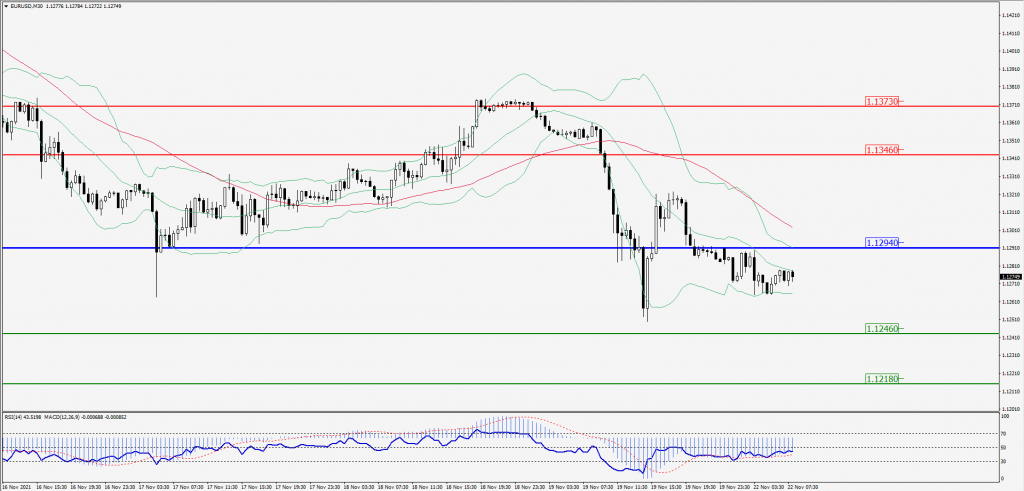
Green Lines Indicate Resistance Levels – Red Lines Indicates Support Levels
Light Blue is a Pivot Point – Black represents the price when the report was produced
GBP/USD Intraday: Resistance at 1.34620
Our pivot point is at 1.34620
Preferable Price Action: Sell positions below pivot with targets at 1.34170 & 1.33890 in extension.
Alternative Price Action: The price above pivot would call for further upside to 1.35080 & 1.35360.
Comment: Pair below its 55MA and RSI below 50 levels.
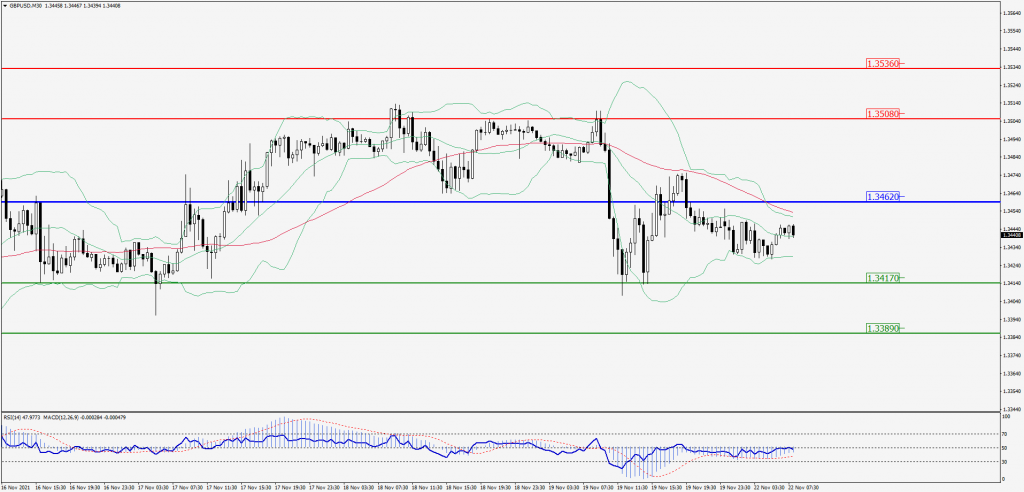
Green Lines Indicate Resistance Levels – Red Lines Indicates Support Levels
Light Blue is a Pivot Point – Black represents the price when the report was produced
USD/JPY Intraday: Support at 113.990
Our pivot point is at 113.990
Preferable Price Action: Buy position Above pivot with the target at 114.520 and 114.800 in extension.
Alternative Price Action: The Downside breakout of the pivot would call for 113.560 and 113.310.
Comment: Price above its 55MA & 20MA and MACD in positive territory.
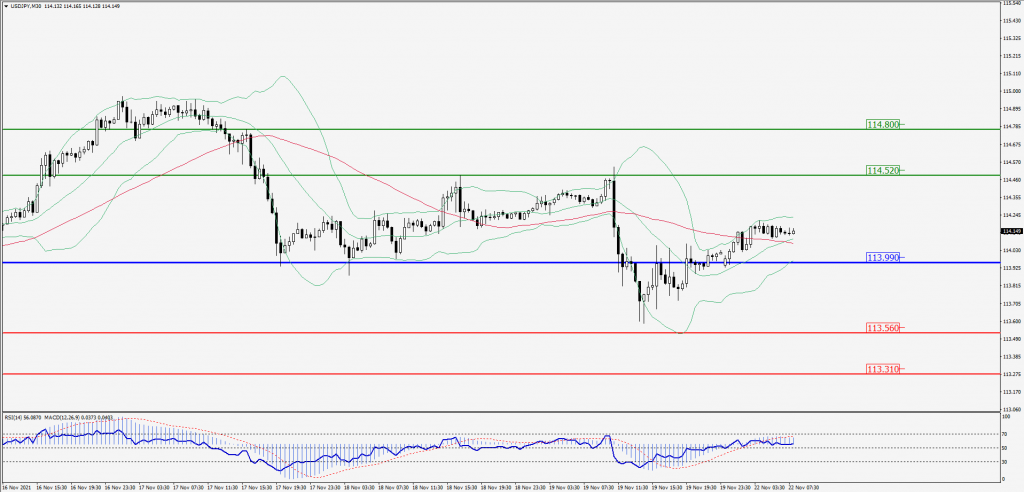
Green Lines Indicate Resistance Levels – Red Lines Indicates Support Levels
Light Blue is a Pivot Point – Black represents the price when the report was produced
AUD/USD Intraday: Support at 0.72380
Our pivot point is at 0.72380
Preferable Price Action: Buy Positions above pivot with targets at 0.72840 & 0.73090 in extension.
Alternative Price Action: Below pivot looks for a further Downside with 0.71990 & 0.71760 as targets.
Comment: Pair above its 55MA & 20MA and RSI above 50 levels.
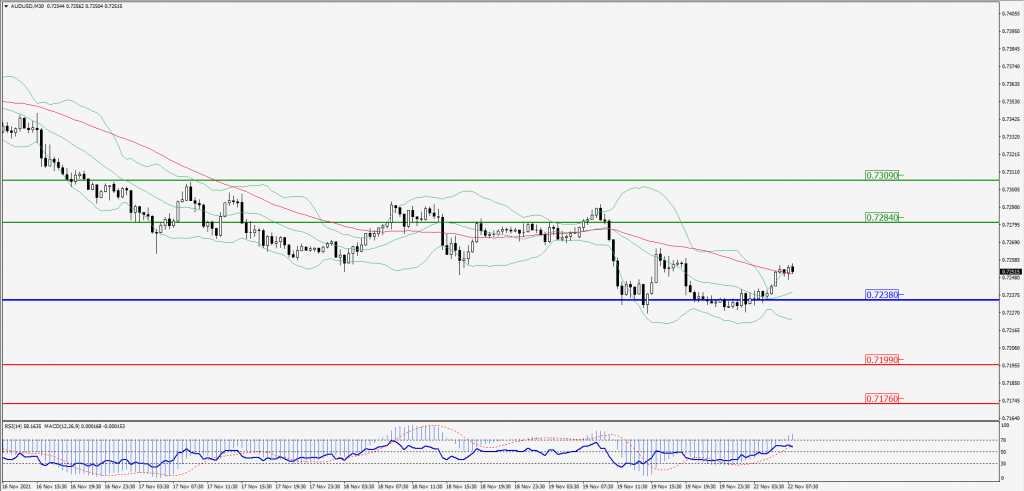
Green Lines Indicate Resistance Levels – Red Lines Indicates Support Levels
Light Blue is a Pivot Point – Black represents the price when the report was produced
CRUDEOIL Intraday: Resistance level at 76.80
Our pivot point is at 76.80
Preferable Price Action: Below pivots Sell Oil with 75.10 & 74.40 as targets.
Alternative Price Action: Buy crude Above pivot with targets at 78.40 and 79.30 in extension.
Comment: Crude is below its 55MA and MACD in the negative territory.
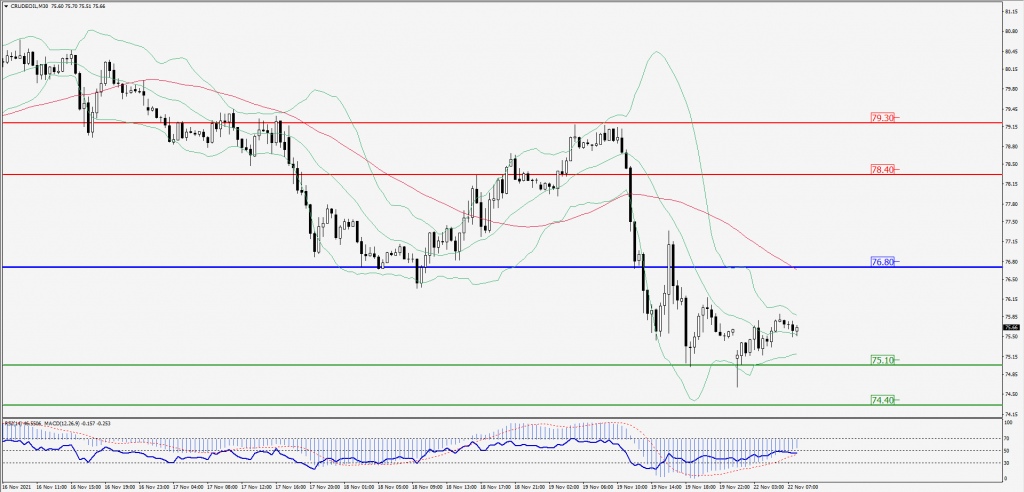
Green Lines Indicate Resistance Levels – Red Lines Indicates Support Levels
Light Blue is a Pivot Point – Black represents the price when the report was produced
XAU/USD Intraday: Trend on the downside
Our pivot point is 1851.60
Preferable Price Action: Further downside to 1839.10 and 1832.90.
Alternative Price Action: If the price gives an upside breakout of a pivot, then the price extends to 1864.50 and 1871.20.
Comment: MACD in negative territory and price below its 20MA.
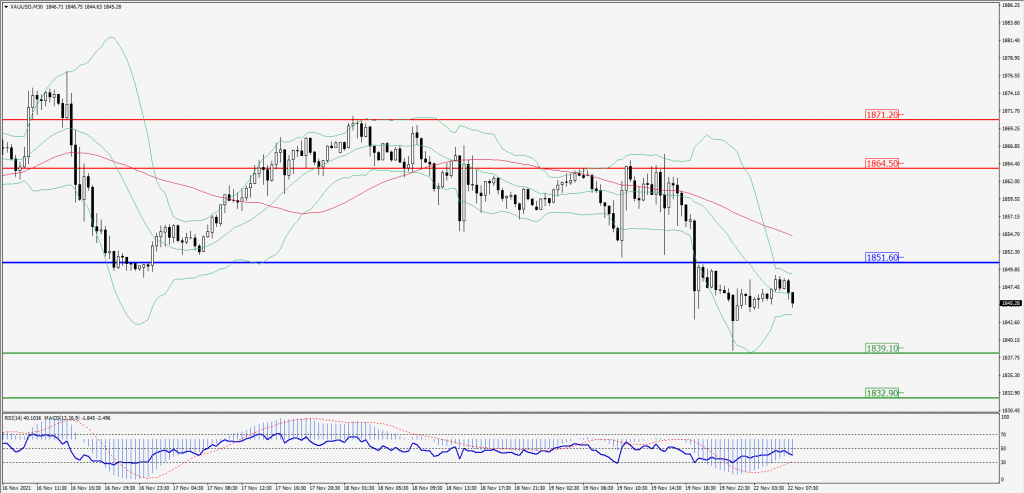
Green Lines Indicate Resistance Levels – Red Lines Indicates Support Levels
Light Blue is a Pivot Point – Black represents the price when the report was produced
Dow Jones Intraday: Resistance at 35,824.00
Our pivot point is 35,824.00
Preferable Price Action: Take Short positions below pivot with targets at 35,554.00 & 35,401.00.
Alternative Price Action: Above 35,824.00 looks for further upside to 36,113.00 & 36,284.00.
Comment: Price below its 55MA and RSI above 50 levels.
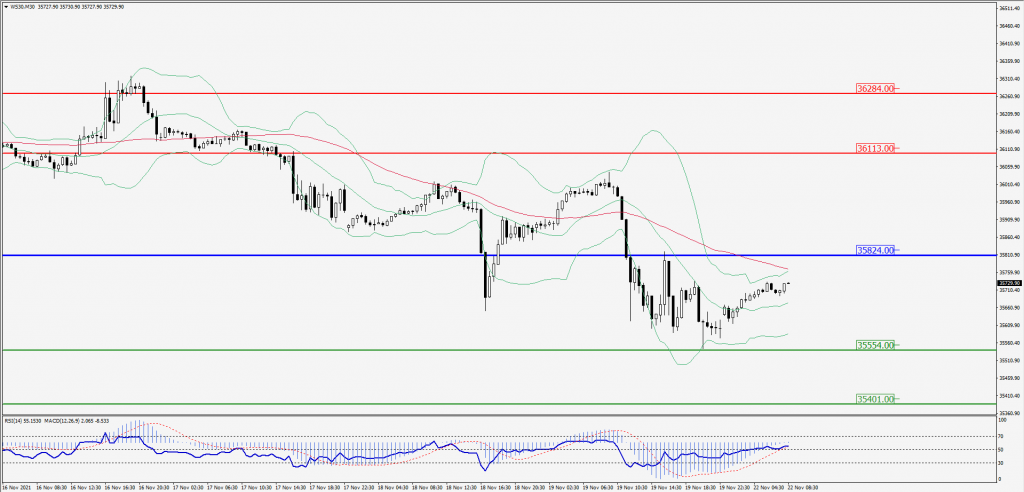
Green Lines Indicate Resistance Levels – Red Lines Indicates Support Levels
Light Blue is a Pivot Point – Black represents the price when the report was produced