Market Wrap: Stocks, Bonds, Commodities
Major Wall Street indexes posted solid gains and marked closing record highs as the Federal Reserve said it will begin trimming its monthly bond purchases in November with plans to end them in 2022, an announcement that investors had been expecting.
The Dow Jones Industrial Average rose 104.95 points (0.29%) to 36,157.58, the S&P 500 gained 29.92 points (0.65%) to 4,660.57 and the Nasdaq Composite added 162.00points (1.04%) to 15,811.60
MSCI’s index of Asia-Pacific stocks outside Japan is rose 0.20% to 810.20 levels. Australian index gained 0.48% to 7,428.00. Japanese Nikkei Index rose 0.93% to 29,794.37.
European stocks were higher on Thursday, with the Stoxx Europe 50 Index flat to 4,294.30, Germany’s DAX down 0.10% to 15,940.85, and France’s CAC fell 0.05% to 6,923.91, and U.K.’s FTSE 100 down 0.19% to 7,2361.15.
Benchmark 10-year U.S. Treasury rose as demand for safe assets grows again, today 10-year bond yields rose 1.22% to 1.598.
Oil declined for a third day as investors turned their focus to an OPEC+ meeting on production policy after U.S. crude stockpiles expanded.
Spot Brent crude oil fell 0.76% to $81.38 per barrel. US West Texas Intermediate crude slipped 1.10% to $79.97 a barrel.
The yellow metal traded 0.54% higher to 1773.15 dollars per ounce.
Market Wrap: Forex
The dollar eased on Wednesday after the U.S. Federal Reserve said it would begin unwinding its pandemic-era stimulus, but held to its belief that high inflation would prove “transitory” and likely not require a rapid rise in interest rates.
Today, the U.S. dollar index measures the greenback against a trade-weighted basket of six major currencies, which rose 0.22% to 94.065.
The Euro US Dollar (EUR/USD) is a widely traded pair that is falling 0.23% today. This left the pairing trading around $1.15820.
The Japanese yen fell against the U.S. dollar on Thursday as the stock pushes higher. Today US/JPY is advanced 0.18% to 114.190 level.
Another commodity-related currency lower against the U.S dollar, AUD/USD slipped 0.14% to 0.74340, and NZD/USD fell 0.22% to 0.71420 level.
EUR/USD Intraday: Trend on the upside
Our pivot point is at 1.15760
Preferable Price Action: Take long positions above pivot level with targets at 1.16400 & 1.16800 in extension.
Alternative Price Action: Below pivot looks for a further downside to 1.15250 & 1.14900.
Comment: Pair above its 55MA & 20MA and RSI above 50 levels.
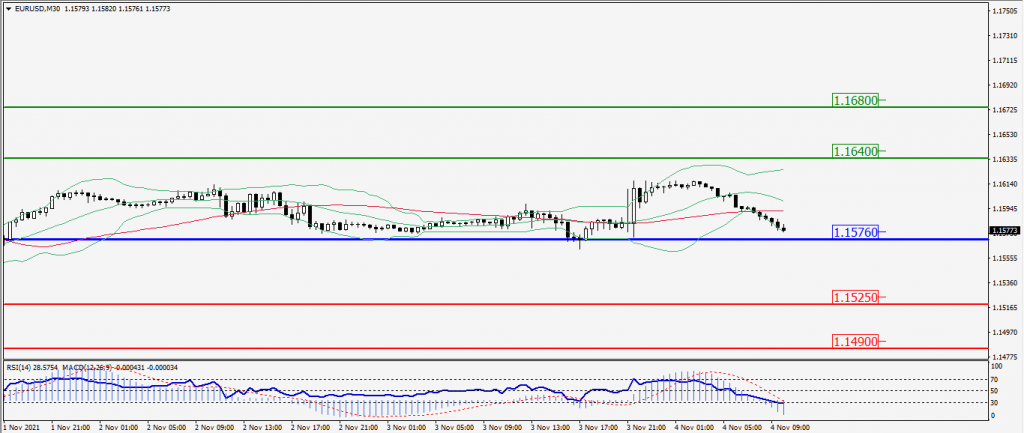
Green Lines Indicate Resistance Levels – Red Lines Indicates Support Levels
Light Blue is a Pivot Point – Black represents the price when the report was produced
GBP/USD Intraday: Resistance at 1.37050
Our pivot point is at 1.36950
Preferable Price Action: Sell positions below pivot with targets at 1.36150 & 1.35700 in extension.
Alternative Price Action: The price above pivot would call for further upside to 1.37840 & 1.38210.
Comment: Pair below its 50MA & 20MA and RSI below 50 levels.
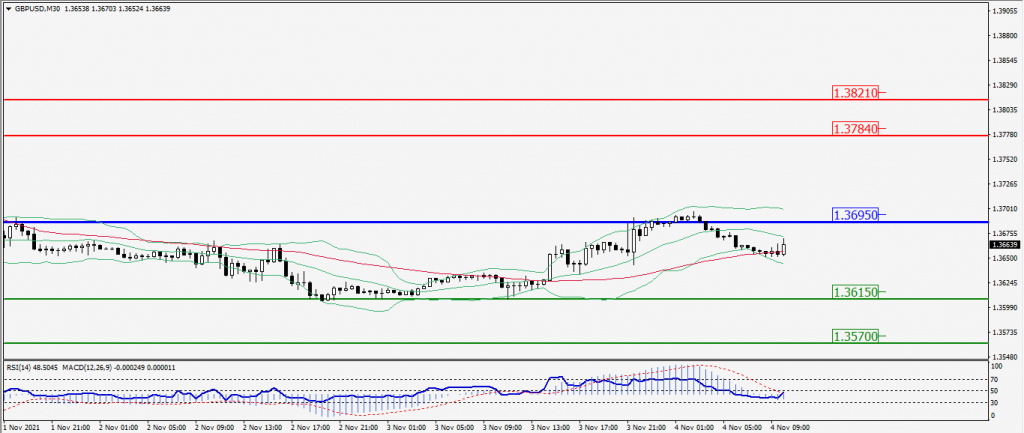
Green Lines Indicate Resistance Levels – Red Lines Indicates Support Levels
Light Blue is a Pivot Point – Black represents the price when the report was produced
USD/JPY Intraday: Resistance at 114.060
Our pivot point is at 113.980
Preferable Price Action: Buy position above pivot with the target at 114.610 and 114.850 in extension.
Alternative Price Action: The downside breakout of the pivot would call for 113.370 and 112.980.
Comment: Price below its 55MA & 20MA and MACD in negative territory.
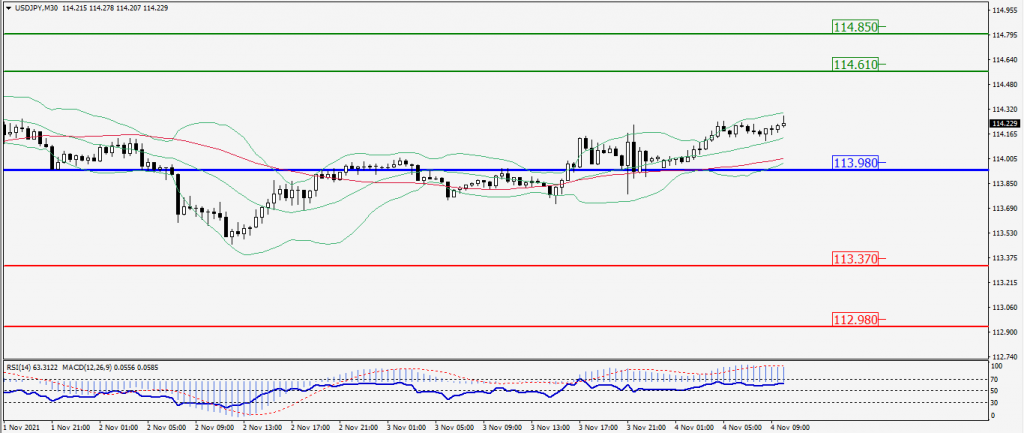
Green Lines Indicate Resistance Levels – Red Lines Indicates Support Levels
Light Blue is a Pivot Point – Black represents the price when the report was produced
AUD/USD Intraday: Break support level
Our pivot point is at 0.74940
Preferable Price Action: Sell Positions below pivot with targets at 0.74080 & 0.73570 in extension.
Alternative Price Action: Above pivot looks for a further upside with 0.75800 & 0.76270 as targets.
Comment: Pair below its 55MA & 20MA and RSI below 50 levels.
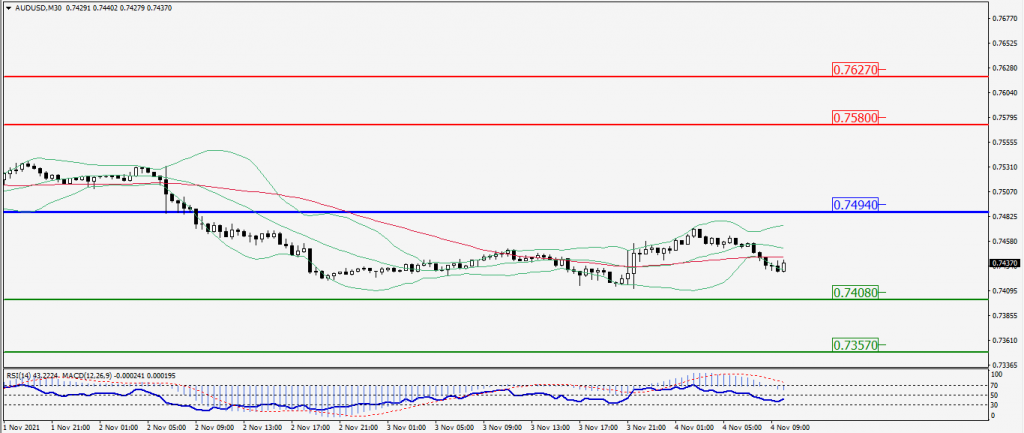
Green Lines Indicate Resistance Levels – Red Lines Indicates Support Levels
Light Blue is a Pivot Point – Black represents the price when the report was produced
CRUDEOIL Intraday: Trend on the downside
Our pivot point is at 81.10
Preferable Price Action: Below pivots sell Oil with 77.80 & 76.30 as targets.
Alternative Price Action: Buy crude above pivot with targets at 84.70 and 86.30 in extension.
Comment: Crude is above its 55MA & 20MA and MACD in the positive territory.
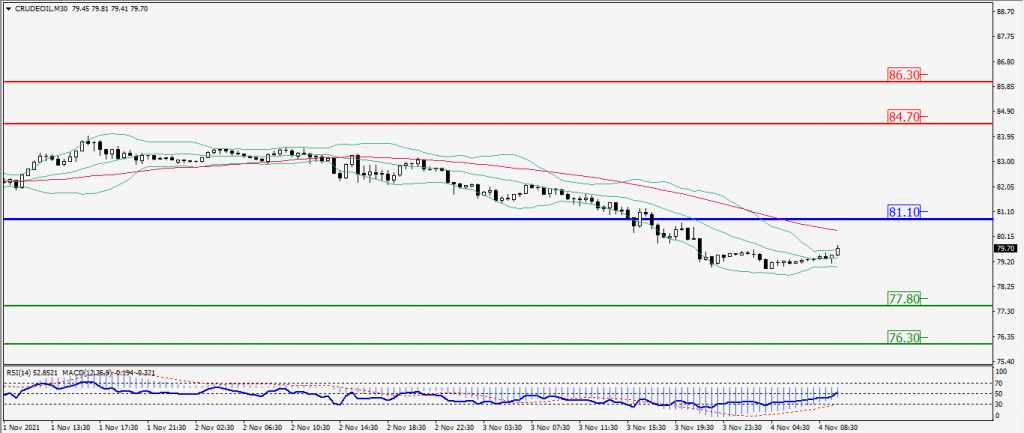
Green Lines Indicate Resistance Levels – Red Lines Indicates Support Levels
Light Blue is a Pivot Point – Black represents the price when the report was produced
XAU/USD Intraday: Trend on the downside
Our pivot point is 1783.10
Preferable Price Action: Further Downside to 1761.80 and 1749.90
Alternative Price Action: If the price gives an Upside breakout of a pivot, then the price extends to 1803.70 and 1815.10.
Comment: MACD in flat territory and price above its 55MA.
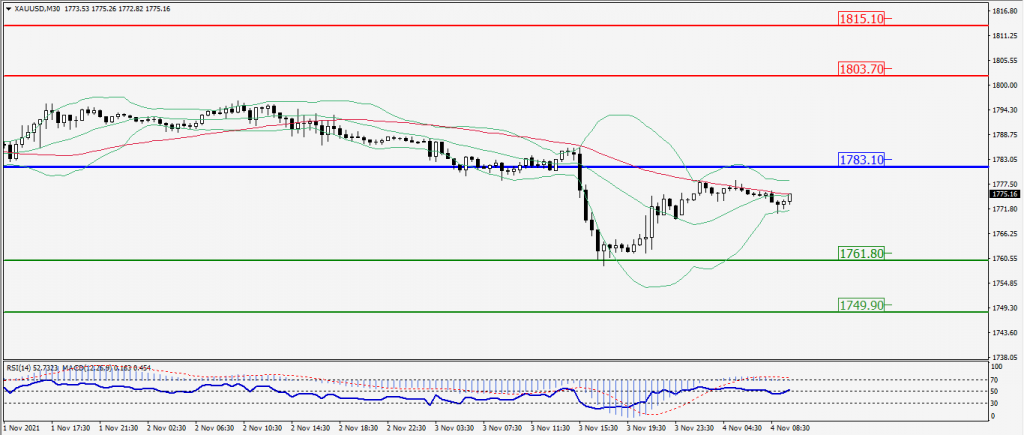
Green Lines Indicate Resistance Levels – Red Lines Indicates Support Levels
Light Blue is a Pivot Point – Black represents the price when the report was produced
Dow Jones Intraday: Support at 35,920.00
Our pivot point is 36,050.00
Preferable Price Action: Take long positions above pivot with targets at 36274.00 & 36,386.00.
Alternative Price Action: Below 35,790.00 looks for further downside to 35,819.00 & 35,679.00.
Comment: Price above its 55MA and RSI above 50 levels.
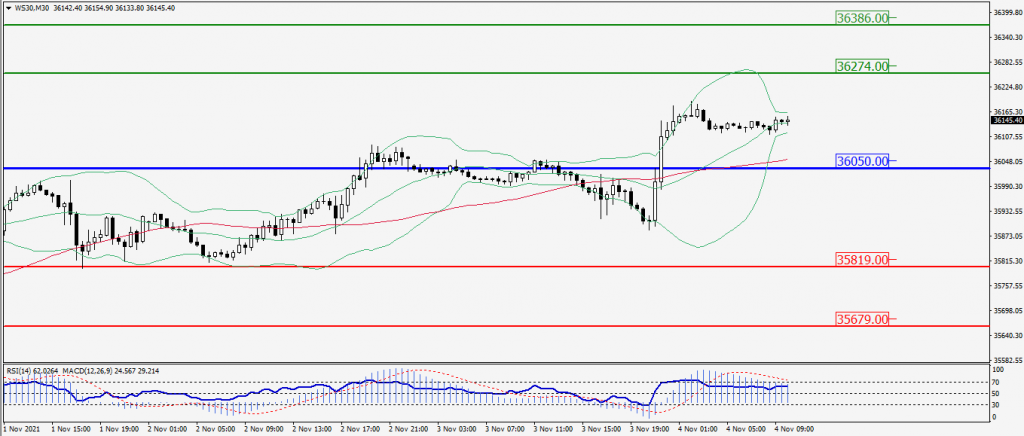
Green Lines Indicate Resistance Levels – Red Lines Indicates Support Levels
Light Blue is a Pivot Point – Black represents the price when the report was produced