Market Wrap: Stocks, Bonds, Commodities
American major stock indices were higher on Friday, boosted by an expectation of good earning in the second quarter, positive economic data, progress in the battle against COVID-19.
The Dow Jones Industrial Average advance 482.54 points (1.43%) to 34,326.46; the S&P 500 jumped 49.5 points (1.15%) at 4,357.04; and the Nasdaq Composite increase 118.12 points (0.82%) at 14,566.70.
Asian stocks slipped on Monday as problems in China’s property market and inflation worries offset upbeat U.S. data. The Chinese market was closed today.
MSCI’s index of Asia-Pacific stocks outside Japan fell 0.60% to 790.34 levels. Australian index rose 1.29% to 7,278.50. Japanese Nikkei Index plunged 1.13% to 28,444.89.
European stocks were lower on Monday, with the Stoxx Europe 50 Index fell 0.95% to 3,997.91, Germany’s DAX down 0.69% to 15,050.15, and France’s CAC lost 0.86% to 6,462.77, and U.K.’s FTSE 100 slipped 0.21% to 7,013.95.
Benchmark 10-year U.S. Treasury rose as demand for safe assets grows again, today 10-year bond yields rose 0.81% to 1.479.
Crude Oil prices decline ahead of an OPEC+ meeting on Monday to discuss production parameters amid a rapidly tightening market over increases of demand.
Spot Brent crude oil slipped 0.54% to $78.85 per barrel. US West Texas Intermediate crude lost 0.61% to $75.42 a barrel.
The yellow metal traded 0.05% higher to 1759.10 dollars per ounce.
Market Wrap: Forex
The US dollar index gained on Monday as issues about China’s property market and looming U.S. labour data put traders in a cautious mood.
Today, the U.S. dollar index measures the greenback against a trade-weighted basket of six major currencies, which fell 0.07% to 93.977.
The Euro US Dollar (EUR/USD) is a widely traded pair that is rose 0.13% today. This left the pairing trading around $1.16070.
The Japanese yen rose against the U.S. dollar on Monday as the stock pushes higher. Today US/JPY is down 0.06% to 110.970 level.
Another commodity-related currency higher against the U.S dollar, AUD/USD rose 0.15% to 0.72660, and NZD/USD flat to 0.69410 level.
EUR/USD Intraday: Support at 1.15920
Our pivot point is at 1.15920
Preferable Price Action: Take long positions above pivot level with targets at 1.16300 & 1.16530 in extension.
Alternative Price Action: below pivot looks for a further downside to 1.15540 & 1.15310.
Comment: Pair above its 55MA & 20MA and RSI above 50 levels.
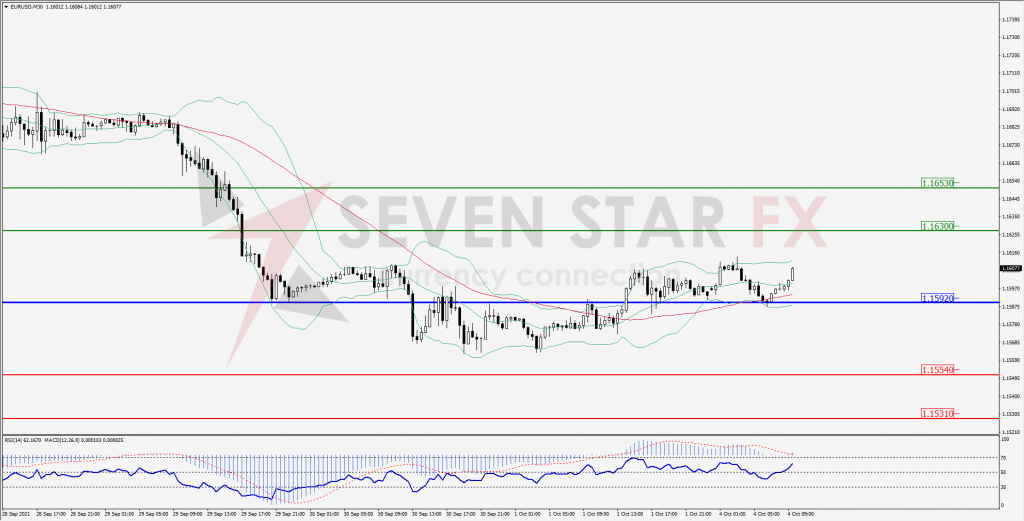
Green Lines Indicate Resistance Levels – Red Lines Indicates Support Levels
Light Blue is a Pivot Point – Black represents the price when the report was produced
GBP/USD Intraday: Break Resistance level
Our pivot point is at 1.35030
Preferable Price Action: Buy positions above pivot with targets at 1.36070 & 1.36530 in extension.
Alternative Price Action: The price below pivot would call for further downside to 1.34090 & 1.33580.
Comment: Pair above its 55MA & 20MA and RSI above 50 levels.
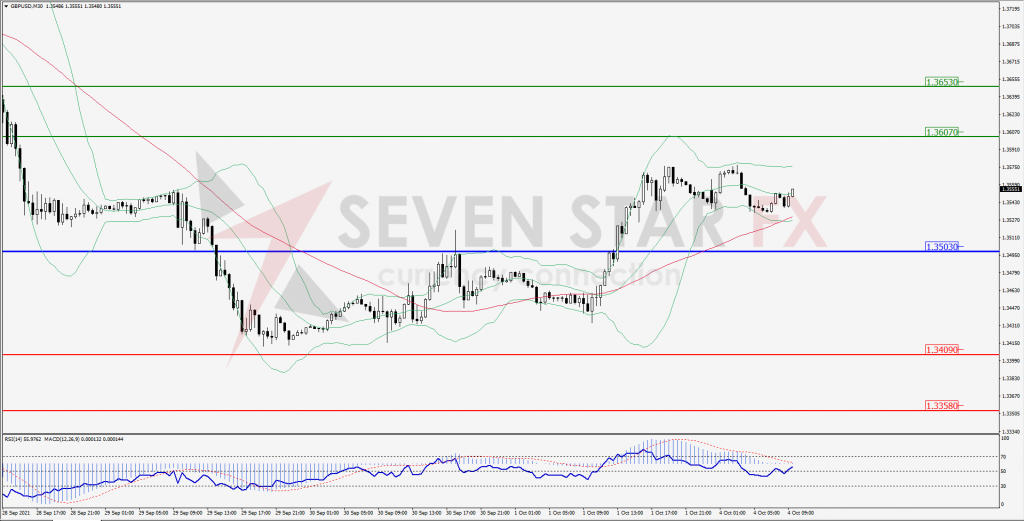
Green Lines Indicate Resistance Levels – Red Lines Indicates Support Levels
Light Blue is a Pivot Point – Black represents the price when the report was produced
USD/JPY Intraday: Resistance level at 111.210
Our pivot point is at 111.210
Preferable Price Action: Sell position below pivot with the target at 110.770 and 110.510 in extension.
Alternative Price Action: The upside breakout of the pivot would call for 111.660 and 111.920.
Comment: Price below its 55MA & 20MA and MACD in negative territory.
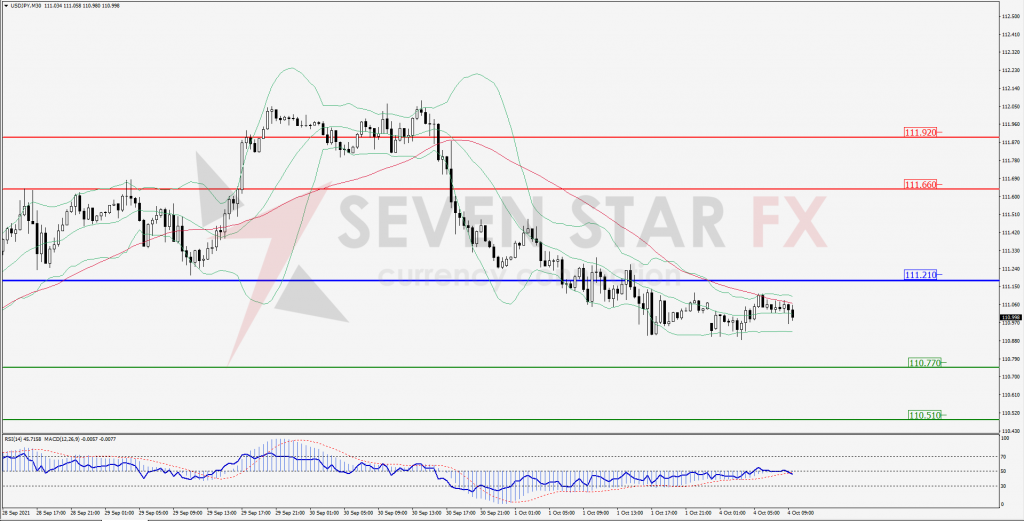
Green Lines Indicate Resistance Levels – Red Lines Indicates Support Levels
Light Blue is a Pivot Point – Black represents the price when the report was produced
AUD/USD Intraday: Support at 0.72450
Our pivot point is at 0.72450
Preferable Price Action: Buy Positions below pivot with targets at 0.72890 & 0.73080 in extension.
Alternative Price Action: Below pivot looks for a further downside with 0.72030 & 0.71830 as targets.
Comment: Pair above its 55MA and RSI at 50 levels.
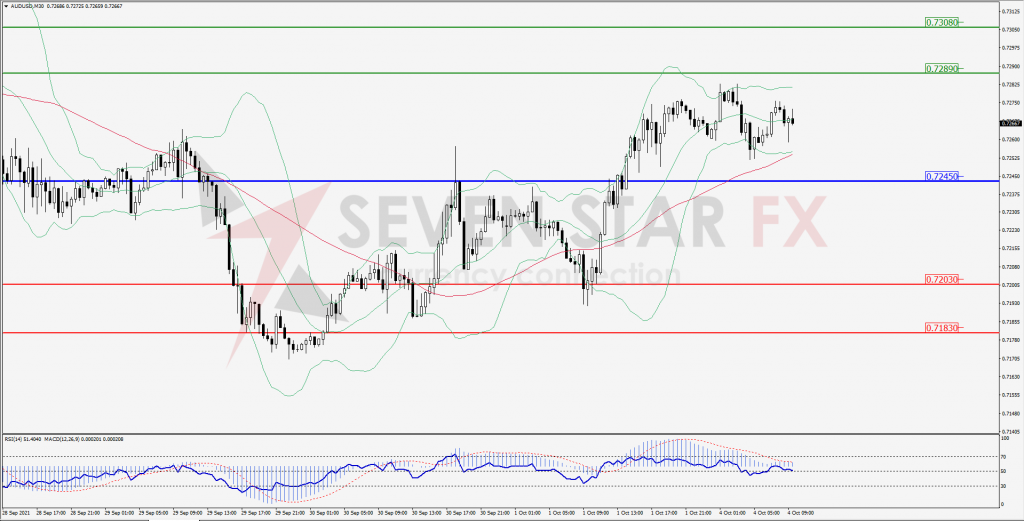
Green Lines Indicate Resistance Levels – Red Lines Indicates Support Levels
Light Blue is a Pivot Point – Black represents the price when the report was produced
CRUDEOIL Intraday: In a consolidation zone
Our pivot point is at 74.62
Preferable Price Action: Above pivots buy Oil with 76.12 & 76.90 as targets.
Alternative Price Action: Sell crude below pivot with targets at 73.20 and 72.39 in extension.
Comment: Crude is above its 55MA and MACD in the positive territory.
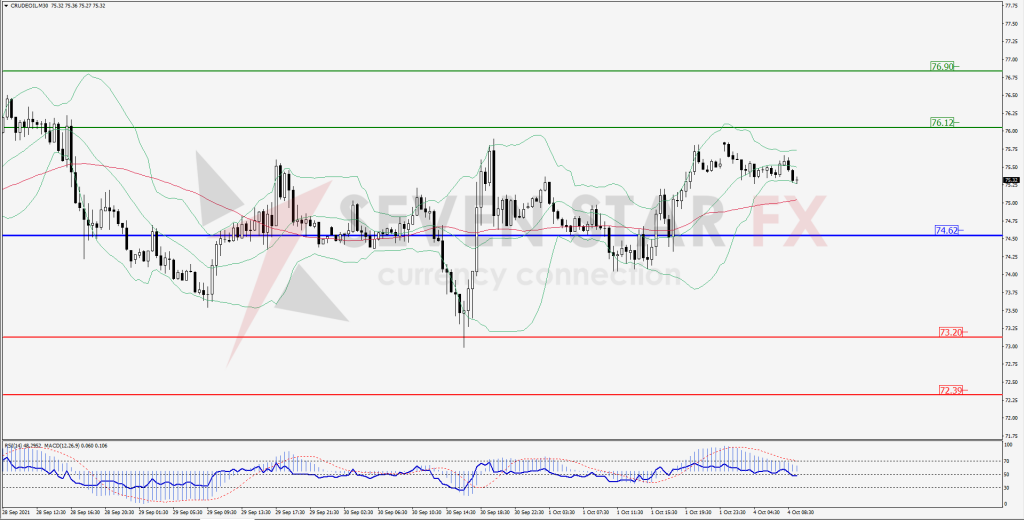
Green Lines Indicate Resistance Levels – Red Lines Indicates Support Levels
Light Blue is a Pivot Point – Black represents the price when the report was produced
XAU/USD Intraday: Trend on the upside
Our pivot point is 1749.80
Preferable Price Action: Further upside to 1766.80 and 1774.30
Alternative Price Action: If the price gives a downside breakout of a pivot, then the price extends to 1733.20 and 1725.70.
Comment: MACD in positive territory and price below its 20MA & 55MA.
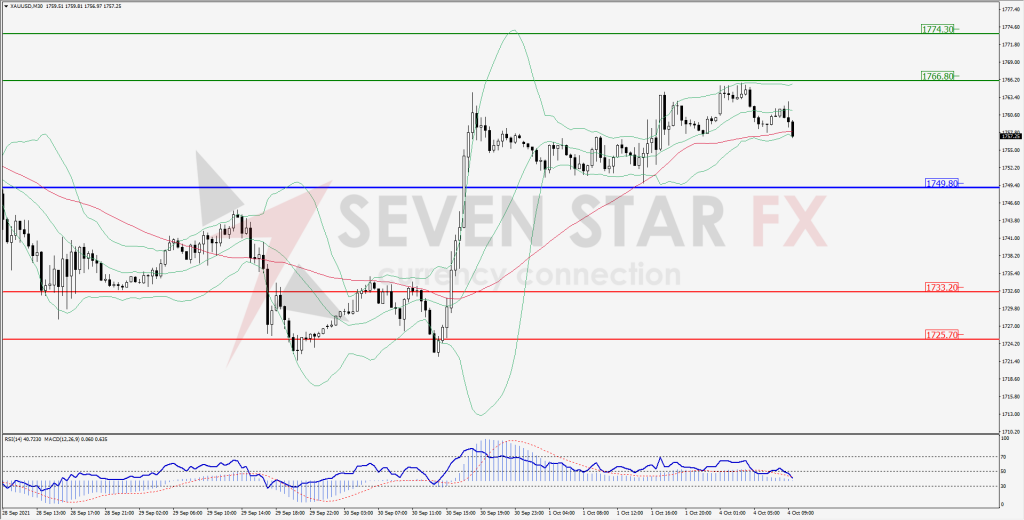
Green Lines Indicate Resistance Levels – Red Lines Indicates Support Levels
Light Blue is a Pivot Point – Black represents the price when the report was produced
Dow Jones Intraday: Trend may change to upside
Our pivot point is 34,001.00
Preferable Price Action: Take long positions above pivot with targets at 34,589.00 & 34,842.00.
Alternative Price Action: below 34,001.00 looks for further downside to 33,418.00 & 33,174.00.
Comment: Price above its 55MA & 55MA and RSI at 50 levels.
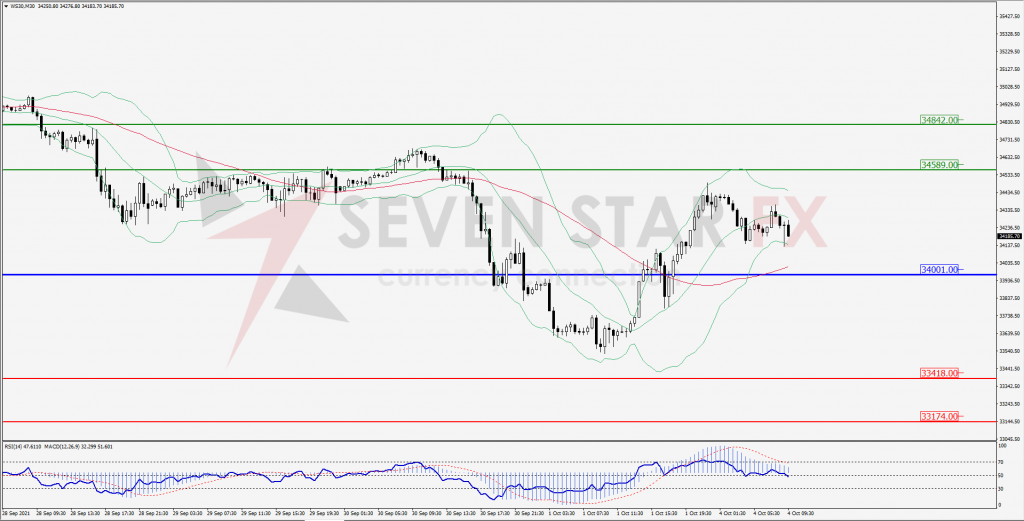
Green Lines Indicate Resistance Levels – Red Lines Indicates Support Levels
Light Blue is a Pivot Point – Black represents the price when the report was produced