Market Wrap: Stocks, Bonds, Commodities
American major indices ended lower on Thursday and the S&P 500 index posted its worst month since the coronavirus crisis.
The Dow Jones Industrial Average lost 546.8 points (1.59%) to 33,843.92, the S&P 500 slipped 51.92 points (1.19%) to 4,307.54 and the Nasdaq Composite plunged 63.86 points (0.44%) to 14,448.58.
Asian shares found some calm on Thursday following this week’s heavy China-driven losses although the dollar sat at a more than one-year high against major peers, upheld by lingering safe-haven demand and expectations for tighter U.S. monetary policy.
MSCI’s index of Asia-Pacific stocks outside Japan fell 0.69% to 795.62 levels. Australian index plunged 2.00% to 7,185.50. Japanese Nikkei Index lost 2.31% to 28,771.10.
European stocks were lower on Friday, with the Stoxx Europe 50 Index fell 0.75% to 4,018.35, Germany’s DAX down 0.84% to 15,135.55, and France’s CAC lost 0.66% to 6,476.43, and U.K.’s FTSE 100 slipped 0.60% to 7,043.50.
Benchmark 10-year U.S. Treasury rose as demand for safe assets grows again, today 10-year bond yields lost 1.57% to 1.503.
Crude Oil were slipped on Thursday as reports China ready to buy more oil and other energy supplies to meet growing demand offset price pressure from an unexpected rise in US crude inventories and a strong dollar.
Spot Brent crude oil slipped 0.46% to $77.95 per barrel. US West Texas Intermediate crude lost 0.52% to $74.64 a barrel.
The yellow metal traded lower 0.26% to 1752.40 dollars per ounce.
Market Wrap: Forex
The US dollar index is set to end the monthly higher on Thursday, positive headwinds including expectations for Treasury yields to continue their advance into year-end as the Federal Reserve chair Powell prepares to tighten monetary policy.
Today, the U.S. dollar index measures the greenback against a trade-weighted basket of six major currencies, which rose 0.10% to 94.325.
The Euro US Dollar (EUR/USD) is a widely traded pair that is fell 0.05% today. This left the pairing trading around $1.15750.
The Japanese yen rose against the U.S. dollar on Thursday as the stock pushes higher. Today US/JPY is down 0.06% to 111.920 level.
Another commodity-related currency lower against the U.S dollar, AUD/USD declined 0.19% to 0.72100, and NZD/USD down 0.17% to 0.68830 level.
EUR/USD Intraday: Trend on the downside
Our pivot point is at 1.16080
Preferable Price Action: Take short positions below pivot level with targets at 1.15610 & 1.15320 in extension.
Alternative Price Action: above pivot looks for a further upside to 1.16620 & 1.16890.
Comment: Pair below its 55MA and RSI at 50 levels.
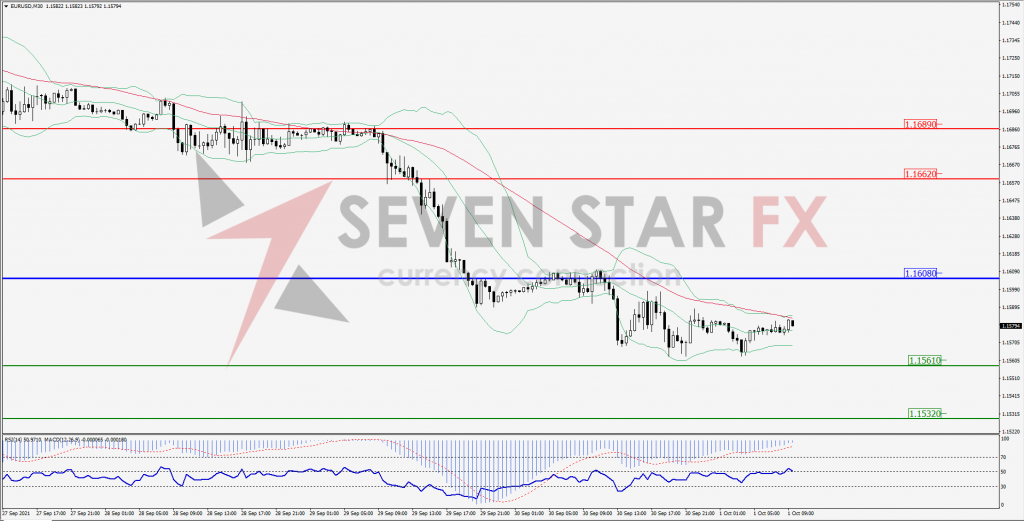
Green Lines Indicate Resistance Levels – Red Lines Indicates Support Levels
Light Blue is a Pivot Point – Black represents the price when the report was produced
GBP/USD Intraday: Resistance at 1.35070
Our pivot point is at 1.35070
Preferable Price Action: Sell positions below pivot with targets at 1.33930 & 1.33290 in extension.
Alternative Price Action: The price above pivot would call for further upside to 1.36200 & 1.36830.
Comment: Pair below its 55MA & 20MA and RSI below 50 levels.
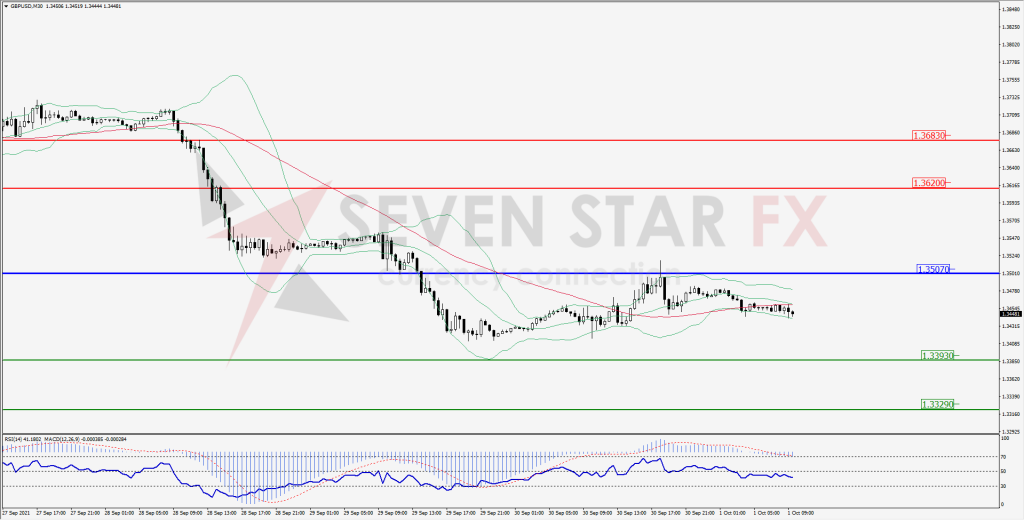
Green Lines Indicate Resistance Levels – Red Lines Indicates Support Levels
Light Blue is a Pivot Point – Black represents the price when the report was produced
USD/JPY Intraday: Resistance level at 111.470
Our pivot point is at 111.470
Preferable Price Action: Sell position below pivot with the target at 110.820 and 110.520 in extension.
Alternative Price Action: The upside breakout of the pivot would call for 112.120 and 112.430.
Comment: Price below its 55MA & 20MA and MACD in negative territory.
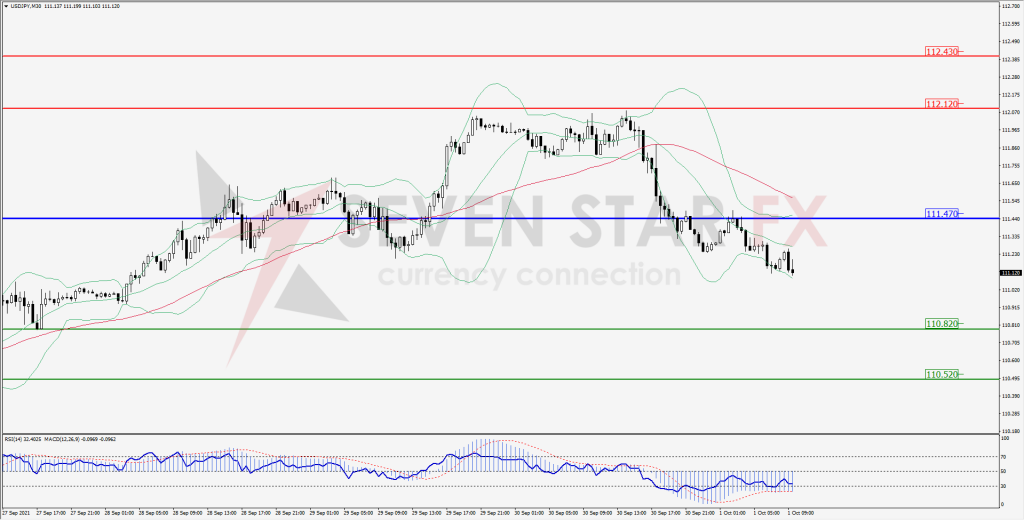
Green Lines Indicate Resistance Levels – Red Lines Indicates Support Levels
Light Blue is a Pivot Point – Black represents the price when the report was produced
AUD/USD Intraday: Resistance at 0.72280
Our pivot point is at 0.72280
Preferable Price Action: Sell Positions below pivot with targets at 0.71750 & 0.71470 in extension.
Alternative Price Action: Above pivot looks for a further upside with 0.72790 & 0.72070 as targets.
Comment: Pair below its 55MA and RSI below 50 levels.
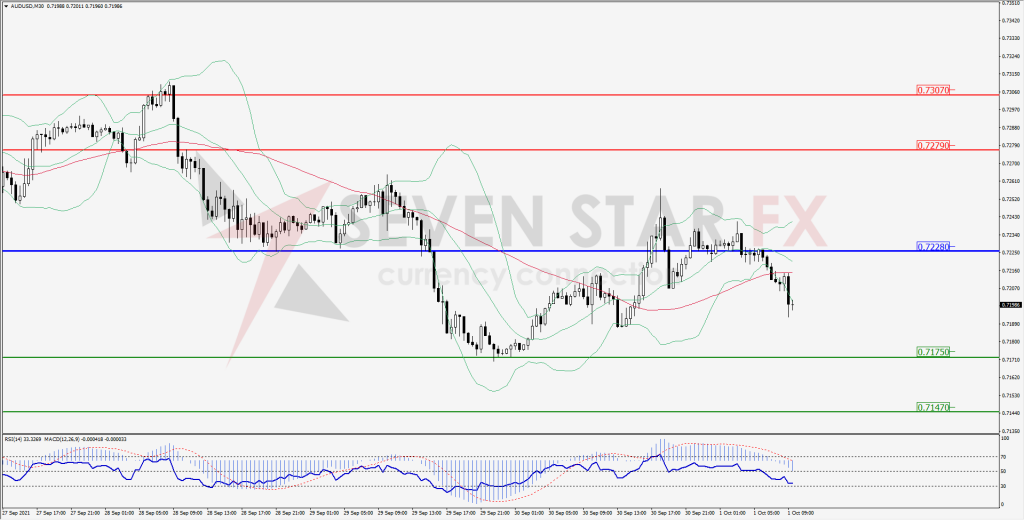
Green Lines Indicate Resistance Levels – Red Lines Indicates Support Levels
Light Blue is a Pivot Point – Black represents the price when the report was produced
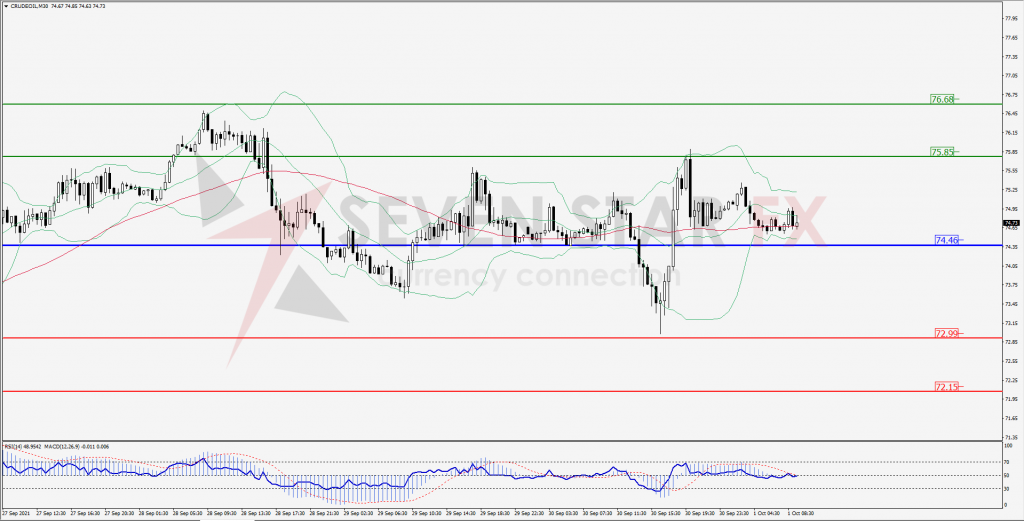
CRUDEOIL Intraday: In a consolidation zone
Our pivot point is at 74.46
Preferable Price Action: Above pivots buy Oil with 75.85 & 76.62 as targets.
Alternative Price Action: Sell crude below pivot with targets at 72.99 and 72.15 in extension.
Comment: Crude is above its 55MA & 20MA and MACD in the positive territory.
Green Lines Indicate Resistance Levels – Red Lines Indicates Support Levels
Light Blue is a Pivot Point – Black represents the price when the report was produced
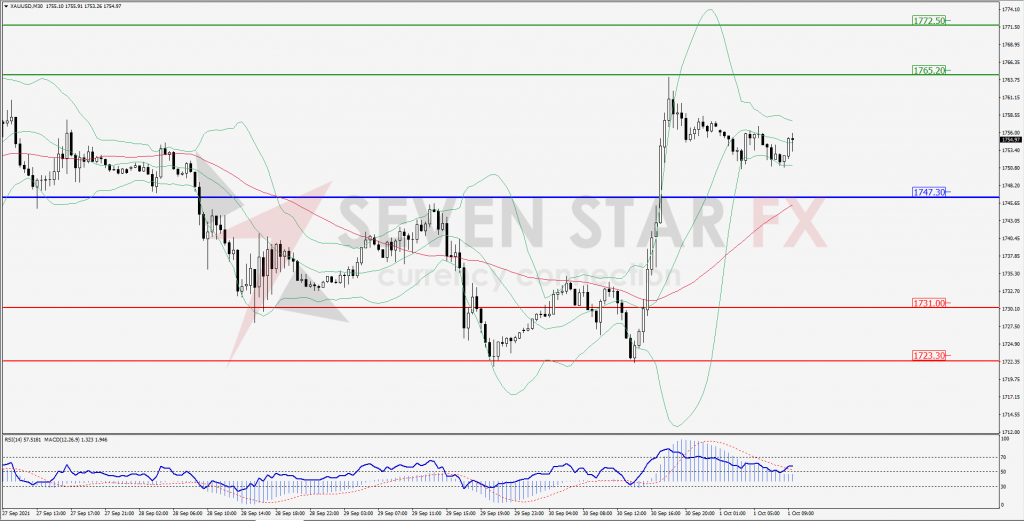
XAU/USD Intraday: Break resistance level
Our pivot point is 1747.30
Preferable Price Action: Further upside to 1765.20 and 1772.50
Alternative Price Action: If the price gives an downside breakout of a pivot, then the price extends to 1731.00 and 1723.30.
Comment: MACD in positive territory and price above its 20MA & 55MA.
Green Lines Indicate Resistance Levels – Red Lines Indicates Support Levels
Light Blue is a Pivot Point – Black represents the price when the report was produced
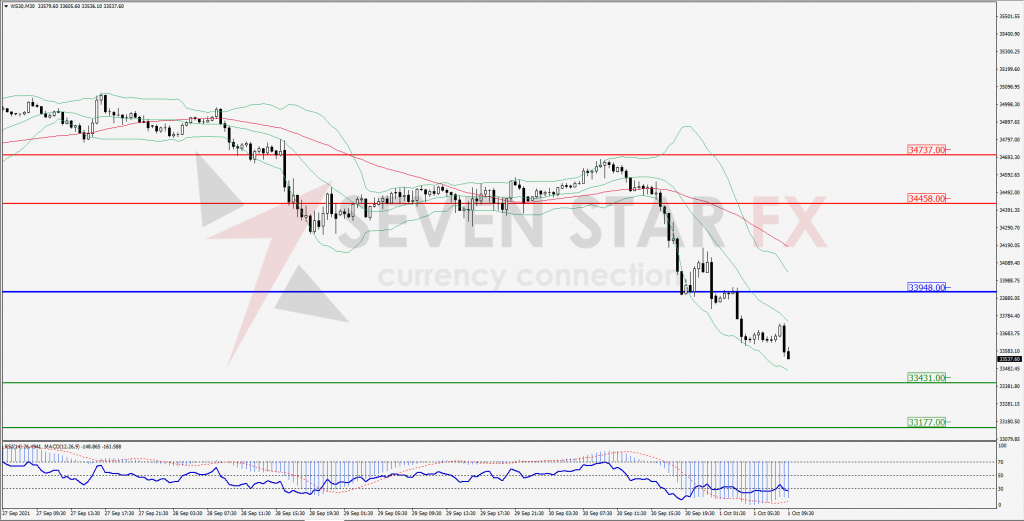
Dow Jones Intraday: Strong trend on the downside
Our pivot point is 33,948.00
Preferable Price Action: Take short positions below pivot with targets at 33,431.00 & 33,177.00.
Alternative Price Action: Above 33,948.00 looks for further upside to 34,458.00 & 34,737.00.
Comment: Price below it 20MA & 55MA and RSI oversold levels.
Green Lines Indicate Resistance Levels – Red Lines Indicates Support Levels
Light Blue is a Pivot Point – Black represents the price when the report was produced