Market Wrap: Stocks, Bonds, Commodities
The Dow Jones and S&P 500 fell on Tuesday, as worries over the slowing pace of economic recovery overshadowed hopes that the Federal Reserve would maintain its accommodative stance a little longer after a soft U.S. payrolls report.
The Dow Jones Industrial Average was down 274.89 points (0.78%) at 35,094.20, the S&P 500 was down 17.94 points (0.40%) at 4,517.49, and the Nasdaq Composite was flat 15,368.50.
Three-quarters of U.S. adults have received at least one dose of a Covid-19 vaccine as of Tuesday, according to the White House, setting a new milestone in the country’s fight against the pandemic.
Asian shares hovered just off six-week highs on Wednesday, as a more risk-averse mood spread into the market from the United States overnight due to worries about slowing growth that hurt equities while helping the dollar firm.
MSCI’s index of Asia-Pacific stocks outside Japan lost 0.57% to 846.80 levels. Australian index fell 0.24% to 7,512.00. Japanese Nikkei jumped 0.89% to 30,181.21.
European stocks were lower on Wednesday, with the Stoxx Europe 50 Index fell 0.94% to 4,185.35, Germany’s DAX lost 1.00% to 15,684.35, and France’s CAC down 0.95% to 6,662.17, and U.K.’s FTSE 100 slipped 0.73% to 7,097.97.
Benchmark 10-year U.S. Treasury rose as demand for safe assets grows again, today 10-year bond yields down 0.58% to 1.363.
Oil prices were little changed on Wednesday following overnight losses from a stronger dollar and demand concerns, with a slow production restart in the U.S. Gulf of Mexico providing some support.
Spot Brent crude oil advance 0.54% to $72.08 per barrel. US West Texas Intermediate crude gained 0.63% to $68.78 a barrel.
The yellow metal traded lower 0.07% to 1796.65 dollars per ounce.
Market Wrap: Forex
The dollar hovered near a one-week peak on Wednesday against major peers, buoyed by higher Treasury yields and a weaker euro amid caution before a European Central Bank policy decision.
Today, the U.S. dollar index measures the greenback against a trade-weighted basket of six major currencies, which rose 0.11% to 92.618.
The Euro US Dollar (EUR/USD) is a widely traded pair flat today. This left the pairing trading around $1.18310.
The Japanese yen fell against the U.S. dollar on Wednesday as the stock pushes higher. Today US/JPY gained 0.10% to 110.380 level.
Another commodity-related currency lower against the U.S dollar, AUD/USD lost 0.17% to 0.73710, and NZD/USD fell 0.06% to 0.70920 level.
EUR/USD Intraday: Resistance at 1.18510
Our pivot point is at 1.18510
Preferable Price Action: Take short positions below pivot level with targets at 1.18170 & 1.17980 in extension.
Alternative Price Action: Above pivot looks for a further upside to 1.18860 & 1.19060.
Comment: Pair below its 55MA & 20MA and RSI below 50 levels.
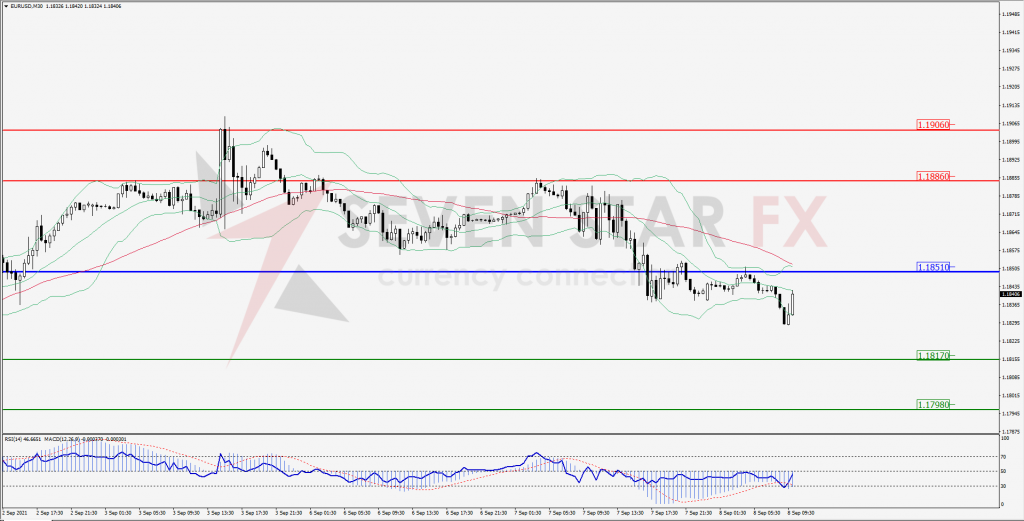
Green Lines Indicate Resistance Levels – Red Lines Indicates Support Levels
Light Blue is a Pivot Point – Black represents the price when the report was produced
GBP/USD Intraday: Trend on the downside
Our pivot point is at 1.37880
Preferable Price Action: Sell positions below pivot with targets at 1.37470 & 1.37220 in extension.
Alternative Price Action: The price above pivot would call for further upside to 1.38290 & 1.38550.
Comment: Pair below its 55MA & 20MA and RSI below 50 levels.
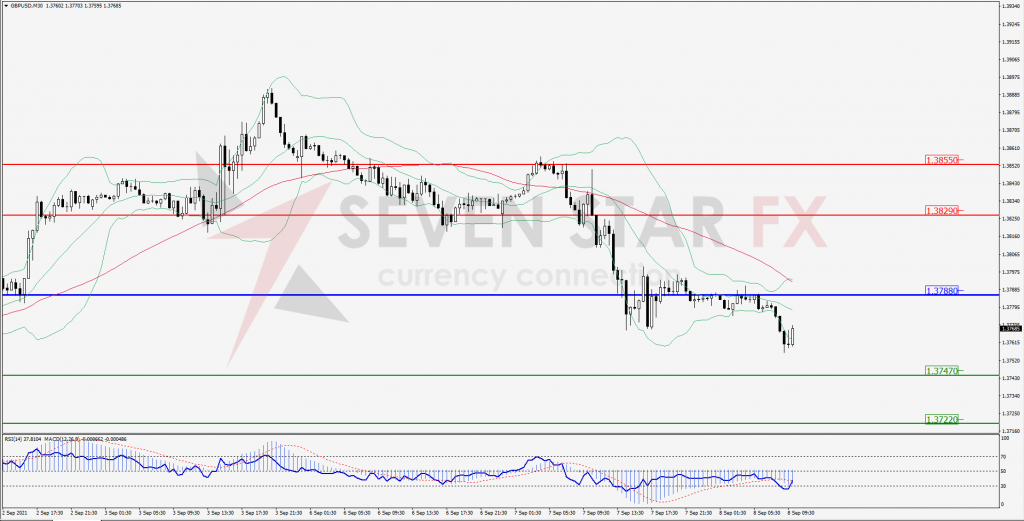
Green Lines Indicate Resistance Levels – Red Lines Indicates Support Levels
Light Blue is a Pivot Point – Black represents the price when the report was produced
USD/JPY Intraday: Break resistance level
Our pivot point is at 110.200
Preferable Price Action: Buy position above pivot with the target at 110.530 and 110.700 in extension.
Alternative Price Action: The downside breakout of the pivot would call for 109.870 and 109.700.
Comment: Price above its 20MA and MACD in positive territory.
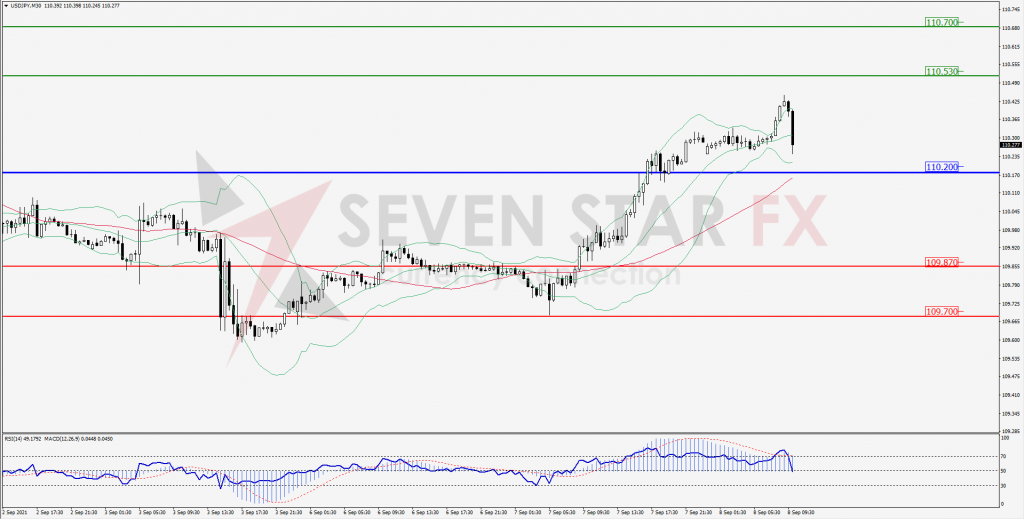
Green Lines Indicate Resistance Levels – Red Lines Indicates Support Levels
Light Blue is a Pivot Point – Black represents the price when the report was produced
AUD/USD Intraday: Break support level
Our pivot point is at 0.73960
Preferable Price Action: Sell Positions below pivot with targets at 0.73540 & 0.73320 in extension.
Alternative Price Action: Above pivot looks for a further upside with 0.74380 & 0.74610 as targets.
Comment: Pair below its 20MA & 55MA and RSI below 50 levels.
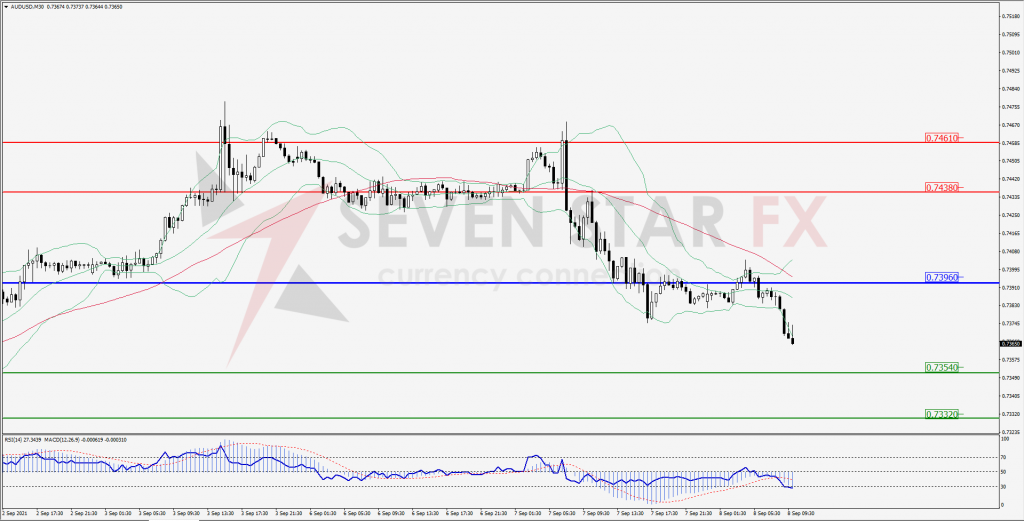
Green Lines Indicate Resistance Levels – Red Lines Indicates Support Levels
Light Blue is a Pivot Point – Black represents the price when the report was produced
CRUDEOIL Intraday: Support at 68.17
Our pivot point is at 68.17
Preferable Price Action: Above pivots buy Oil with 69.51 & 70.25 as targets.
Alternative Price Action: Sell crude below pivot with targets at 66.98 and 66.36 in extension.
Comment: Crude is above its 55MA & 20MA and MACD in the positive territory.
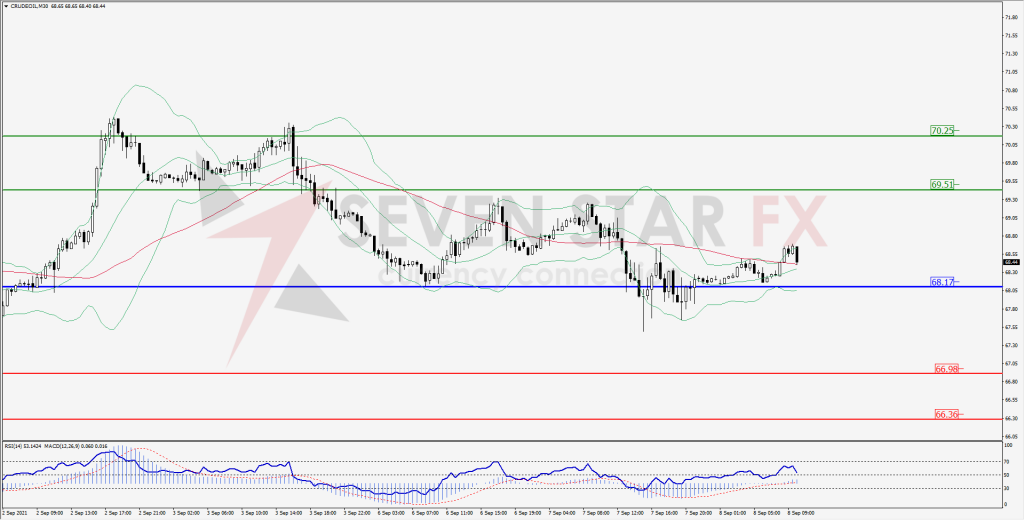
Green Lines Indicate Resistance Levels – Red Lines Indicates Support Levels
Light Blue is a Pivot Point – Black represents the price when the report was produced
XAU/USD Intraday: Resistance at 1805.50
Our pivot point is 1805.50
Preferable Price Action: Further downside to 1792.30 and 1785.70.
Alternative Price Action: If the price gives a upside breakout of a pivot, then the price extends to 1819.90 and 1826.70.
Comment: MACD in negative territory and price below its 55MA.
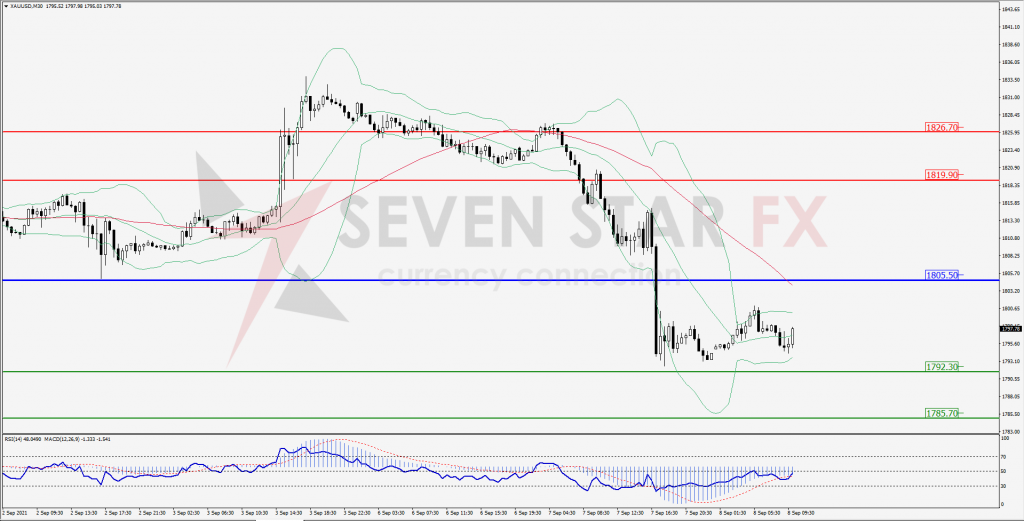
Green Lines Indicate Resistance Levels – Red Lines Indicates Support Levels
Light Blue is a Pivot Point – Black represents the price when the report was produced
Dow Jones Intraday: Trend on the downside
Our pivot point is 35,137.00
Preferable Price Action: Take short positions below pivot with targets at 34,942.00 & 34,827.00.
Alternative Price Action: above 35,137.00 looks for further upside to 35,331.00 & 35,443.00.
Comment: Price below it 20MA & 55MA and RSI below 50 levels.
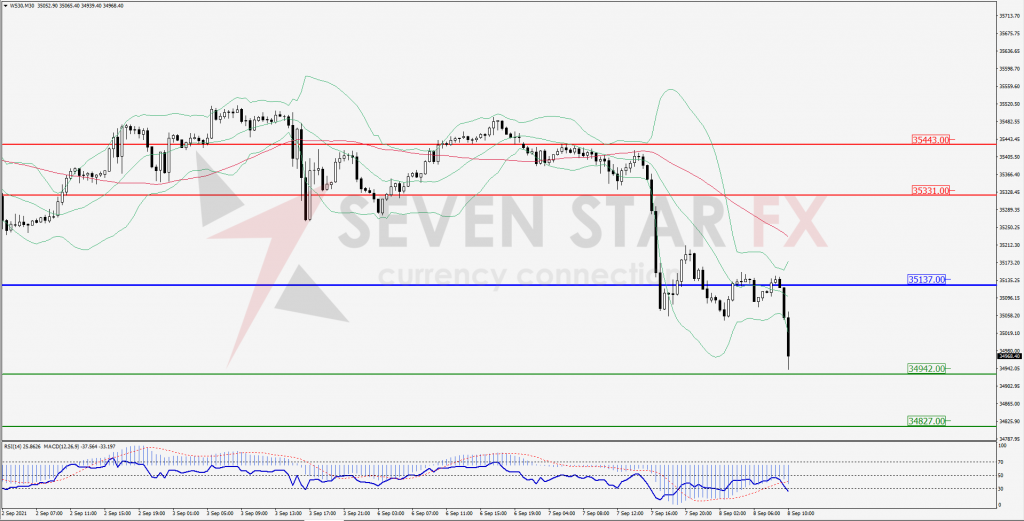
Green Lines Indicate Resistance Levels – Red Lines Indicates Support Levels
Light Blue is a Pivot Point – Black represents the price when the report was produced