Market Wrap: Stocks, Bonds, Commodities
Wall Street fell on Thursday on fears of a faster tapering of the Federal Reserve’s bond purchase program, although gains in banks and some strong earnings reports helped cap losses.
The Dow Jones Industrial Average was down 53.39 points (0.15%) at 35,352.11 and the S&P 500 was down 10.14 points (0.23%) at 4,486.05. The Nasdaq Composite was down 22.96 points (0.15%) at 15,018.90.
Asia-Pacific markets tumbled in early trade on Friday as investors remained cautious ahead of the Federal Reserve’s annual Jackson Hole symposium where Fed Chair Jerome Powell is due to speak.
MSCI’s index of Asia-Pacific stocks outside Japan gained 0.12% to 813.42 levels. Australian index lost 0.05% to 7,488.30. Japanese Nikkei traded 0.36% lower to 27,641.14.
European stocks were lower on Thursday, with the Stoxx Europe 50 Index slipped 0.28% to 4,169.45, Germany’s DAX down 0.29% to 15,814.15, and France’s CAC fell 0.33% to 6,663.10, and U.K.’s FTSE 100 down 0.33% to 7,126.32.
Benchmark 10-year U.S. Treasury rose as demand for safe assets grows again, today 10-year bond yields fell 0.24% to 1.341.
Oil fell 1% on Thursday as renewed concerns about demand due to rising COVID-19 infections cut short a three-day rally, and as Mexico restored some oil production after a fire disrupted supplies.
Spot Brent crude oil advance 1.37% to $71.14 per barrel. US West Texas Intermediate crude gained 1.56% to $68.47 a barrel.
Gold prices were steady on Friday, as investors awaited Fed chief Jerome Powell’s speech later in the day at the Jackson Hole symposium after some U.S. central bank officials called for paring bond purchases. The yellow metal traded higher 0.58% to 1805.60 dollars per ounce.
Market Wrap: Forex
The dollar held firm on Friday after the U.S. Federal Reserve’s hawkish wing called for tapering bond purchases as investors looked to a highly-anticipated speech by Fed Chair Jerome Powell later in the day.
Today, the U.S. dollar index measures the greenback against a trade-weighted basket of six major currencies, which gained 0.13% to 92.953.
The Euro US Dollar (EUR/USD) is a widely traded pair that advanced rose 0.16% today. This left the pairing trading around $1.17680.
The Japanese yen rose against the U.S. dollar on Friday as the stock pushes higher. Today US/JPY fell 0.05% to 110.000 level.
Another commodity-related currency higher against the U.S dollar, AUD/USD rose 0.30% to 0.72530, and NZD/USD gained 0.12% to 0.69550 level.
EUR/USD Intraday: Support at 1.17510
Our pivot point is at 1.17510
Preferable Price Action: Take long positions above pivot level with targets at 1.17830 & 1.18010 in extension.
Alternative Price Action: Below pivot looks for a further downside to 1.17230 & 1.17050.
Comment: Pair above its 55MA & 20MA and RSI above 50 levels.
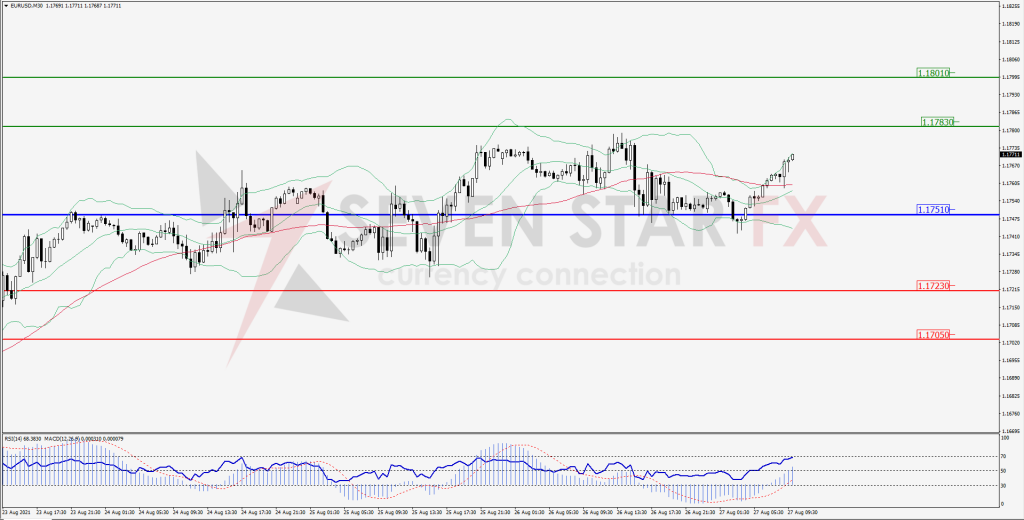
Green Lines Indicate Resistance Levels – Red Lines Indicates Support Levels
Light Blue is a Pivot Point – Black represents the price when the report was produced
GBP/USD Intraday: Break support level
Our pivot point is at 1.37250
Preferable Price Action: Buy positions above pivot with targets at 1.37700 & 1.37980 in extension.
Alternative Price Action: The price below pivot would call for further downside to 1.36780 & 1.36490.
Comment: Pair below its 55MA and RSI above 50 levels.
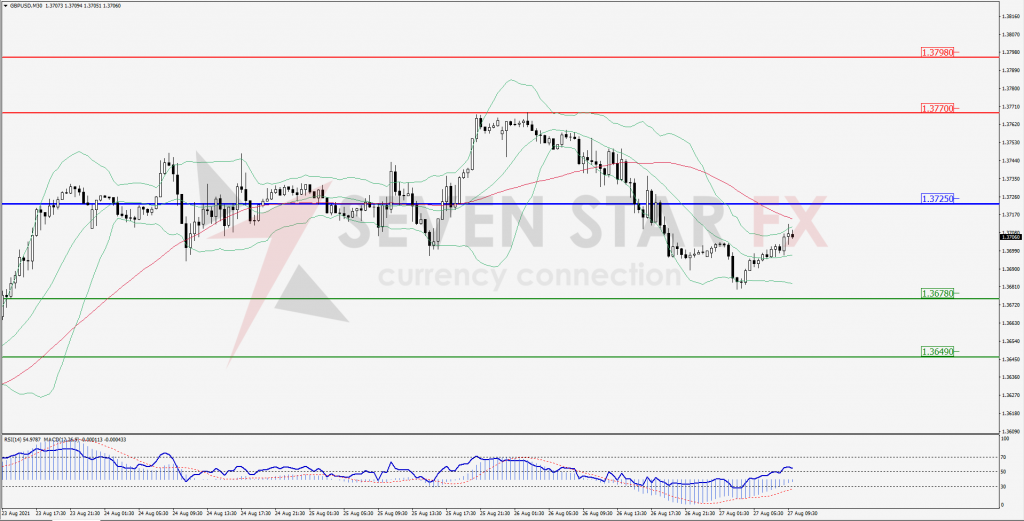
Green Lines Indicate Resistance Levels – Red Lines Indicates Support Levels
Light Blue is a Pivot Point – Black represents the price when the report was produced
USD/JPY Intraday: Resistance at 110.130
Our pivot point is at 110.130
Preferable Price Action: Sell position below pivot with the target at 109.840 and 109.670 in extension.
Alternative Price Action: The upside breakout of the pivot would call for 110.390 and 110.560.
Comment: Price below its 55MA & 20MA and MACD in negative territory.
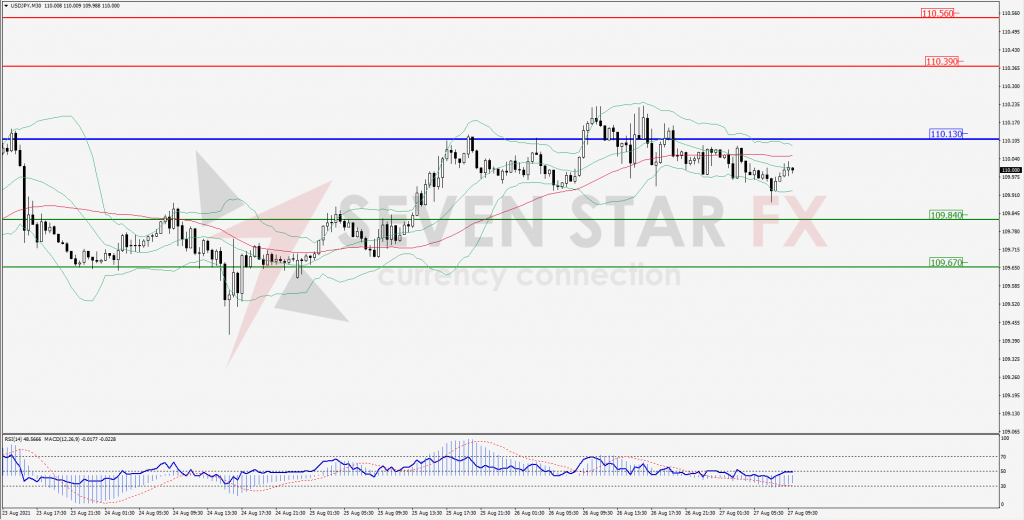
Green Lines Indicate Resistance Levels – Red Lines Indicates Support Levels
Light Blue is a Pivot Point – Black represents the price when the report was produced
AUD/USD Intraday: Trend on the upside
Our pivot point is at 0.72280
Preferable Price Action: Buy Positions above pivot with targets at 0.72700 & 0.72930 in extension.
Alternative Price Action: Below pivot looks for a further downside with 0.71830 & 0.71590 as targets.
Comment: Pair above its 20MA & 55MA and RSI below 50 levels.
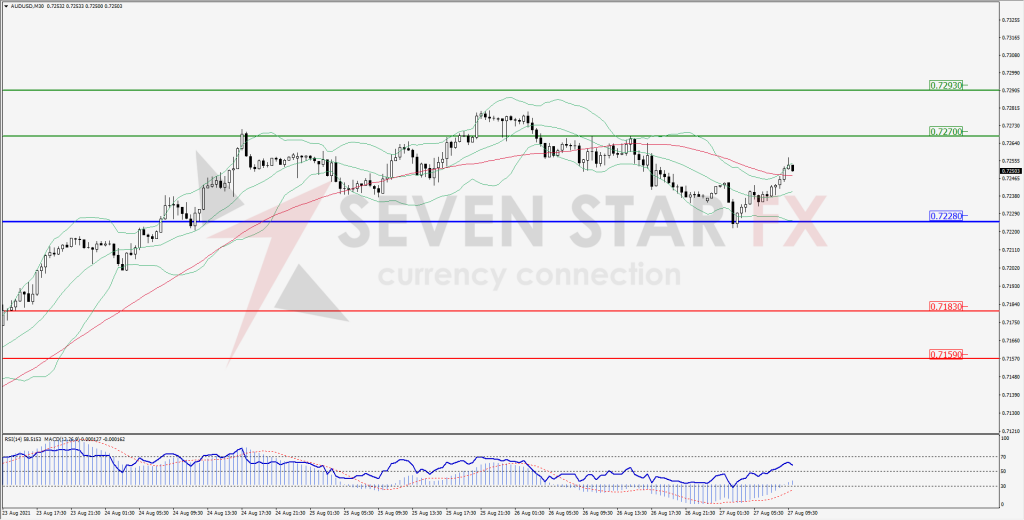
Green Lines Indicate Resistance Levels – Red Lines Indicates Support Levels
Light Blue is a Pivot Point – Black represents the price when the report was produced
CRUDEOIL Intraday: Strong trend on the upside
Our pivot point is at 67.32
Preferable Price Action: Above pivots buy Oil with 69.12 & 70.12 as targets.
Alternative Price Action: Sell crude below pivot with targets at 65.57 and 64.46 in extension.
Comment: Crude is above its 55MA & 20MA and MACD in the positive territory.
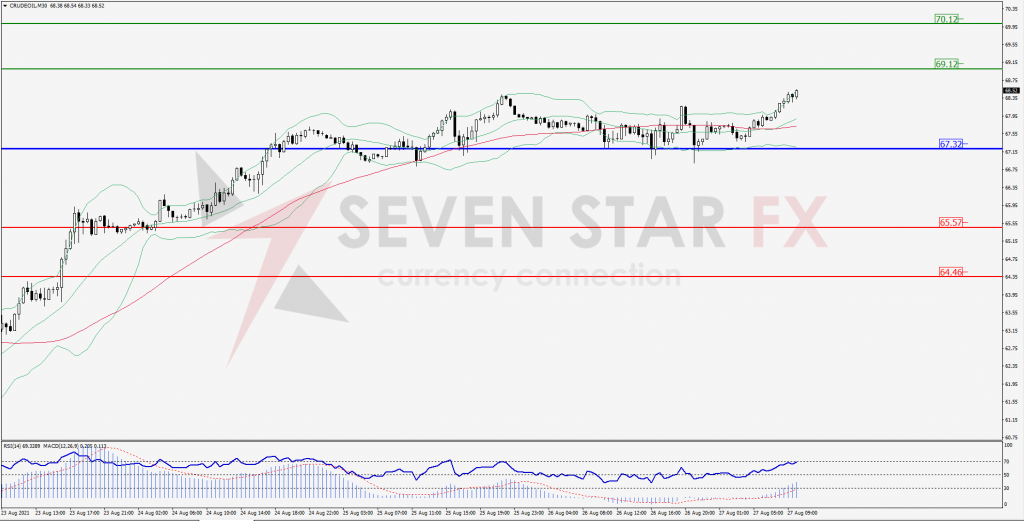
Green Lines Indicate Resistance Levels – Red Lines Indicates Support Levels
Light Blue is a Pivot Point – Black represents the price when the report was produced
XAU/USD Intraday: Break resistance level
Our pivot point is 1799.90
Preferable Price Action: Further upside to 1808.70 & 1813.70.
Alternative Price Action: If the price gives an downside breakout of a pivot, then the price extends to 1790.80 and 1785.90.
Comment: MACD in positive territory and price above its 55MA & 20MA.
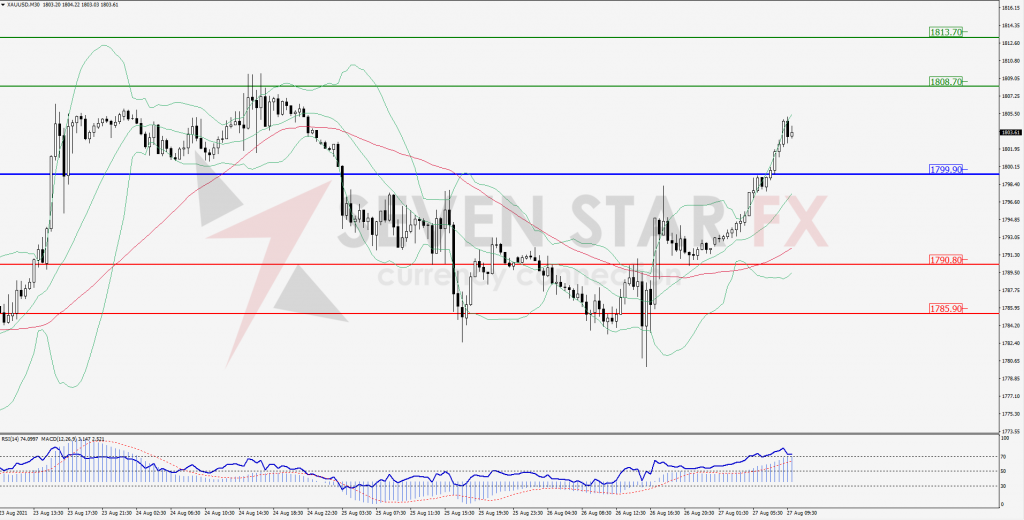
Green Lines Indicate Resistance Levels – Red Lines Indicates Support Levels
Light Blue is a Pivot Point – Black represents the price when the report was produced
Dow Jones Intraday: In a consolidation zone
Our pivot point is 35,257.00
Preferable Price Action: Take long positions above pivot with targets at 35,447.00 & 35,551.00.
Alternative Price Action: below 35,257.00 looks for further downside to 35,057.00 & 34,949.00.
Comment: Price above its 20MA and RSI above 50 levels.
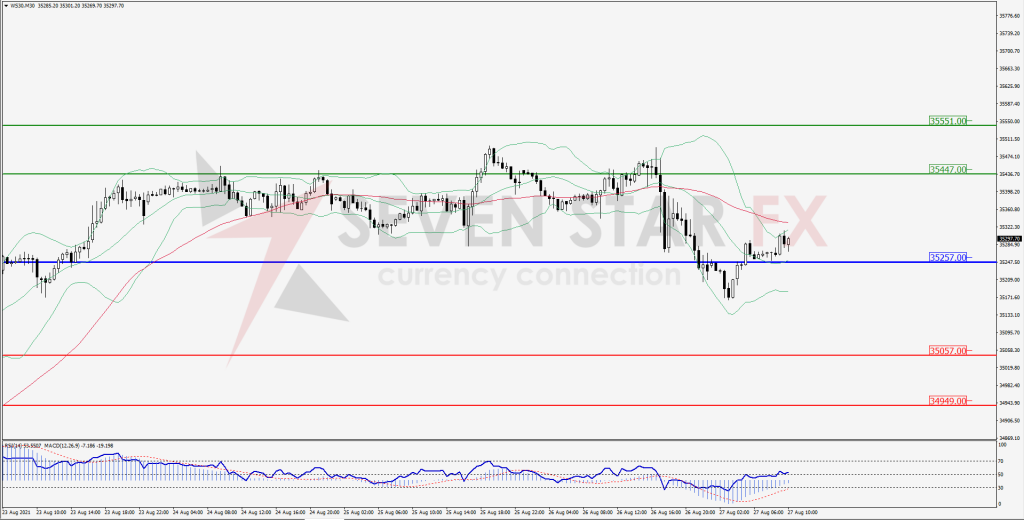
Green Lines Indicate Resistance Levels – Red Lines Indicates Support Levels
Light Blue is a Pivot Point – Black represents the price when the report was produced