Market Wrap: Stocks, Bonds, Commodities
Wall Street gained ground again on Wednesday, with chipmakers and financials helping to push the S&P 500 and the Nasdaq to record closing highs as investors look to the upcoming Jackson Hole Symposium for assurances that Federal Reserve’s timeline for policy tightening remains intact.
The Dow Jones Industrial Average rose 39.24 points (0.11%) to 35,405.5, the S&P 500 gained 9.96 points (0.22%) to 4,496.19 and the Nasdaq Composite added 22.06 points (0.15%) to 15,041.86.
Asia-Pacific stocks were mixed in early trade on Thursday, as US markets again surged to record highs. Meanwhile, South Korea’s central bank hiked interest rates.
MSCI’s index of Asia-Pacific stocks outside Japan fell 0.64% to 812.79 levels. Australian index lost 0.54% to 7,491.20. Japanese Nikkei traded 0.06% higher to 27,742.29.
European stocks were lower on Thursday, with the Stoxx Europe 50 Index slipped 0.28% to 4,169.45, Germany’s DAX down 0.29% to 15,814.15, and France’s CAC fell 0.33% to 6,663.10, and U.K.’s FTSE 100 down 0.33% to 7,126.32.
Benchmark 10-year U.S. Treasury rose as demand for safe assets grows again, today 10-year bond yields rose 0.26% to 1.347.
Oil fell on Thursday for the first session this week as renewed concerns about demand recovery amid rising COVID-19 infections cut short a three-day rally.
Spot Brent crude oil fell 1.00% to $70.57 per barrel. US West Texas Intermediate crude slipped 1.17% to $67.55 a barrel.
The yellow metal traded lower 0.27% to 1786.15 dollars per ounce.
Market Wrap: Forex
The dollar hovered near a one-week low versus major peers on Thursday amid optimism the Delta coronavirus variant won’t derail a global economic recovery, with investors now eyeing the Fed’s Jackson Hole symposium on Friday for clues on the timing of a tapering of monetary stimulus.
Today, the U.S. dollar index measures the greenback against a trade-weighted basket of six major currencies, which gained 0.13% to 92.953.
The Euro US Dollar (EUR/USD) is a widely traded pair that advanced fell 0.07% today. This left the pairing trading around $1.17600.
The Japanese yen lost against the U.S. dollar on Thursday as the stock pushes higher. Today US/JPY gained 0.17% to 110.180 level.
Another commodity-related currency lower against the U.S dollar, AUD/USD fell 0.21% to 0.72570, and NZD/USD slipped 0.24% to 0.69540 level.
EUR/USD Intraday: Support at 1.17490
Our pivot point is at 1.17490
Preferable Price Action: Take long positions above pivot level with targets at 1.18040 & 1.17840 in extension.
Alternative Price Action: Below pivot looks for a further downside to 1.17130 & 1.16900.
Comment: Pair above its 55MA & 20MA and RSI above 50 levels.
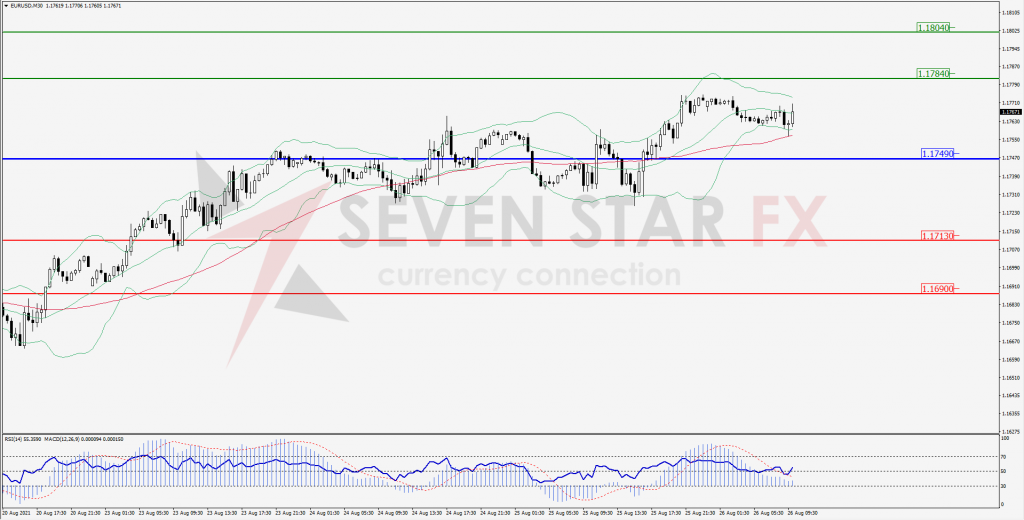
Green Lines Indicate Resistance Levels – Red Lines Indicates Support Levels
Light Blue is a Pivot Point – Black represents the price when the report was produced
GBP/USD Intraday: Support at 1.37160
Our pivot point is at 1.37160
Preferable Price Action: Buy positions above pivot with targets at 1.37730 & 1.38010 in extension.
Alternative Price Action: The price below pivot would call for further downside to 1.36610 & 1.36300.
Comment: Pair above its 55MA and RSI below 50 levels.
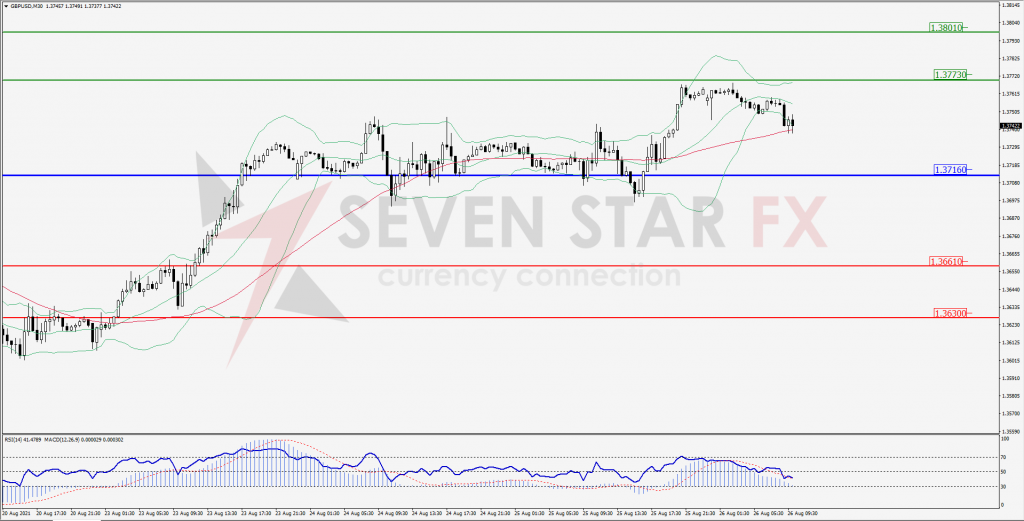
Green Lines Indicate Resistance Levels – Red Lines Indicates Support Levels
Light Blue is a Pivot Point – Black represents the price when the report was produced
USD/JPY Intraday: Resistance at 109.990
Our pivot point is at 109.990
Preferable Price Action: Buy position above pivot with the target at 110.250 and 110.380 in extension.
Alternative Price Action: The downside breakout of the pivot would call for 109.720 and 109.590.
Comment: Price above its 55MA & 20MA and MACD in positive territory.
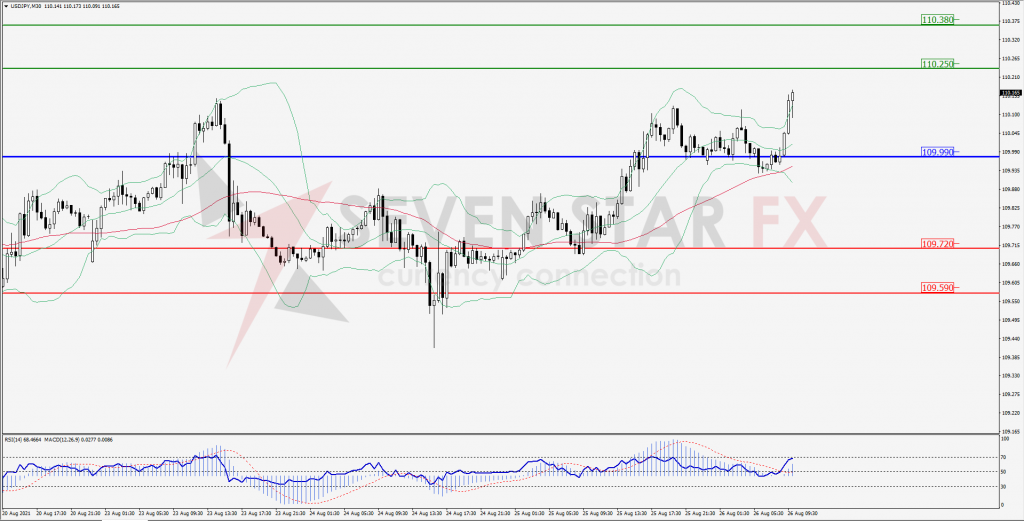
Green Lines Indicate Resistance Levels – Red Lines Indicates Support Levels
Light Blue is a Pivot Point – Black represents the price when the report was produced
AUD/USD Intraday: Trend on the upside
Our pivot point is at 0.72280
Preferable Price Action: Buy Positions above pivot with targets at 0.72870 & 0.73160 in extension.
Alternative Price Action: Below pivot looks for a further downside with 0.71750 & 0.71450 as targets.
Comment: Pair near its 20MA & 55MA and RSI below 50 levels.
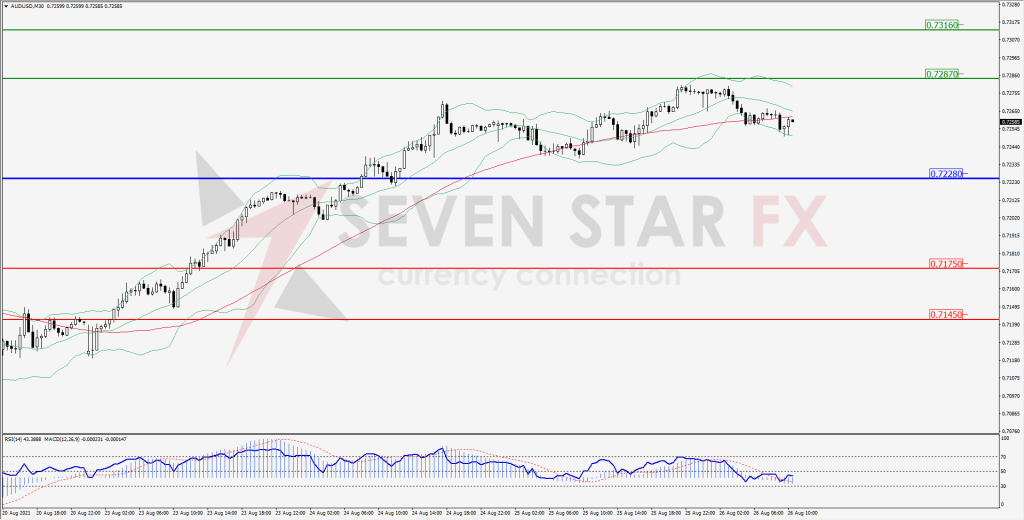
Green Lines Indicate Resistance Levels – Red Lines Indicates Support Levels
Light Blue is a Pivot Point – Black represents the price when the report was produced
CRUDEOIL Intraday: Strong trend on the upside
Our pivot point is at 67.03
Preferable Price Action: Above pivots buy Oil with 68.97 & 70.29 as targets.
Alternative Price Action: Sell crude below pivot with targets at 64.68 and 63.26 in extension.
Comment: Crude is above its 55MA & 20MA and MACD in the positive territory.
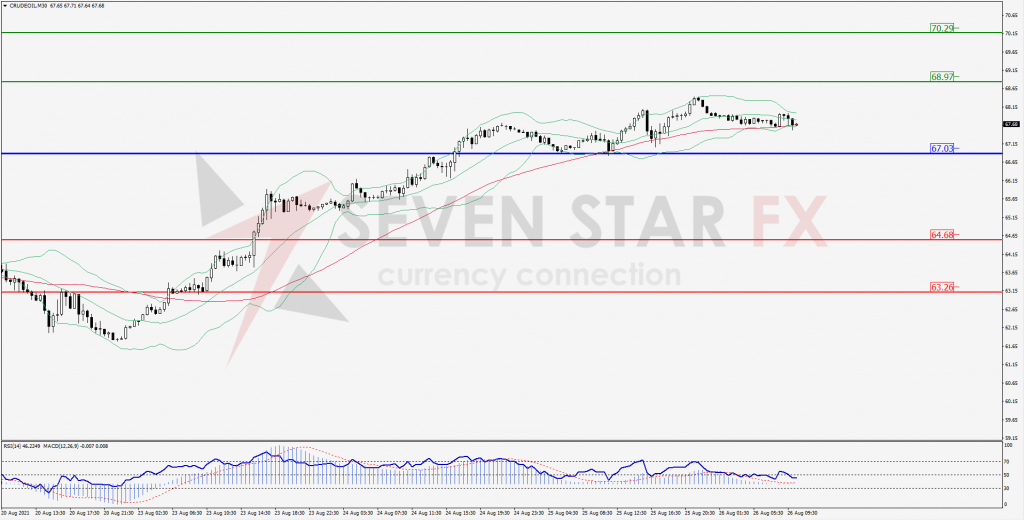
Green Lines Indicate Resistance Levels – Red Lines Indicates Support Levels
Light Blue is a Pivot Point – Black represents the price when the report was produced
XAU/USD Intraday: Resistance at 1801.70
Our pivot point is 1791.10
Preferable Price Action: Further downside to 1780.90 & 1775.40.
Alternative Price Action: If the price gives an upside breakout of a pivot, then the price extends to 1801.70 and 1806.90.
Comment: MACD in negative territory and price below its 55MA & 20MA.
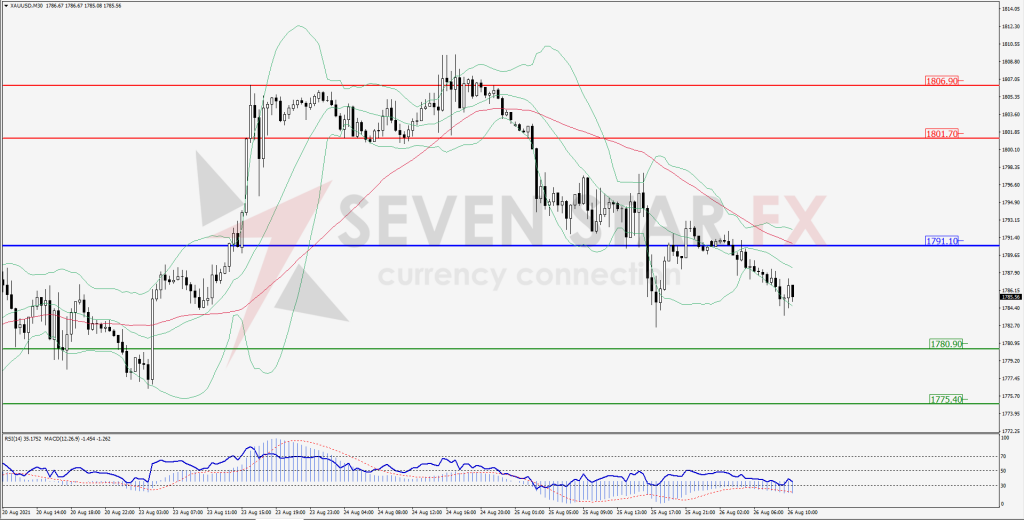
Green Lines Indicate Resistance Levels – Red Lines Indicates Support Levels
Light Blue is a Pivot Point – Black represents the price when the report was produced
Dow Jones Intraday: In a consolidation zone
Our pivot point is 35,225.00
Preferable Price Action: Take long positions above pivot with targets at 35,528.00 & 35,684.00.
Alternative Price Action: below 35,225.00 looks for further downside to 34,957.00 & 34,786.00.
Comment: Price above its 20MA & 55MA and RSI above 50 levels.
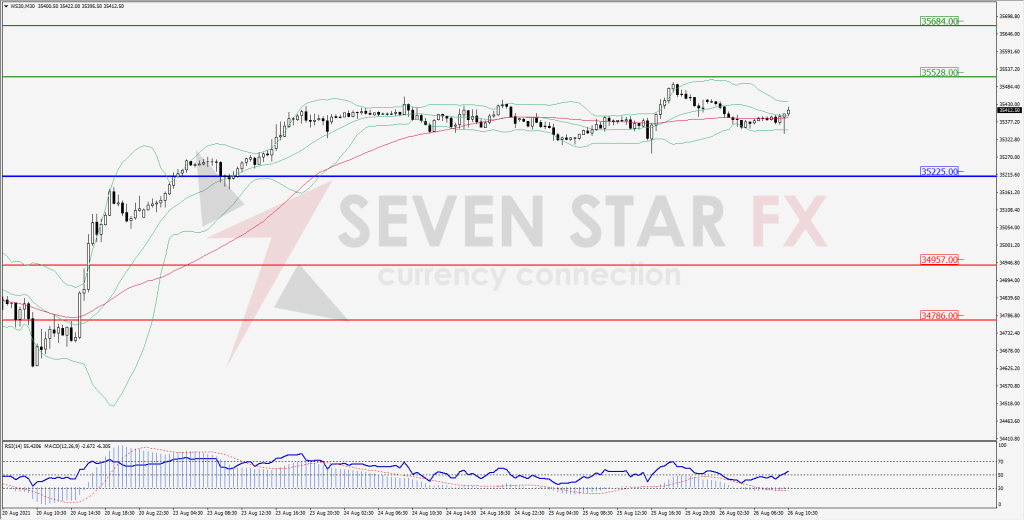
Green Lines Indicate Resistance Levels – Red Lines Indicates Support Levels
Light Blue is a Pivot Point – Black represents the price when the report was produced