DAILY MARKET ANALYSIS: EUR/USD – MARCH 19, 2025
📊 EURO/USD TECHNICAL & FUNDAMENTAL OUTLOOK
📈 KEY TECHNICAL LEVELS
🔺 Resistance Levels:
-
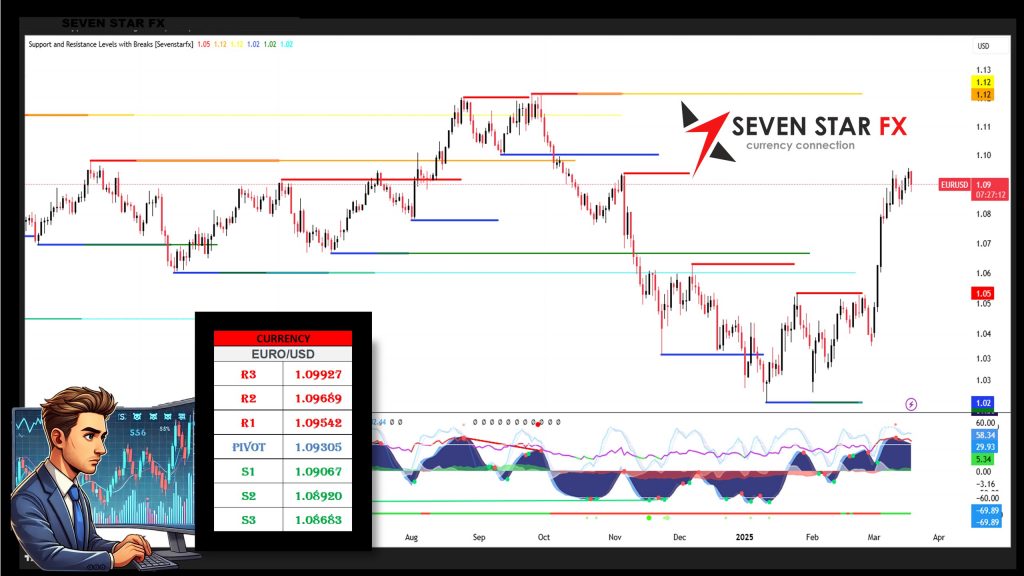
R3: 1.09927
-
R2: 1.09689
-
R1: 1.09542
🔹 Pivot Level:
-
Pivot: 1.09305
🟢 Support Levels:
-
S1: 1.09067
-
S2: 1.08920
-
S3: 1.08683
📌 Trading above the pivot (1.09305) suggests bullish momentum, while dropping below S1 (1.09067) may indicate further downside.
🔍 FUNDAMENTAL ANALYSIS
🏦 ECB MONETARY POLICY
The European Central Bank (ECB) remains under pressure to adjust interest rates amid economic uncertainties. A potential rate cut to 2.5% is still on the table as inflation continues to ease.
📉 EUROZONE ECONOMIC INDICATORS
-
Inflation dropped to 2.4% in February, supporting the case for a rate cut.
-
The Euro remains under pressure as economic growth shows signs of slowing.
🇺🇸 U.S. ECONOMIC FACTORS
-
The U.S. dollar faces weakness due to ongoing trade policy concerns and expectations of a softer Fed stance.
-
Slower U.S. job growth has weighed on investor sentiment, leading to potential volatility in EUR/USD.
🛠️ TECHNICAL ANALYSIS TOOLS
📏 Fibonacci Retracement:
-
Implication: Trading above the pivot (1.09305) could lead to testing higher resistance levels (R1-R3).
-
Break below S1 (1.09067) may increase downside pressure towards S2 and S3.
📊 Bollinger Bands:
-
Setup: Price is fluctuating near the middle band, indicating neutral to slightly bullish momentum.
-
Implication: A breakout above the upper band may confirm a bullish run, while a move below the lower band could signal a downtrend.
🌊 Elliott Wave Analysis:
-
Insight: The pair is currently in a corrective phase (Wave 4).
-
Outlook: Holding above the pivot could set the stage for a bullish Wave 5, targeting R1-R3.
-
Risk: A break below S1 may indicate an extended bearish correction.
⚠️ FINAL THOUGHTS & DISCLAIMER
This analysis provides both technical and fundamental insights to help traders navigate the EUR/USD market. However, due to forex volatility, traders should implement robust risk management and conduct independent research before making decisions.
🚀 Stay informed and trade wisely! 🚀
EUR/USD
Technical Levels
-
Resistance: 1.09927 | 1.09689 | 1.09542
-
Pivot: 1.09305
-
Support: 1.09067 | 1.08920 | 1.08683
Fundamental Outlook
-
ECB may cut interest rates as inflation stabilizes at 2.4%.
-
The USD remains weak due to economic concerns and slow job growth.
Technical Indicators
-
Stochastic Oscillator (8,3,5): 65 (moderate bullish momentum)
-
WMA (144): Price above WMA, indicating a bullish trend.
Trade Setups
-
Buy Entry: 1.09350 → 🎯 Target: 1.09650 | 🚫 SL: 1.09150
-
Sell Entry: 1.09050 → 🎯 Target: 1.08750 | 🚫 SL: 1.09250
⚠️ RISK WARNING: This report is for educational purposes only. Trading forex involves significant risk and may not be suitable for all investors. Trade at your own risk. Always use proper risk management strategies to protect your capital.
DAILY MARKET ANALYSIS: GBP/USD – MARCH 19, 2025
📊 GBP/USD TECHNICAL & FUNDAMENTAL OUTLOOK
📈 KEY TECHNICAL LEVELS
🔺 Resistance Levels:
-
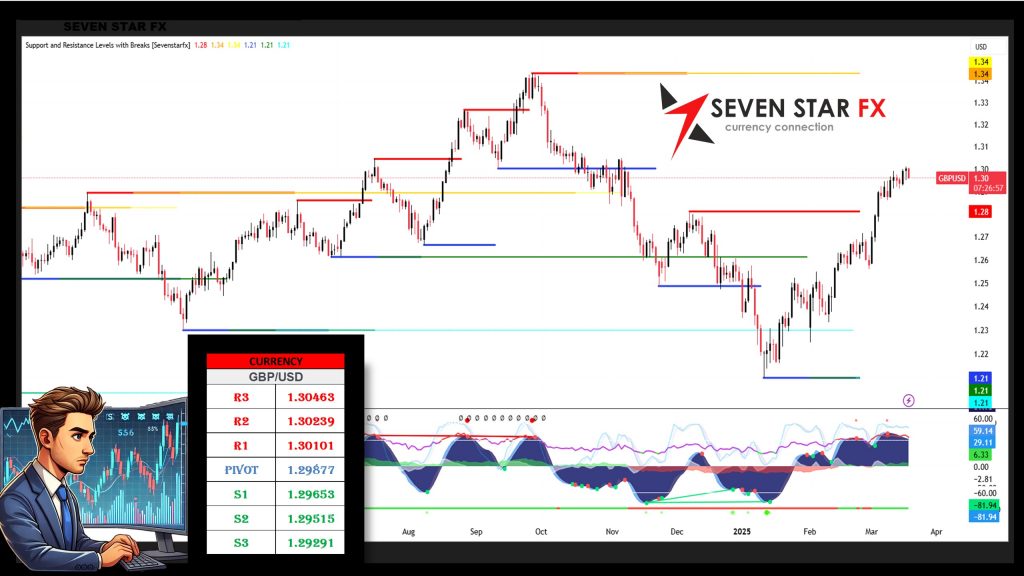
R3: 1.30463
-
R2: 1.30239
-
R1: 1.30101
🔹 Pivot Level:
-
Pivot: 1.29877
🟢 Support Levels:
-
S1: 1.29653
-
S2: 1.29515
-
S3: 1.29291
📌 Trading above the pivot (1.29877) suggests bullish momentum, while dropping below S1 (1.29653) may indicate further downside.
🔍 FUNDAMENTAL ANALYSIS
🏦 BOE MONETARY POLICY
The Bank of England (BOE) is closely monitoring inflation and economic growth before making any policy adjustments. While inflation remains elevated, recent data suggests a slight cooldown, reducing the urgency for further rate hikes.
📉 UK ECONOMIC INDICATORS
-
Inflation slowed to 3.2% in February, increasing speculation of a potential rate pause.
-
UK GDP growth remained steady at 0.3% for Q1, reflecting resilience in the economy.
🇺🇸 U.S. ECONOMIC FACTORS
-
The U.S. dollar remains under pressure due to weaker employment data and concerns over trade policy shifts.
-
Upcoming Federal Reserve decisions could further impact GBP/USD volatility.
🛠️ TECHNICAL ANALYSIS TOOLS
📏 Fibonacci Retracement:
-
Implication: Trading above the pivot (1.29877) could lead to testing higher resistance levels (R1-R3).
-
Break below S1 (1.29653) may increase downside pressure towards S2 and S3.
📊 Bollinger Bands:
-
Setup: Price is hovering near the upper band, suggesting bullish momentum.
-
Implication: A breakout above R1 may confirm further upside potential, while a drop below S1 could trigger selling pressure.
🌊 Elliott Wave Analysis:
-
Insight: GBP/USD is currently in a consolidation phase before a potential breakout.
-
Outlook: A move above the pivot could initiate Wave 5 towards higher resistance levels.
-
Risk: A decline below S1 may lead to an extended corrective phase.
⚠️ FINAL THOUGHTS & DISCLAIMER
This analysis provides both technical and fundamental insights to help traders navigate the GBP/USD market. However, due to forex volatility, traders should implement robust risk management and conduct independent research before making decisions.
🚀 Stay informed and trade wisely! 🚀
GBP/USD
Technical Levels
-
Resistance: 1.30463 | 1.30239 | 1.30101
-
Pivot: 1.29877
-
Support: 1.29653 | 1.29515 | 1.29291
Fundamental Outlook
-
BOE may hold rates steady as inflation cools to 3.2%.
-
The USD remains weak due to economic concerns and policy uncertainty.
Technical Indicators
-
Stochastic Oscillator (8,3,5): 70 (bullish momentum)
-
WMA (144): Price remains above WMA, indicating an uptrend.
Trade Setups
-
Buy Entry: 1.29900 → 🎯 Target: 1.30250 | 🚫 SL: 1.29700
-
Sell Entry: 1.29600 → 🎯 Target: 1.29350 | 🚫 SL: 1.29800
⚠️ RISK WARNING: This report is for educational purposes only. Trading forex involves significant risk and may not be suitable for all investors. Trade at your own risk. Always use proper risk management strategies to protect your capital.
DAILY MARKET ANALYSIS: USD/JPY – MARCH 19, 2025
📊 USD/JPY TECHNICAL & FUNDAMENTAL OUTLOOK
📈 KEY TECHNICAL LEVELS
🔺 Resistance Levels:
-
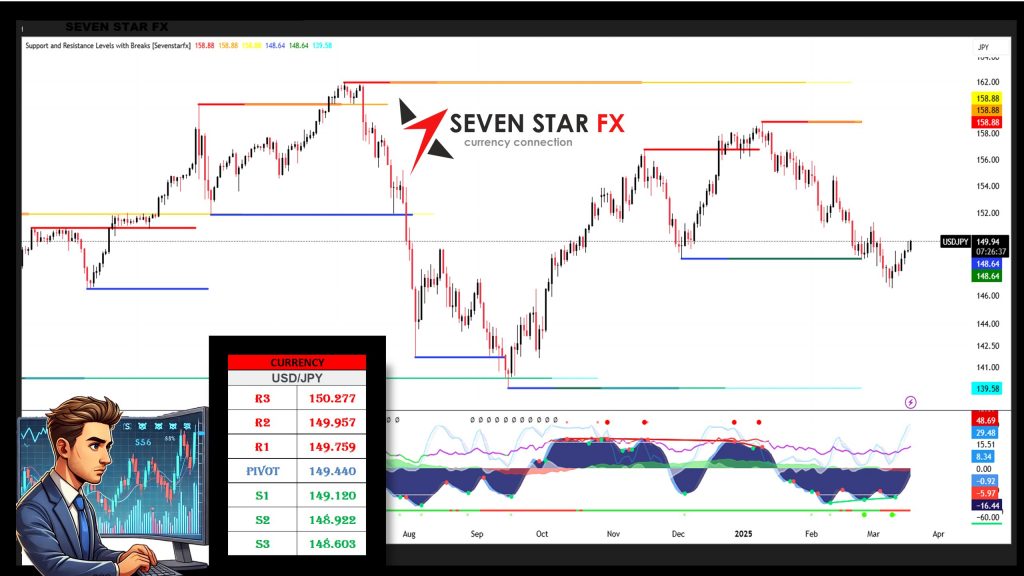
R3: 150.277
-
R2: 149.957
-
R1: 149.759
🔹 Pivot Level:
-
Pivot: 149.440
🟢 Support Levels:
-
S1: 149.120
-
S2: 148.922
-
S3: 148.603
📌 Trading above the pivot (149.440) suggests bullish momentum, while dropping below S1 (149.120) may indicate further downside.
🔍 FUNDAMENTAL ANALYSIS
🏦 BANK OF JAPAN (BOJ) MONETARY POLICY
The Bank of Japan (BOJ) is maintaining its ultra-loose monetary policy stance, despite rising inflation concerns. Traders are closely monitoring any signals of a potential policy shift in the coming months.
📉 JAPAN ECONOMIC INDICATORS
-
Japan’s inflation remained at 2.9%, still above the BOJ’s target, fueling speculation over future rate adjustments.
-
GDP growth slowed to 0.5% in Q1, signaling economic uncertainty.
🇺🇸 U.S. ECONOMIC FACTORS
-
The U.S. dollar remains volatile as traders assess Federal Reserve policy expectations.
-
Weak labor market data in the U.S. could impact USD strength against the JPY.
🛠️ TECHNICAL ANALYSIS TOOLS
📏 Fibonacci Retracement:
-
Implication: Trading above the pivot (149.440) could lead to testing higher resistance levels (R1-R3).
-
Break below S1 (149.120) may increase downside pressure towards S2 and S3.
📊 Bollinger Bands:
-
Setup: Price is hovering near the upper band, suggesting strong bullish sentiment.
-
Implication: A breakout above R1 may confirm further upside, while a drop below S1 could indicate selling pressure.
🌊 Elliott Wave Analysis:
-
Insight: USD/JPY is in a consolidation phase, preparing for a potential breakout.
-
Outlook: A move above the pivot could trigger Wave 5 towards resistance levels.
-
Risk: A decline below S1 may lead to extended bearish correction.
⚠️ FINAL THOUGHTS & DISCLAIMER
This analysis provides both technical and fundamental insights to help traders navigate the USD/JPY market. However, due to forex volatility, traders should implement robust risk management and conduct independent research before making decisions.
🚀 Stay informed and trade wisely! 🚀
USD/JPY
Technical Levels
-
Resistance: 150.277 | 149.957 | 149.759
-
Pivot: 149.440
-
Support: 149.120 | 148.922 | 148.603
Fundamental Outlook
-
BOJ remains committed to ultra-loose policy, despite inflation staying at 2.9%.
-
The USD remains uncertain as weak labor data influences Fed expectations.
Technical Indicators
-
Stochastic Oscillator (8,3,5): 72 (bullish momentum)
-
WMA (144): Price remains above WMA, indicating an uptrend.
Trade Setups
-
Buy Entry: 149.500 → 🎯 Target: 149.950 | 🚫 SL: 149.300
-
Sell Entry: 149.100 → 🎯 Target: 148.700 | 🚫 SL: 149.300
⚠️ RISK WARNING: This report is for educational purposes only. Trading forex involves significant risk and may not be suitable for all investors. Trade at your own risk. Always use proper risk management strategies to protect your capital.
DAILY MARKET ANALYSIS: AUD/USD – MARCH 19, 2025
📊 AUD/USD TECHNICAL & FUNDAMENTAL OUTLOOK
📈 KEY TECHNICAL LEVELS
🔺 Resistance Levels:
-
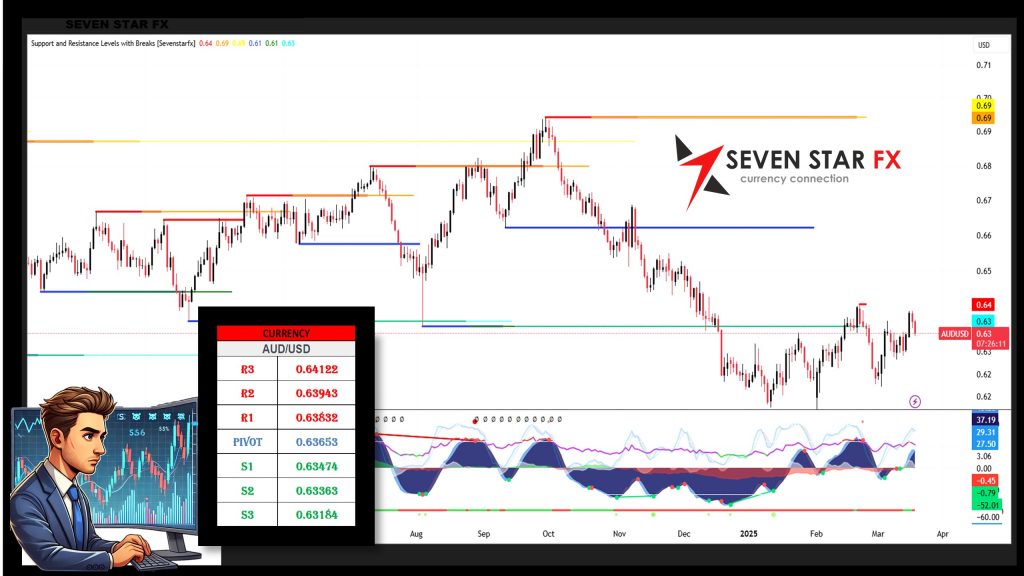
R3: 0.64122
-
R2: 0.63943
-
R1: 0.63832
🔹 Pivot Level:
-
Pivot: 0.63653
🟢 Support Levels:
-
S1: 0.63474
-
S2: 0.63363
-
S3: 0.63184
📌 Trading above the pivot (0.63653) suggests bullish momentum, while dropping below S1 (0.63474) may indicate further downside.
🔍 FUNDAMENTAL ANALYSIS
🏦 RESERVE BANK OF AUSTRALIA (RBA) MONETARY POLICY
The Reserve Bank of Australia (RBA) has signaled a cautious approach to future rate hikes, balancing inflation concerns with economic stability.
📉 AUSTRALIAN ECONOMIC INDICATORS
-
Inflation slowed to 3.8% in February, giving RBA room to hold interest rates steady.
-
Australia’s job market remains stable, with unemployment holding at 4.1%.
🇺🇸 U.S. ECONOMIC FACTORS
-
The U.S. dollar remains volatile due to expectations of a softer Federal Reserve stance.
-
Lower-than-expected U.S. retail sales data have impacted investor sentiment.
🛠️ TECHNICAL ANALYSIS TOOLS
📏 Fibonacci Retracement:
-
Implication: Trading above the pivot (0.63653) could lead to testing higher resistance levels (R1-R3).
-
Break below S1 (0.63474) may increase downside pressure towards S2 and S3.
📊 Bollinger Bands:
-
Setup: Price is fluctuating near the middle band, suggesting neutral to slightly bullish momentum.
-
Implication: A breakout above the upper band may confirm further upside potential, while a move below the lower band could trigger selling pressure.
🌊 Elliott Wave Analysis:
-
Insight: AUD/USD is consolidating before a potential breakout.
-
Outlook: Holding above the pivot could lead to a bullish Wave 5 toward resistance levels.
-
Risk: A break below S1 may signal an extended corrective phase.
⚠️ FINAL THOUGHTS & DISCLAIMER
This analysis provides both technical and fundamental insights to help traders navigate the AUD/USD market. However, due to forex volatility, traders should implement robust risk management and conduct independent research before making decisions.
🚀 Stay informed and trade wisely! 🚀
AUD/USD
Technical Levels
-
Resistance: 0.64122 | 0.63943 | 0.63832
-
Pivot: 0.63653
-
Support: 0.63474 | 0.63363 | 0.63184
Fundamental Outlook
-
RBA may hold rates steady as inflation eases to 3.8%.
-
The USD remains uncertain amid economic data weaknesses.
Technical Indicators
-
Stochastic Oscillator (8,3,5): 60 (moderate bullish momentum)
-
WMA (144): Price remains above WMA, indicating an uptrend.
Trade Setups
-
Buy Entry: 0.63700 → 🎯 Target: 0.64000 | 🚫 SL: 0.63550
-
Sell Entry: 0.63450 → 🎯 Target: 0.63200 | 🚫 SL: 0.63600
⚠️ RISK WARNING: This report is for educational purposes only. Trading forex involves significant risk and may not be suitable for all investors. Trade at your own risk. Always use proper risk management strategies to protect your capital.
DAILY MARKET ANALYSIS: CRUDE OIL – MARCH 19, 2025
📊 CRUDE OIL TECHNICAL & FUNDAMENTAL OUTLOOK
📈 KEY TECHNICAL LEVELS
🔺 Resistance Levels:
-
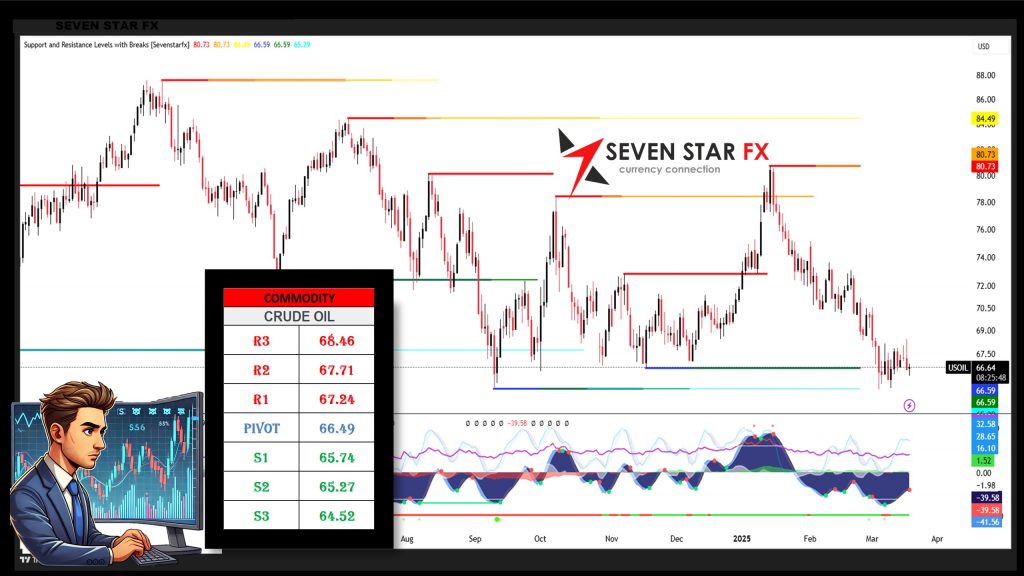
R3: 68.46
-
R2: 67.71
-
R1: 67.24
🔹 Pivot Level:
-
Pivot: 66.49
🟢 Support Levels:
-
S1: 65.74
-
S2: 65.27
-
S3: 64.52
📌 Trading above the pivot (66.49) suggests bullish momentum, while dropping below S1 (65.74) may indicate further downside.
🔍 FUNDAMENTAL ANALYSIS
🏦 OIL MARKET OVERVIEW
Crude oil prices continue to fluctuate as global supply and demand dynamics evolve. OPEC+ production policies and geopolitical tensions remain key drivers of price action.
📉 GLOBAL ECONOMIC FACTORS
-
OPEC+ reaffirmed production cuts, keeping supply tight.
-
U.S. crude oil inventories showed a minor decline, indicating steady demand.
-
Rising geopolitical tensions in the Middle East have contributed to supply concerns.
📉 U.S. ECONOMIC FACTORS
-
The U.S. dollar remains volatile, influencing crude oil pricing.
-
Weaker U.S. job data could impact energy demand expectations.
🛠️ TECHNICAL ANALYSIS TOOLS
📏 Fibonacci Retracement:
-
Implication: Trading above the pivot (66.49) could lead to testing higher resistance levels (R1-R3).
-
Break below S1 (65.74) may increase downside pressure towards S2 and S3.
📊 Bollinger Bands:
-
Setup: Price is near the upper band, suggesting bullish momentum.
-
Implication: A breakout above R1 may confirm further upside, while a drop below S1 could indicate selling pressure.
🌊 Elliott Wave Analysis:
-
Insight: Crude oil is in a consolidation phase before a potential breakout.
-
Outlook: Holding above the pivot could initiate Wave 5 towards higher resistance levels.
-
Risk: A decline below S1 may lead to extended bearish correction.
⚠️ FINAL THOUGHTS & DISCLAIMER
This analysis provides both technical and fundamental insights to help traders navigate the crude oil market. However, due to volatility, traders should implement robust risk management and conduct independent research before making decisions.
🚀 Stay informed and trade wisely! 🚀
CRUDE OIL
Technical Levels
-
Resistance: 68.46 | 67.71 | 67.24
-
Pivot: 66.49
-
Support: 65.74 | 65.27 | 64.52
Fundamental Outlook
-
OPEC+ production cuts remain in place, supporting oil prices.
-
U.S. inventory levels suggest stable demand, influencing market sentiment.
Technical Indicators
-
Stochastic Oscillator (8,3,5): 68 (moderate bullish momentum)
-
WMA (144): Price remains above WMA, indicating an uptrend.
Trade Setups
-
Buy Entry: 66.60 → 🎯 Target: 67.80 | 🚫 SL: 65.90
-
Sell Entry: 65.50 → 🎯 Target: 64.80 | 🚫 SL: 66.20
⚠️ RISK WARNING: This report is for educational purposes only. Trading crude oil involves significant risk and may not be suitable for all investors. Trade at your own risk. Always use proper risk management strategies to protect your capital.
DAILY MARKET ANALYSIS: XAU/USD – MARCH 19, 2025
📊 XAU/USD TECHNICAL & FUNDAMENTAL OUTLOOK
📈 KEY TECHNICAL LEVELS
🔺 Resistance Levels:
-
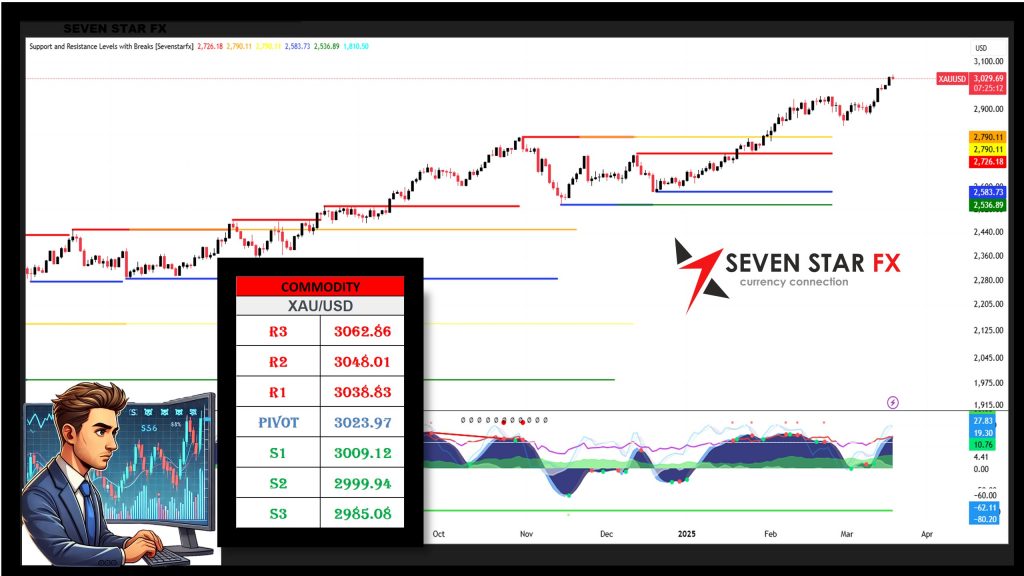
R3: 3062.86
-
R2: 3048.01
-
R1: 3038.83
🔹 Pivot Level:
-
Pivot: 3023.97
🟢 Support Levels:
-
S1: 3009.12
-
S2: 2999.94
-
S3: 2985.08
📌 Trading above the pivot (3023.97) suggests bullish momentum, while dropping below S1 (3009.12) may indicate further downside.
🔍 FUNDAMENTAL ANALYSIS
🏦 GOLD MARKET OVERVIEW
Gold prices remain volatile as investors assess economic data, geopolitical risks, and central bank policies. Demand for gold as a safe-haven asset continues amid ongoing global uncertainties.
📉 GLOBAL ECONOMIC FACTORS
-
Weaker U.S. economic data has increased speculation of a potential Federal Reserve rate cut.
-
Geopolitical tensions in Eastern Europe and the Middle East have driven demand for gold as a risk hedge.
-
Central bank gold purchases continue to provide fundamental support for prices.
📉 U.S. ECONOMIC FACTORS
-
The U.S. dollar has weakened, making gold more attractive for international buyers.
-
Lower Treasury yields support gold prices, as investors shift toward non-yielding assets.
🛠️ TECHNICAL ANALYSIS TOOLS
📏 Fibonacci Retracement:
-
Implication: Trading above the pivot (3023.97) could lead to testing higher resistance levels (R1-R3).
-
Break below S1 (3009.12) may increase downside pressure towards S2 and S3.
📊 Bollinger Bands:
-
Setup: Price is currently near the upper band, suggesting bullish momentum.
-
Implication: A breakout above R1 may confirm further upside potential, while a move below S1 could trigger selling pressure.
🌊 Elliott Wave Analysis:
-
Insight: XAU/USD is in a bullish wave structure with possible continuation towards R3.
-
Outlook: Holding above the pivot could support further gains in Wave 5.
-
Risk: A drop below S1 may signal an extended corrective phase.
⚠️ FINAL THOUGHTS & DISCLAIMER
This analysis provides both technical and fundamental insights to help traders navigate the XAU/USD market. However, due to gold’s volatility, traders should implement robust risk management and conduct independent research before making decisions.
🚀 Stay informed and trade wisely! 🚀
XAU/USD
Technical Levels
-
Resistance: 3062.86 | 3048.01 | 3038.83
-
Pivot: 3023.97
-
Support: 3009.12 | 2999.94 | 2985.08
Fundamental Outlook
-
Weaker U.S. economic data supports higher gold prices.
-
Geopolitical risks continue to drive safe-haven demand.
Technical Indicators
-
Stochastic Oscillator (8,3,5): 74 (bullish momentum)
-
WMA (144): Price remains above WMA, indicating an uptrend.
Trade Setups
-
Buy Entry: 3025.00 → 🎯 Target: 3050.00 | 🚫 SL: 3010.00
-
Sell Entry: 3005.00 → 🎯 Target: 2980.00 | 🚫 SL: 3020.00
⚠️ RISK WARNING: This report is for educational purposes only. Trading gold involves significant risk and may not be suitable for all investors. Trade at your own risk. Always use proper risk management strategies to protect your capital.
DAILY MARKET ANALYSIS: DOW JONES – MARCH 19, 2025
📊 DOW JONES TECHNICAL & FUNDAMENTAL OUTLOOK
📈 KEY TECHNICAL LEVELS
🔺 Resistance Levels:
-
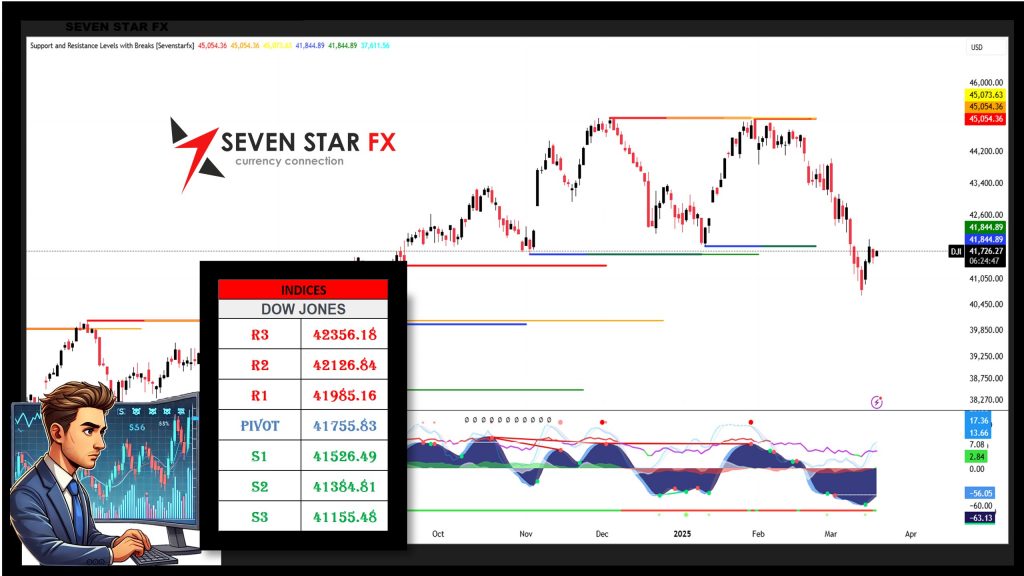
R3: 42356.18
-
R2: 42126.84
-
R1: 41985.16
🔹 Pivot Level:
-
Pivot: 41755.83
🟢 Support Levels:
-
S1: 41526.49
-
S2: 41384.81
-
S3: 41155.48
📌 Trading above the pivot (41755.83) suggests bullish momentum, while dropping below S1 (41526.49) may indicate further downside.
🔍 FUNDAMENTAL ANALYSIS
🏦 U.S. STOCK MARKET OVERVIEW
The Dow Jones Industrial Average (DJIA) has shown resilience amid shifting economic data and investor sentiment. Market movements are being driven by economic policy expectations and corporate earnings.
📉 GLOBAL ECONOMIC FACTORS
-
Investors remain cautious ahead of the Federal Reserve’s next policy meeting, with interest rate expectations impacting sentiment.
-
Mixed corporate earnings reports have led to fluctuating market performance.
-
Geopolitical tensions and trade policies continue to influence equity markets.
📉 U.S. ECONOMIC FACTORS
-
The U.S. labor market remains stable, supporting investor confidence.
-
Inflation data suggests a slowdown, increasing speculation of a potential rate cut by the Federal Reserve.
-
Technology and financial sectors remain key drivers of market performance.
🛠️ TECHNICAL ANALYSIS TOOLS
📏 Fibonacci Retracement:
-
Implication: Trading above the pivot (41755.83) could lead to testing higher resistance levels (R1-R3).
-
Break below S1 (41526.49) may increase downside pressure towards S2 and S3.
📊 Bollinger Bands:
-
Setup: Price is currently fluctuating near the upper band, suggesting bullish momentum.
-
Implication: A breakout above R1 may confirm further upside potential, while a drop below S1 could indicate selling pressure.
🌊 Elliott Wave Analysis:
-
Insight: Dow Jones is currently in a consolidation phase with a potential breakout ahead.
-
Outlook: Holding above the pivot could support further gains in Wave 5.
-
Risk: A drop below S1 may indicate an extended correction phase.
⚠️ FINAL THOUGHTS & DISCLAIMER
This analysis provides both technical and fundamental insights to help traders navigate the Dow Jones market. However, due to market volatility, traders should implement robust risk management and conduct independent research before making decisions.
🚀 Stay informed and trade wisely! 🚀
DOW JONES
Technical Levels
-
Resistance: 42356.18 | 42126.84 | 41985.16
-
Pivot: 41755.83
-
Support: 41526.49 | 41384.81 | 41155.48
Fundamental Outlook
-
Investor sentiment remains cautious ahead of the Federal Reserve’s policy decision.
-
U.S. corporate earnings and economic data continue to shape market direction.
Technical Indicators
-
Stochastic Oscillator (8,3,5): 69 (moderate bullish momentum)
-
WMA (144): Price remains above WMA, indicating an uptrend.
Trade Setups
-
Buy Entry: 41780.00 → 🎯 Target: 42050.00 | 🚫 SL: 41600.00
-
Sell Entry: 41480.00 → 🎯 Target: 41250.00 | 🚫 SL: 41650.00
⚠️ RISK WARNING: This report is for educational purposes only. Trading stocks and indices involves significant risk and may not be suitable for all investors. Trade at your own risk. Always use proper risk management strategies to protect your capital.
DAILY MARKET ANALYSIS: BITCOIN – MARCH 19, 2025
📊 BITCOIN TECHNICAL & FUNDAMENTAL OUTLOOK
📈 KEY TECHNICAL LEVELS
🔺 Resistance Levels:
-
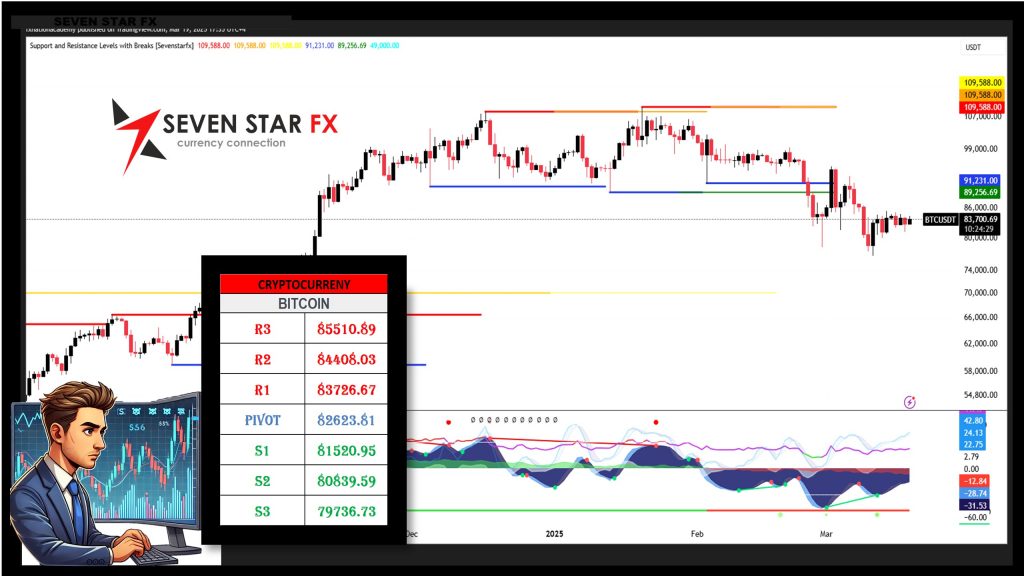
R3: 85,510.89
-
R2: 84,408.03
-
R1: 83,726.67
🔹 Pivot Level:
-
Pivot: 82,623.81
🟢 Support Levels:
-
S1: 81,520.95
-
S2: 80,839.59
-
S3: 79,736.73
📌 Trading above the pivot (82,623.81) suggests bullish momentum, while dropping below S1 (81,520.95) may indicate further downside.
🔍 FUNDAMENTAL ANALYSIS
📈 CRYPTO MARKET OVERVIEW
Bitcoin continues to experience strong volatility as institutional adoption increases and regulatory developments unfold. The market remains highly sensitive to macroeconomic trends and investor sentiment.
📉 GLOBAL ECONOMIC FACTORS
-
Institutional demand remains strong, with major hedge funds increasing Bitcoin holdings.
-
Regulatory developments in the U.S. and Europe continue to shape market sentiment.
-
Geopolitical tensions drive Bitcoin’s appeal as a decentralized store of value.
📉 U.S. ECONOMIC FACTORS
-
The U.S. dollar weakness has provided additional support for Bitcoin prices.
-
Stock market fluctuations and inflation concerns continue to influence crypto investors.
-
Federal Reserve policy expectations impact risk appetite in digital asset markets.
🛠️ TECHNICAL ANALYSIS TOOLS
📏 Fibonacci Retracement:
-
Implication: Trading above the pivot (82,623.81) could lead to testing higher resistance levels (R1-R3).
-
Break below S1 (81,520.95) may increase downside pressure towards S2 and S3.
📊 Bollinger Bands:
-
Setup: Price is fluctuating near the upper band, indicating bullish momentum.
-
Implication: A breakout above R1 may confirm further upside potential, while a drop below S1 could indicate selling pressure.
🌊 Elliott Wave Analysis:
-
Insight: Bitcoin is in a consolidation phase, preparing for a potential breakout.
-
Outlook: Holding above the pivot could initiate Wave 5 toward resistance levels.
-
Risk: A decline below S1 may lead to extended corrective movements.
⚠️ FINAL THOUGHTS & DISCLAIMER
This analysis provides both technical and fundamental insights to help traders navigate the Bitcoin market. However, due to Bitcoin’s volatility, traders should implement robust risk management and conduct independent research before making decisions.
🚀 Stay informed and trade wisely! 🚀
BITCOIN
Technical Levels
-
Resistance: 85,510.89 | 84,408.03 | 83,726.67
-
Pivot: 82,623.81
-
Support: 81,520.95 | 80,839.59 | 79,736.73
Fundamental Outlook
-
Institutional investors continue increasing Bitcoin exposure.
-
Regulatory developments influence market sentiment.
Technical Indicators
-
Stochastic Oscillator (8,3,5): 75 (bullish momentum)
-
WMA (144): Price remains above WMA, indicating an uptrend.
Trade Setups
-
Buy Entry: 82,700.00 → 🎯 Target: 84,500.00 | 🚫 SL: 81,900.00
-
Sell Entry: 81,400.00 → 🎯 Target: 79,900.00 | 🚫 SL: 82,200.00
⚠️ RISK WARNING: This report is for educational purposes only. Trading Bitcoin involves significant risk and may not be suitable for all investors. Trade at your own risk. Always use proper risk management strategies to protect your capital.
————————————————————————————————————————————————————————————————————————————-
Notice: The data presented is derived from technical analysis and does not constitute financial advice. For those trading in forex, consulting a qualified financial advisor prior to making investment decisions is strongly recommended.
Caution: The information above reflects ongoing technical analysis and should not be interpreted as financial advice. Forex trading involves high volatility, and without proper knowledge, you risk losing all your capital. It is essential to consult with a financial advisor before investing.
Advisory: The insights shared are the result of technical analysis and are not intended as financial advice. Forex traders should seek advice from professional financial advisors before making any investment decisions. Remember, the forex market is highly volatile, and trading without adequate knowledge can lead to significant losses.
Important: The analysis provided is for informational purposes only and should not be seen as financial advice. Forex trading carries substantial risks, and it is advisable to consult financial advisors before proceeding with any investments. This content is intended solely for Wealth Management Education purposes.