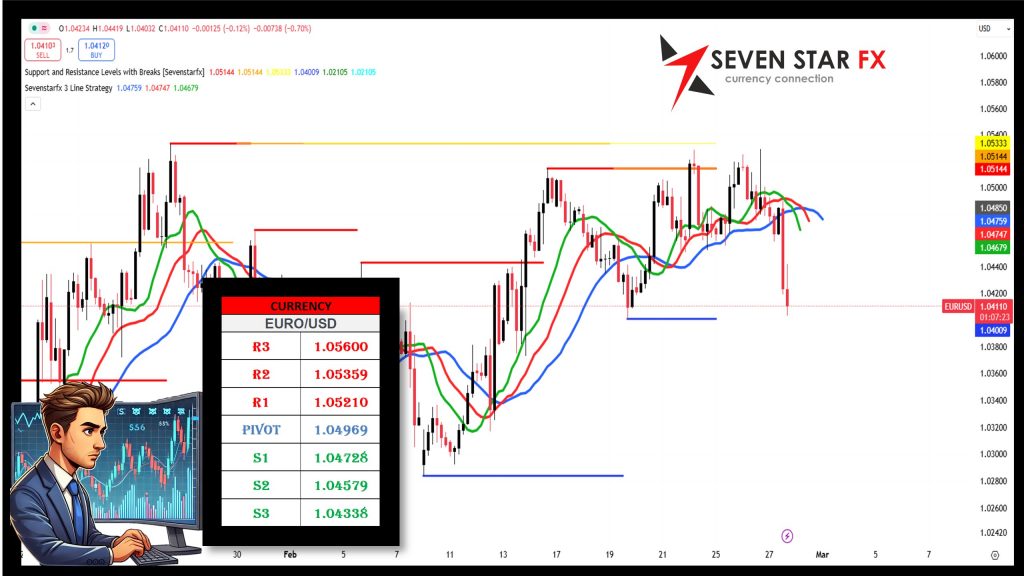
DAILY MARKET ANALYSIS: EUR/USD – FEBRUARY 26, 2025
📊 Key Technical Levels
Resistance Levels:
-
R3: 1.05600
-
R2: 1.05359
-
R1: 1.05210
Pivot Level:
-
1.04969
Support Levels:
-
S1: 1.04728
-
S2: 1.04579
-
S3: 1.04338
These levels serve as significant market markers. Trading above the pivot level (1.04969) indicates bullish momentum, while a break below S1 (1.04728) could signal further downside movement.
🔍 Fundamental Analysis
⚖️ ECB Monetary Policy & Economic Outlook:
-
The European Central Bank (ECB) maintains a cautious stance on monetary policy, holding off on rate cuts due to persistent inflationary pressures.
-
Eurozone economic data suggests moderate growth, but inflation concerns continue to create mixed market sentiment.
💰 US Federal Reserve & USD Dynamics:
-
The Federal Reserve maintains a measured approach to interest rate adjustments, supporting continued USD strength.
-
Despite weaker U.S. economic data, the safe-haven demand for the dollar remains strong, applying additional pressure on the Euro.
🌐 Geopolitical & Market Sentiment:
-
Ongoing U.S.-EU trade negotiations and global economic uncertainties contribute to market volatility.
-
Risk sentiment remains mixed, with traders exercising caution in their EUR/USD positions.
🛠️ Technical Analysis Tools
🌟 Fibonacci Retracement
Implication:
-
Trading above Pivot (1.04969) could lead to a retest of higher resistance levels (R1-R3).
-
A break below S1 (1.04728) may intensify the downside move toward S2 and S3.
🔄 Bollinger Bands
Setup:
-
The price is currently trading near the middle band, suggesting a neutral to slightly bullish trend.
-
The upper band serves as resistance, while the lower band provides support.
Implication:
-
A breakout above the upper band could confirm strong bullish momentum.
-
A move below the lower band might indicate increasing selling pressure.
🔄 Elliott Wave Analysis
Insight:
-
The pair appears to be in a corrective phase (Wave 4).
-
Holding above the pivot could set the stage for a bullish Wave 5 targeting R1-R3.
-
A break below S1 may indicate an extended bearish correction.
⚠️ Final Thoughts & Disclaimer
This report integrates technical and fundamental analysis to provide a comprehensive outlook on the EUR/USD market. Given the volatile nature of forex trading, market participants should exercise caution and implement robust risk management strategies.
Disclaimer: Forex trading carries a high level of risk and may not be suitable for all investors. This analysis is for informational purposes only. Traders should conduct their own research and risk assessments before making any trading decisions.
🚀 Stay informed and trade wisely!
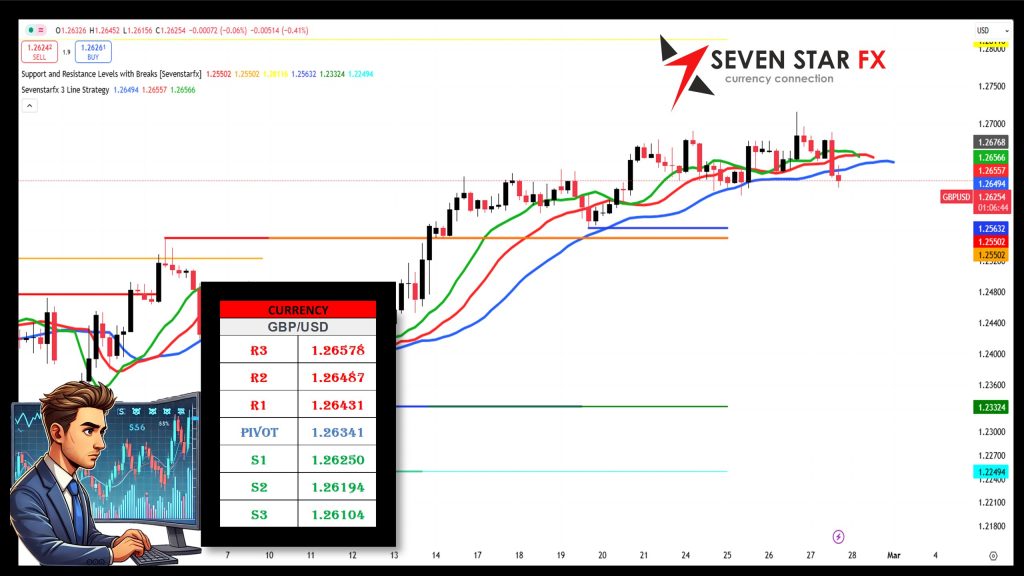
DAILY MARKET ANALYSIS: GBP/USD – FEBRUARY 26, 2025
📊 Key Technical Levels
Resistance Levels:
-
R3: 1.26578
-
R2: 1.26487
-
R1: 1.26431
Pivot Level:
-
1.26341
Support Levels:
-
S1: 1.26250
-
S2: 1.26194
-
S3: 1.26104
These levels serve as significant market markers. Trading above the pivot level (1.26341) indicates bullish momentum, while a break below S1 (1.26250) could signal further downside movement.
🔍 Fundamental Analysis
⚖️ Bank of England (BoE) Monetary Policy & Economic Outlook:
-
The Bank of England (BoE) remains cautious regarding monetary policy, maintaining a wait-and-see approach amid inflation concerns.
-
UK economic data indicates moderate growth, but persistent inflation risks continue to weigh on market sentiment.
💰 US Federal Reserve & USD Dynamics:
-
The Federal Reserve continues its steady approach to interest rates, supporting USD strength.
-
Despite weaker U.S. economic data, demand for the safe-haven USD remains intact, adding pressure on GBP.
🌐 Geopolitical & Market Sentiment:
-
Ongoing UK-EU trade negotiations and global macroeconomic uncertainties contribute to increased volatility.
-
Risk sentiment remains mixed, leading to cautious trading in the GBP/USD pair.
🛠️ Technical Analysis Tools
🌟 Fibonacci Retracement
Implication:
-
Staying above Pivot (1.26341) could lead to a test of higher resistance levels (R1-R3).
-
A break below S1 (1.26250) may accelerate a decline toward S2 and S3.
🔄 Bollinger Bands
Setup:
-
Currently trading near the middle band, suggesting a neutral to slightly bullish trend.
-
The upper band acts as resistance, while the lower band provides support.
Implication:
-
A breakout above the upper band may indicate a strong bullish move.
-
A drop below the lower band could suggest increased selling pressure.
🔄 Elliott Wave Analysis
Insight:
-
The pair appears to be in a corrective phase (Wave 4).
-
Holding above the pivot may set the stage for a bullish Wave 5 toward R1-R3.
-
A drop below S1 could indicate an extended bearish correction.
⚠️ Final Thoughts & Disclaimer
This report integrates technical and fundamental analysis to provide a comprehensive perspective on the GBP/USD market. Given the high volatility of forex trading, market participants should exercise caution and apply sound risk management strategies.
Disclaimer: Forex trading carries a high level of risk and may not be suitable for all investors. This analysis is for informational purposes only. Traders should conduct their own research and risk assessments before making any trading decisions.
🚀 Stay informed and trade wisely!
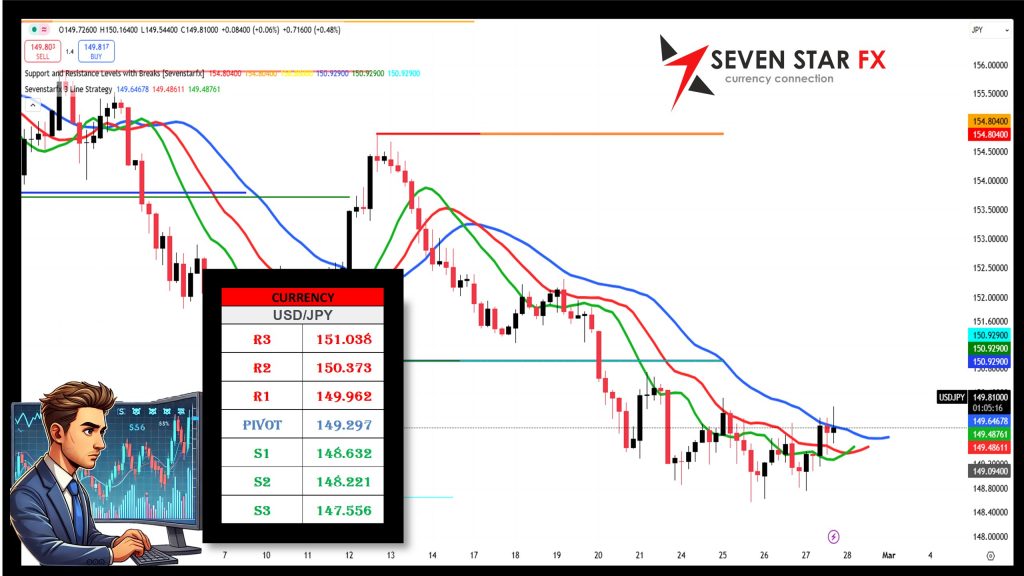
DAILY MARKET ANALYSIS: USD/JPY – FEBRUARY 26, 2025
📊 Key Technical Levels
Resistance Levels:
-
R3: 151.038
-
R2: 150.373
-
R1: 149.962
Pivot Level:
-
149.297
Support Levels:
-
S1: 148.632
-
S2: 148.221
-
S3: 147.556
These levels serve as significant market markers. Trading above the pivot level (149.297) indicates bullish momentum, while a break below S1 (148.632) could signal further downside movement.
🔍 Fundamental Analysis
⚖️ Bank of Japan (BoJ) Monetary Policy & Economic Outlook:
-
The Bank of Japan (BoJ) continues its ultra-loose monetary policy, keeping interest rates near zero to stimulate growth.
-
Inflation in Japan remains moderate, but the BoJ’s cautious approach to tightening keeps the yen under pressure.
💰 US Federal Reserve & USD Dynamics:
-
The Federal Reserve maintains its hawkish stance, keeping USD strength intact.
-
Market sentiment leans toward a stronger dollar, as expectations of further rate hikes persist.
🌐 Geopolitical & Market Sentiment:
-
Concerns over global trade tensions and economic uncertainties contribute to increased volatility in USD/JPY.
-
Risk-off sentiment favors safe-haven flows into the yen, but USD strength limits downside potential.
🛠️ Technical Analysis Tools
🌟 Fibonacci Retracement
Implication:
-
Holding above Pivot (149.297) could trigger a retest of higher resistance levels (R1-R3).
-
A break below S1 (148.632) may increase selling pressure toward S2 and S3.
🔄 Bollinger Bands
Setup:
-
The pair is currently trading near the middle band, indicating neutral to slightly bullish momentum.
-
The upper band serves as resistance, while the lower band provides support.
Implication:
-
A breakout above the upper band could reinforce bullish momentum.
-
A move below the lower band might suggest a stronger bearish shift.
🔄 Elliott Wave Analysis
Insight:
-
The pair appears to be in a corrective phase (Wave 4).
-
Maintaining above the pivot level could lead to a bullish Wave 5 toward R1-R3.
-
A drop below S1 could confirm an extended bearish correction.
⚠️ Final Thoughts & Disclaimer
This report integrates technical and fundamental analysis to provide a comprehensive perspective on the USD/JPY market. Given the high volatility of forex trading, market participants should apply robust risk management strategies.
Disclaimer: Forex trading involves significant risk and may not be suitable for all investors. This analysis is for informational purposes only. Traders should conduct their own research before making any trading decisions.
🚀 Stay informed and trade wisely!
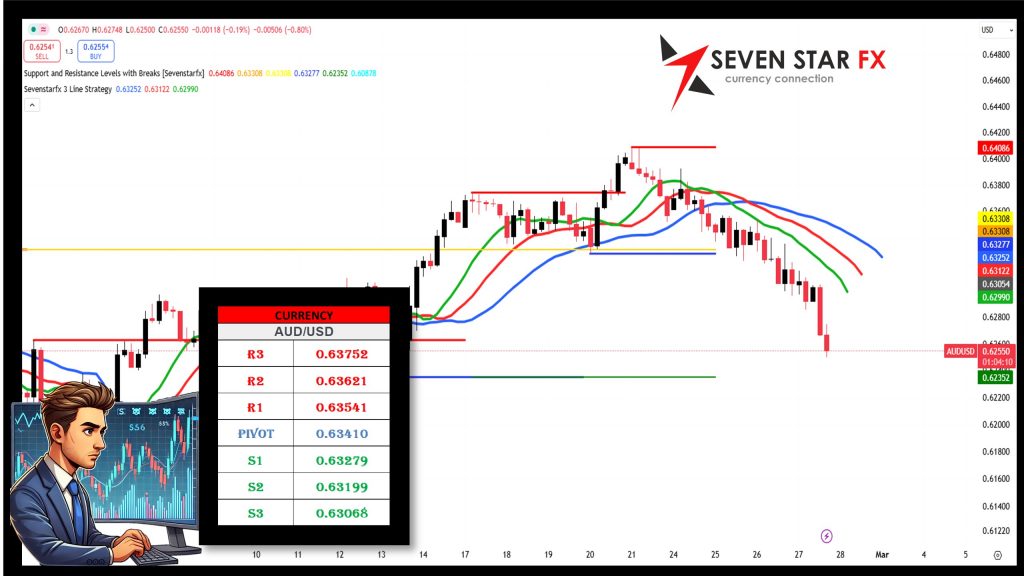
DAILY MARKET ANALYSIS: AUD/USD – FEBRUARY 26, 2025
📊 Key Technical Levels
Resistance Levels:
-
R3: 0.63752
-
R2: 0.63621
-
R1: 0.63541
Pivot Level:
-
0.63410
Support Levels:
-
S1: 0.63279
-
S2: 0.63199
-
S3: 0.63068
These levels serve as significant market markers. Trading above the pivot level (0.63410) indicates bullish momentum, while a break below S1 (0.63279) could signal further downside movement.
🔍 Fundamental Analysis
⚖️ Reserve Bank of Australia (RBA) Monetary Policy & Economic Outlook:
-
The Reserve Bank of Australia (RBA) maintains a cautious stance on monetary policy, balancing inflation control with economic growth concerns.
-
Australian economic data shows steady employment figures, but inflationary risks keep interest rate decisions uncertain.
💰 US Federal Reserve & USD Dynamics:
-
The Federal Reserve continues its strong USD policy, keeping upward pressure on the AUD/USD pair.
-
Despite mixed U.S. economic data, global risk sentiment favors the safe-haven USD, limiting AUD gains.
🌐 Geopolitical & Market Sentiment:
-
Global commodity price fluctuations and China’s economic outlook play a significant role in AUD movements.
-
Risk sentiment remains cautious, with AUD struggling to gain momentum amid broader economic uncertainty.
🛠️ Technical Analysis Tools
🌟 Fibonacci Retracement
Implication:
-
Staying above Pivot (0.63410) could lead to a retest of higher resistance levels (R1-R3).
-
A break below S1 (0.63279) may accelerate a decline toward S2 and S3.
🔄 Bollinger Bands
Setup:
-
Currently trading near the middle band, suggesting a neutral to slightly bearish trend.
-
The upper band serves as resistance, while the lower band provides support.
Implication:
-
A breakout above the upper band could confirm bullish momentum.
-
A drop below the lower band may indicate increased selling pressure.
🔄 Elliott Wave Analysis
Insight:
-
The pair appears to be in a corrective phase (Wave 4).
-
Holding above the pivot may set the stage for a bullish Wave 5 toward R1-R3.
-
A drop below S1 could signal an extended bearish correction.
⚠️ Final Thoughts & Disclaimer
This report integrates technical and fundamental analysis to provide a comprehensive perspective on the AUD/USD market. Given the high volatility of forex trading, market participants should apply strong risk management strategies.
Disclaimer: Forex trading involves substantial risk and may not be suitable for all investors. This analysis is for informational purposes only. Traders should conduct independent research before making trading decisions.
🚀 Stay informed and trade wisely!
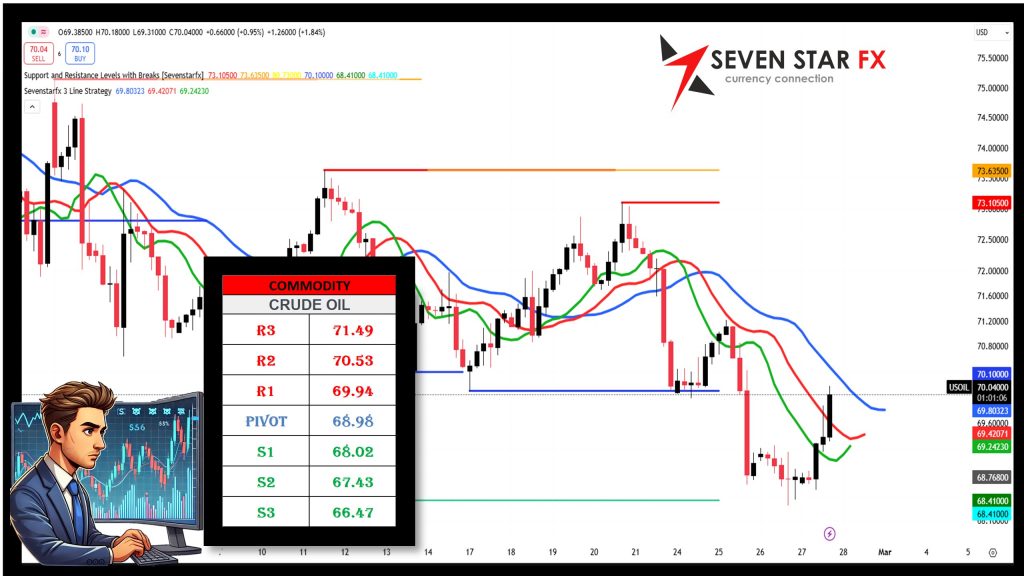
DAILY MARKET ANALYSIS: CRUDE OIL – FEBRUARY 26, 2025
📊 Key Technical Levels
Resistance Levels:
-
R3: 71.49
-
R2: 70.53
-
R1: 69.94
Pivot Level:
-
68.98
Support Levels:
-
S1: 68.02
-
S2: 67.43
-
S3: 66.47
These levels serve as significant market markers. Trading above the pivot level (68.98) indicates bullish momentum, while a break below S1 (68.02) could signal further downside movement.
🔍 Fundamental Analysis
⚖️ OPEC+ Strategy & Global Oil Supply:
-
OPEC+ production decisions remain a key driver of oil prices, with potential supply cuts impacting market sentiment.
-
Rising U.S. crude inventories continue to exert downward pressure on prices, challenging the current uptrend.
💰 US Dollar & Inflation Dynamics:
-
A stronger USD makes crude oil more expensive for foreign buyers, limiting upside potential.
-
Inflation concerns and Federal Reserve rate policies influence oil demand and investor sentiment.
🌐 Geopolitical & Market Sentiment:
-
Escalating Middle East tensions contribute to supply concerns, adding volatility to oil markets.
-
Global economic uncertainties and China’s demand outlook remain critical factors affecting crude oil prices.
🛠️ Technical Analysis Tools
🌟 Fibonacci Retracement
Implication:
-
Staying above Pivot (68.98) could lead to a retest of higher resistance levels (R1-R3).
-
A break below S1 (68.02) may accelerate a decline toward S2 and S3.
🔄 Bollinger Bands
Setup:
-
Currently trading near the middle band, suggesting neutral to slightly bullish momentum.
-
The upper band serves as resistance, while the lower band provides support.
Implication:
-
A breakout above the upper band could reinforce bullish momentum.
-
A move below the lower band may indicate increased selling pressure.
🔄 Elliott Wave Analysis
Insight:
-
The market appears to be in a corrective phase (Wave 4).
-
Holding above the pivot level may set the stage for a bullish Wave 5 toward R1-R3.
-
A drop below S1 could confirm an extended bearish correction.
⚠️ Final Thoughts & Disclaimer
This report integrates technical and fundamental analysis to provide a comprehensive perspective on the Crude Oil market. Given the high volatility of commodity trading, market participants should apply strong risk management strategies.
Disclaimer: Commodity trading involves significant risk and may not be suitable for all investors. This analysis is for informational purposes only. Traders should conduct independent research before making trading decisions.
🚀 Stay informed and trade wisely!
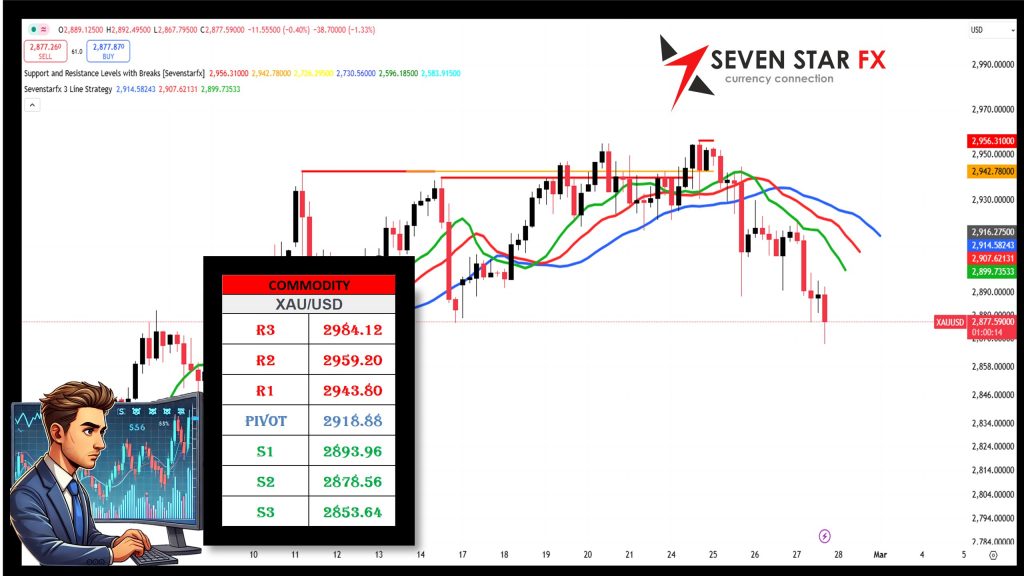
DAILY MARKET ANALYSIS: XAU/USD – FEBRUARY 26, 2025
📊 Key Technical Levels
Resistance Levels:
-
R3: 2984.12
-
R2: 2959.20
-
R1: 2943.80
Pivot Level:
-
2918.88
Support Levels:
-
S1: 2893.96
-
S2: 2878.56
-
S3: 2853.64
These levels serve as significant market markers. Trading above the pivot level (2918.88) indicates bullish momentum, while a break below S1 (2893.96) could signal further downside movement.
🔍 Fundamental Analysis
⚖️ Gold Market & Global Economic Outlook:
-
Gold remains a key safe-haven asset, with demand influenced by inflation fears and central bank policies.
-
Continued central bank purchases support price stability, while investor sentiment remains mixed due to fluctuating economic data.
💰 US Federal Reserve & USD Impact:
-
The Federal Reserve’s monetary policy plays a crucial role in shaping gold prices, with rate hikes pressuring XAU/USD lower.
-
A stronger USD limits upside movement, as gold and the dollar share an inverse correlation.
🌐 Geopolitical & Market Sentiment:
-
Escalating geopolitical risks and concerns over global economic stability drive increased interest in gold.
-
Inflation trends and interest rate expectations remain key factors influencing gold price action.
🛠️ Technical Analysis Tools
🌟 Fibonacci Retracement
Implication:
-
Holding above Pivot (2918.88) could push prices toward R1-R3.
-
A break below S1 (2893.96) could accelerate a decline toward S2 and S3.
🔄 Bollinger Bands
Setup:
-
Currently trading near the middle band, suggesting neutral to slightly bullish momentum.
-
The upper band serves as resistance, while the lower band provides support.
Implication:
-
A breakout above the upper band could reinforce bullish momentum.
-
A move below the lower band may indicate increased selling pressure.
🔄 Elliott Wave Analysis
Insight:
-
The market appears to be in a corrective phase (Wave 4).
-
Holding above the pivot level may set the stage for a bullish Wave 5 toward R1-R3.
-
A drop below S1 could confirm an extended bearish correction.
⚠️ Final Thoughts & Disclaimer
This report integrates technical and fundamental analysis to provide a comprehensive perspective on the XAU/USD (Gold) market. Given the high volatility of commodity trading, market participants should apply strong risk management strategies.
Disclaimer: Commodity trading involves significant risk and may not be suitable for all investors. This analysis is for informational purposes only. Traders should conduct independent research before making trading decisions.
🚀 Stay informed and trade wisely!
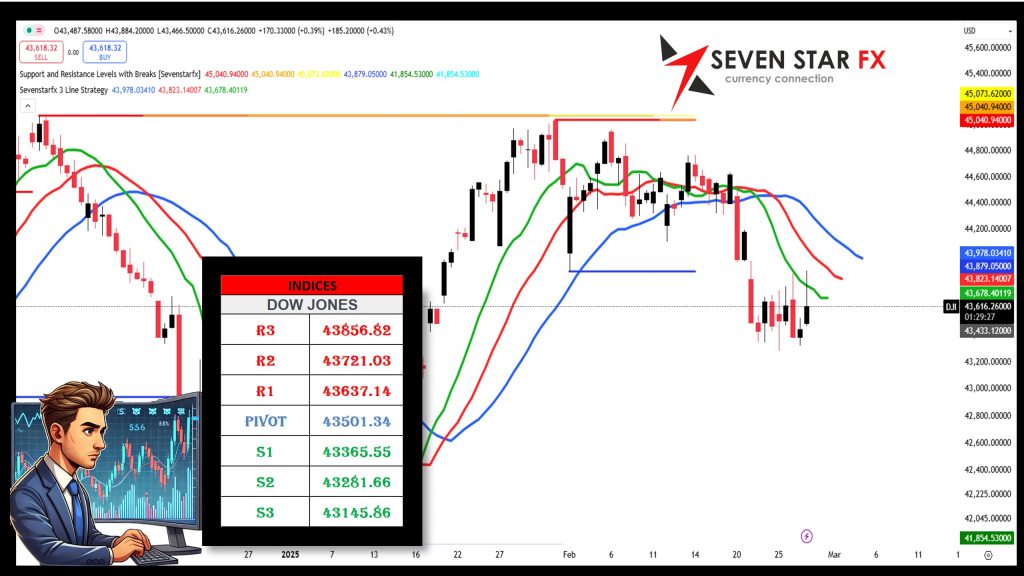
DAILY MARKET ANALYSIS: DOW JONES – FEBRUARY 26, 2025
📊 Key Technical Levels
Resistance Levels:
-
R3: 43856.82
-
R2: 43721.03
-
R1: 43637.14
Pivot Level:
-
43501.34
Support Levels:
-
S1: 43365.55
-
S2: 43281.66
-
S3: 43145.86
These levels serve as significant market markers. Trading above the pivot level (43501.34) indicates bullish momentum, while a break below S1 (43365.55) could signal further downside movement.
🔍 Fundamental Analysis
⚖️ US Economic Outlook & Federal Reserve Policies:
-
The Dow Jones Index remains sensitive to Federal Reserve policy decisions and macroeconomic data.
-
Inflationary pressures and interest rate expectations continue to influence investor sentiment.
💰 Corporate Earnings & Market Trends:
-
Strong earnings reports from key blue-chip companies contribute to the index’s resilience.
-
Technology and consumer sectors play a crucial role in sustaining market growth.
🌐 Geopolitical & Market Sentiment:
-
Global economic uncertainty and trade negotiations between major economies impact market direction.
-
Shifts in risk sentiment affect institutional and retail investor behavior.
🛠️ Technical Analysis Tools
🌟 Fibonacci Retracement
Implication:
-
Holding above Pivot (43501.34) could push prices toward R1-R3.
-
A break below S1 (43365.55) may accelerate a decline toward S2 and S3.
🔄 Bollinger Bands
Setup:
-
The index is currently trading near the middle band, suggesting neutral to slightly bullish momentum.
-
The upper band acts as resistance, while the lower band provides support.
Implication:
-
A breakout above the upper band could reinforce bullish momentum.
-
A move below the lower band may indicate increased selling pressure.
🔄 Elliott Wave Analysis
Insight:
-
The market appears to be in a corrective phase (Wave 4).
-
Holding above the pivot level may set the stage for a bullish Wave 5 toward R1-R3.
-
A drop below S1 could confirm an extended bearish correction.
⚠️ Final Thoughts & Disclaimer
This report integrates technical and fundamental analysis to provide a comprehensive perspective on the Dow Jones Index. Given the high volatility of equity markets, traders should apply strong risk management strategies.
Disclaimer: Stock market trading involves significant risk and may not be suitable for all investors. This analysis is for informational purposes only. Traders should conduct independent research before making trading decisions.
🚀 Stay informed and trade wisely!
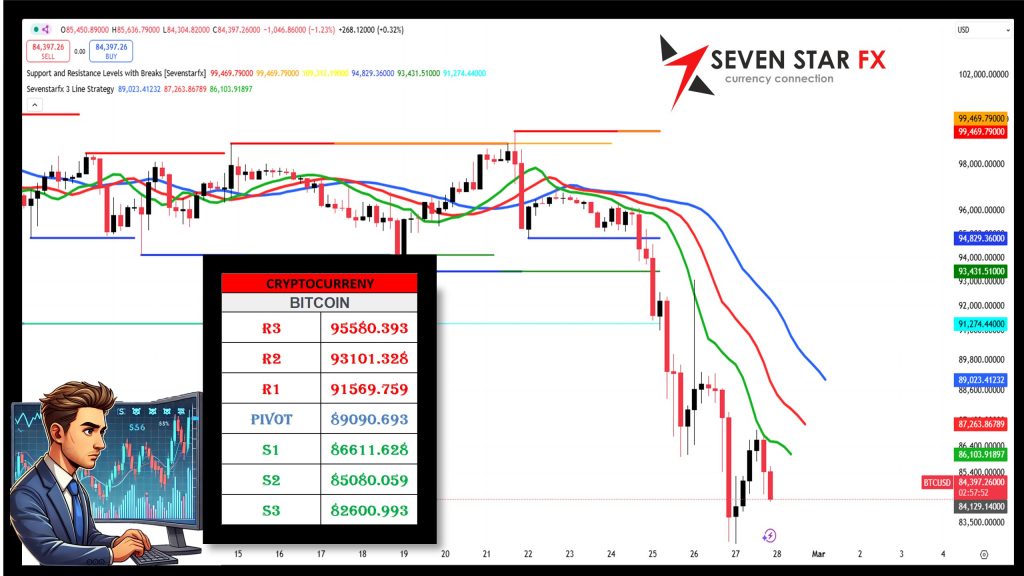
DAILY MARKET ANALYSIS: BITCOIN – FEBRUARY 26, 2025
📊 Key Technical Levels
Resistance Levels:
-
R3: 95580.39
-
R2: 93101.32
-
R1: 91569.75
Pivot Level:
-
89090.69
Support Levels:
-
S1: 86611.62
-
S2: 85080.05
-
S3: 82600.99
These levels serve as significant market markers. Trading above the pivot level (89090.69) indicates bullish momentum, while a break below S1 (86611.62) could signal further downside movement.
🔍 Fundamental Analysis
⚖️ Bitcoin Market & Institutional Adoption:
-
Bitcoin’s price movement remains closely tied to institutional adoption and broader market sentiment.
-
Increasing ETF approvals and corporate investments continue to drive demand for BTC.
💰 Macroeconomic Factors & USD Impact:
-
The Federal Reserve’s monetary policy affects Bitcoin’s valuation, with rate hikes impacting risk assets like BTC.
-
A strong USD could weigh on Bitcoin’s upward momentum, while inflation hedging supports demand.
🌐 Geopolitical & Market Sentiment:
-
Global financial uncertainty and regulatory developments impact Bitcoin volatility.
-
Investor sentiment remains mixed, with growing interest from institutional players countered by periodic regulatory concerns.
🛠️ Technical Analysis Tools
🌟 Fibonacci Retracement
Implication:
-
Holding above Pivot (89090.69) could push prices toward R1-R3.
-
A break below S1 (86611.62) may accelerate a decline toward S2 and S3.
🔄 Bollinger Bands
Setup:
-
Currently trading near the middle band, suggesting neutral to slightly bullish momentum.
-
The upper band serves as resistance, while the lower band provides support.
Implication:
-
A breakout above the upper band could reinforce bullish momentum.
-
A move below the lower band may indicate increased selling pressure.
🔄 Elliott Wave Analysis
Insight:
-
The market appears to be in a corrective phase (Wave 4).
-
Holding above the pivot level may set the stage for a bullish Wave 5 toward R1-R3.
-
A drop below S1 could confirm an extended bearish correction.
⚠️ Final Thoughts & Disclaimer
This report integrates technical and fundamental analysis to provide a comprehensive perspective on the Bitcoin market. Given the high volatility of cryptocurrency markets, traders should apply strong risk management strategies.
Disclaimer: Cryptocurrency trading involves significant risk and may not be suitable for all investors. This analysis is for informational purposes only. Traders should conduct independent research before making trading decisions.
🚀 Stay informed and trade wisely!
————————————————————————————————————————————————————————————————————————————-
Notice: The data presented is derived from technical analysis and does not constitute financial advice. For those trading in forex, consulting a qualified financial advisor prior to making investment decisions is strongly recommended.
Caution: The information above reflects ongoing technical analysis and should not be interpreted as financial advice. Forex trading involves high volatility, and without proper knowledge, you risk losing all your capital. It is essential to consult with a financial advisor before investing.
Advisory: The insights shared are the result of technical analysis and are not intended as financial advice. Forex traders should seek advice from professional financial advisors before making any investment decisions. Remember, the forex market is highly volatile, and trading without adequate knowledge can lead to significant losses.
Important: The analysis provided is for informational purposes only and should not be seen as financial advice. Forex trading carries substantial risks, and it is advisable to consult financial advisors before proceeding with any investments. This content is intended solely for Wealth Management Education purposes.