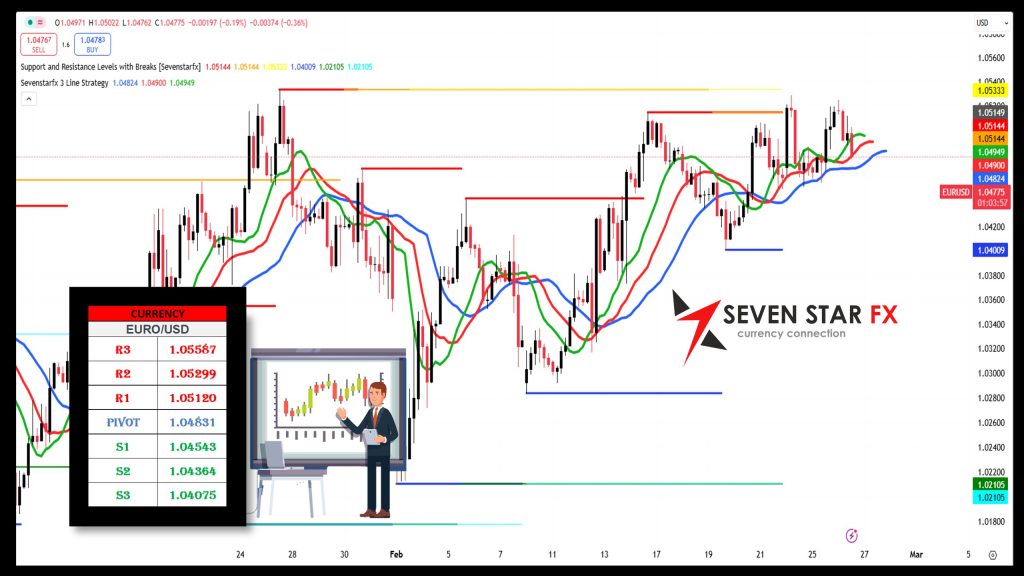
📊 Daily Report: EURO/USD – February 25, 2025
📊 Key Technical Levels
Resistance:
-
R3: 1.05587
-
R2: 1.05299
-
R1: 1.05120
Pivot:
-
1.04831
Support:
-
S1: 1.04543
-
S2: 1.04364
-
S3: 1.04075
These levels act as critical markers in the market. Trading above the pivot (1.04831) signals strength, whereas a break below S1 (1.04543) could trigger further downside pressure.
🔍 Fundamental Analysis
⚖️ ECB Monetary Policy & Economic Outlook:
-
The European Central Bank (ECB) remains cautious in its monetary policy, refraining from rate cuts due to persistent inflation concerns.
-
Eurozone data indicates moderate economic growth, but inflation risks keep investor sentiment mixed.
💰 US Federal Reserve & USD Dynamics:
-
The Federal Reserve continues its measured approach to rate adjustments, supporting a strong USD.
-
Despite some soft US economic data, safe-haven demand for the dollar remains intact, adding pressure on the Euro.
🌐 Geopolitical & Market Sentiment:
-
Ongoing US-EU trade discussions and global economic uncertainties contribute to market volatility.
-
Mixed risk sentiment and safe-haven flows influence cautious trading in the EUR/USD pair.
🛠️ Technical Analysis Tools
🌟 Fibonacci Retracement
-
Implication:
-
Staying above Pivot (1.04831) could lead to a test of higher resistance levels.
-
A break below S1 (1.04543) may accelerate a decline toward S2 and S3.
-
🔄 Bollinger Bands
-
Setup:
-
Currently trading near the middle band, suggesting a neutral-to-slightly bullish trend.
-
The upper band acts as resistance, while the lower band serves as support.
-
-
Implication:
-
A breakout above the upper band may indicate stronger upward momentum.
-
A move below the lower band could signal increased selling pressure.
-
🔄 Elliott Wave Analysis
-
Insight:
-
The pair appears to be in a corrective phase (Wave 4).
-
Holding above the pivot could set the stage for a bullish Wave 5 toward R1-R3.
-
A drop below S1 may indicate an extended bearish correction.
-
⚠️ Final Thoughts & Disclaimer
This report integrates technical and fundamental insights to provide a well-rounded perspective on the EUR/USD market. Given the dynamic nature of forex trading, market participants should stay alert and employ sound risk management strategies.
Disclaimer: Forex trading is highly volatile and carries significant risk. This analysis is for informational purposes only. Traders should conduct their own research and risk assessment before making any trading decisions.
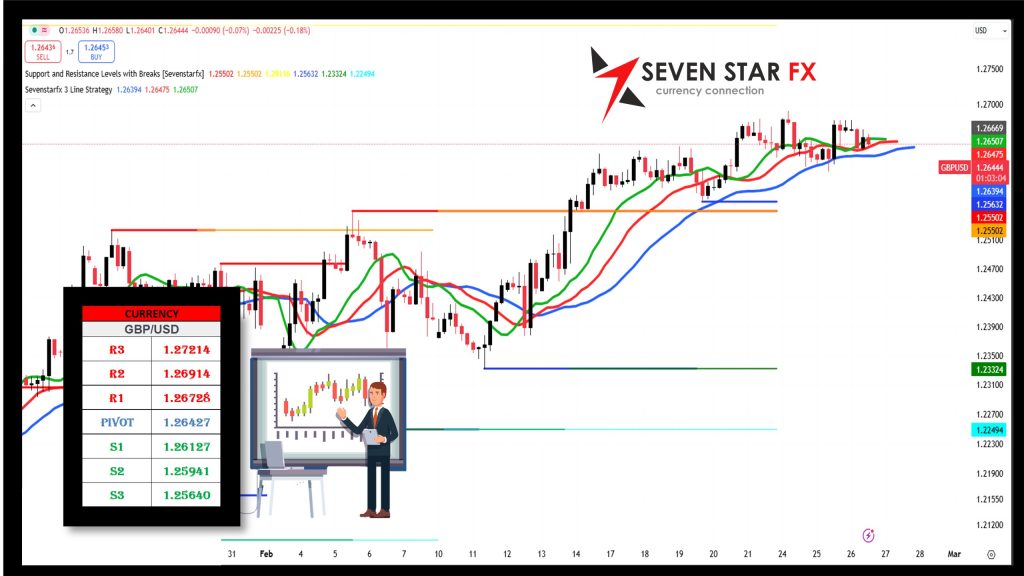
📊 Daily Report: GBP/USD – February 25, 2025
📊 Key Technical Levels
Resistance:
-
R3: 1.27214
-
R2: 1.26914
-
R1: 1.26728
Pivot:
-
1.26427
Support:
-
S1: 1.26127
-
S2: 1.25941
-
S3: 1.25640
These levels act as critical markers in the market. Trading above the pivot (1.26427) signals strength, whereas a break below S1 (1.26127) could trigger further downside pressure.
🔍 Fundamental Analysis
⚖️ Bank of England (BoE) Monetary Policy & Economic Outlook:
-
The Bank of England (BoE) remains cautious regarding interest rate decisions, maintaining a measured approach in response to inflation dynamics.
-
UK economic data suggests a moderate growth trajectory, but inflationary pressures continue to shape monetary policy expectations.
💰 US Federal Reserve & USD Dynamics:
-
The Federal Reserve continues to support a strong USD amid policy stability, creating headwinds for GBP/USD.
-
US economic performance remains a key driver of sentiment, with investors closely watching inflation trends and job market signals.
🌐 Geopolitical & Market Sentiment:
-
Ongoing UK-EU trade discussions and broader global uncertainties introduce additional volatility to GBP/USD.
-
Market sentiment remains cautious, with risk appetite fluctuating based on macroeconomic developments.
🛠️ Technical Analysis Tools
🌟 Fibonacci Retracement
-
Implication:
-
Remaining above Pivot (1.26427) could lead to tests of higher resistance levels.
-
A break below S1 (1.26127) may accelerate a move toward S2 and S3.
-
🔄 Bollinger Bands
-
Setup:
-
Trading near the middle band suggests a neutral to slightly bullish stance.
-
The upper band acts as resistance, while the lower band offers support.
-
-
Implication:
-
A move above the upper band could signal increased bullish momentum.
-
A drop below the lower band may indicate a shift to bearish conditions.
-
🔄 Elliott Wave Analysis
-
Insight:
-
The pair appears to be in a corrective phase (Wave 4).
-
Holding above the pivot may set the stage for a bullish Wave 5 towards R1-R3.
-
A break below S1 could signal a deeper corrective move.
-
⚠️ Final Thoughts & Disclaimer
This report provides a blend of technical and fundamental insights, offering a comprehensive outlook on GBP/USD market conditions. Given forex market volatility, traders should apply robust risk management strategies.
Disclaimer: Forex trading involves significant risk. This analysis is for educational purposes only. Traders should conduct their own due diligence before making investment decisions.
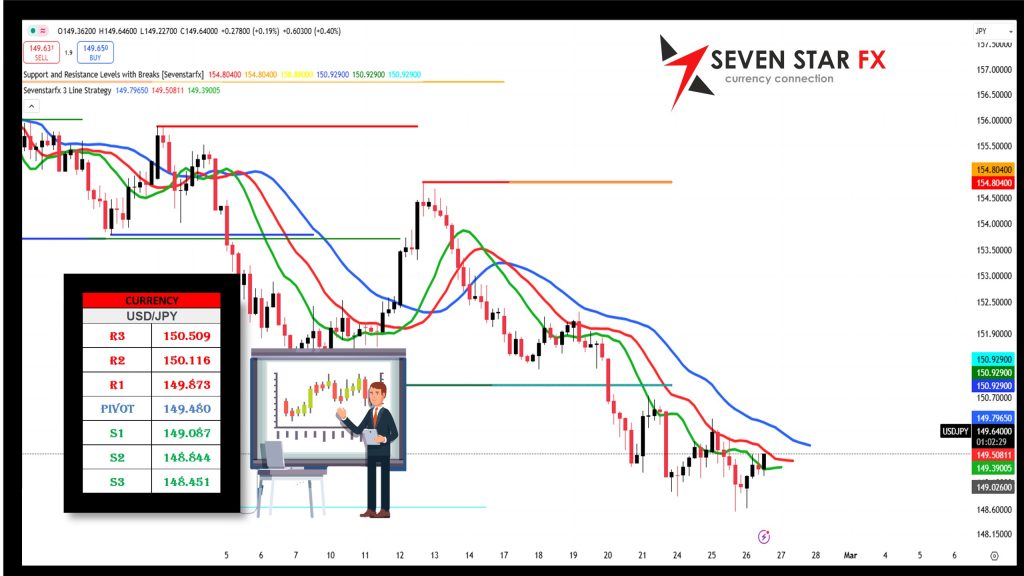
📊 Daily Report: USD/JPY – February 25, 2025
📊 Key Technical Levels
Resistance:
-
R3: 150.509
-
R2: 150.116
-
R1: 149.873
Pivot:
-
149.480
Support:
-
S1: 149.087
-
S2: 148.844
-
S3: 148.451
These levels act as crucial markers in the market. Trading above the pivot (149.480) indicates strength, whereas a break below S1 (149.087) could lead to further downside momentum.
🔍 Fundamental Analysis
⚖️ Bank of Japan (BoJ) Monetary Policy & Economic Outlook:
-
The Bank of Japan (BoJ) continues its ultra-loose monetary policy, maintaining low-interest rates to support economic recovery.
-
Japanese economic indicators suggest moderate inflation growth, but policy adjustments remain unlikely in the near term.
💰 US Federal Reserve & USD Dynamics:
-
The Federal Reserve’s cautious approach to interest rates has helped sustain USD strength.
-
Mixed US economic data, particularly regarding inflation and employment, influences short-term market sentiment.
🌐 Geopolitical & Market Sentiment:
-
US-Japan trade relations and broader global economic conditions continue to impact market sentiment.
-
Investors remain attentive to central bank announcements and macroeconomic reports.
🛠️ Technical Analysis Tools
🌟 Fibonacci Retracement
-
Implication:
-
Holding above Pivot (149.480) may drive price action towards higher resistance levels.
-
A decline below S1 (149.087) could signal increased selling pressure, leading to tests of S2 and S3.
-
🔄 Bollinger Bands
-
Setup:
-
Currently trading near the middle band, reflecting a neutral stance.
-
The upper band serves as a resistance level, while the lower band provides support.
-
-
Implication:
-
A break above the upper band may indicate a bullish momentum shift.
-
A move below the lower band suggests a potential bearish trend.
-
🔄 Elliott Wave Analysis
-
Insight:
-
The pair appears to be in a corrective phase (Wave 4).
-
Maintaining above the pivot could set the stage for Wave 5 toward R1-R3.
-
A drop below S1 might signal an extended corrective move.
-
⚠️ Final Thoughts & Disclaimer
This report provides a combination of technical and fundamental insights to offer a well-rounded outlook on USD/JPY market conditions. Given the volatility in forex markets, traders should implement proper risk management strategies.
Disclaimer: Forex trading involves significant risks. This analysis is for informational purposes only. Traders should conduct their own research before making any financial decisions.
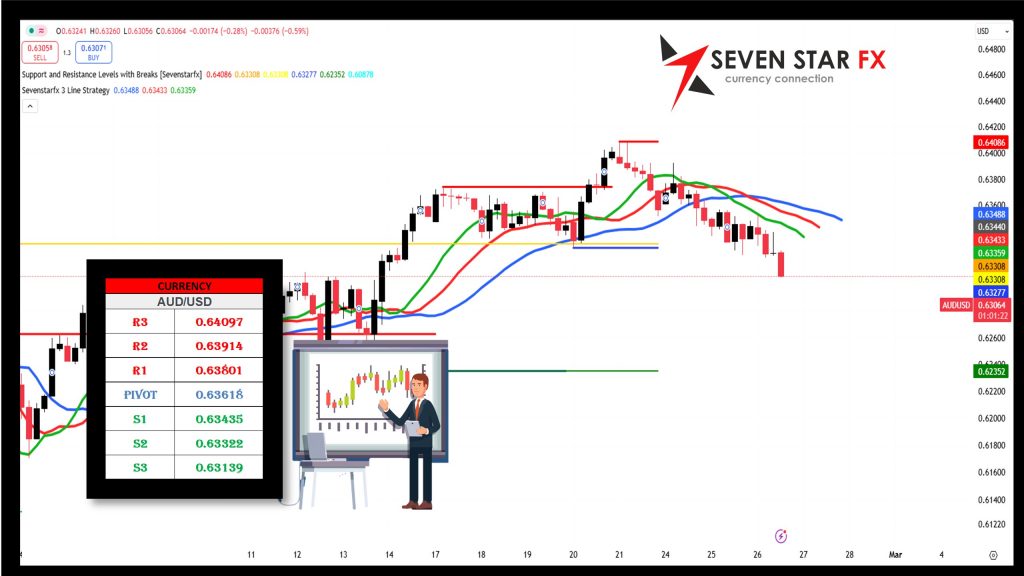
📊 Daily Report: AUD/USD – February 25, 2025
📊 Key Technical Levels
Resistance:
-
R3: 0.64097
-
R2: 0.63914
-
R1: 0.63801
Pivot:
-
0.63618
Support:
-
S1: 0.63435
-
S2: 0.63322
-
S3: 0.63139
These levels serve as crucial indicators for market movement. Trading above the pivot (0.63618) signals bullish momentum, while a decline below S1 (0.63435) could lead to further downside pressure.
🔍 Fundamental Analysis
⚖️ Reserve Bank of Australia (RBA) Monetary Policy & Economic Outlook:
-
The Reserve Bank of Australia (RBA) continues its data-driven approach to monetary policy, with a focus on inflation control and economic growth.
-
Recent Australian economic data indicates stable employment levels, but inflation concerns persist, impacting interest rate expectations.
💰 US Federal Reserve & USD Dynamics:
-
The Federal Reserve’s monetary policy stance remains a dominant factor in influencing the AUD/USD pair.
-
Strength in the US dollar due to cautious Fed policies exerts downward pressure on the Australian dollar.
🌐 Geopolitical & Market Sentiment:
-
Australia-China trade relations and global risk sentiment play a significant role in AUD performance.
-
Investor sentiment fluctuates based on commodity price movements and global macroeconomic indicators.
🛠️ Technical Analysis Tools
🌟 Fibonacci Retracement
-
Implication:
-
Staying above Pivot (0.63618) may drive price action toward higher resistance levels.
-
A break below S1 (0.63435) could lead to further declines toward S2 and S3.
-
🔄 Bollinger Bands
-
Setup:
-
Trading near the middle band suggests neutral to slightly bullish momentum.
-
The upper band serves as resistance, while the lower band offers support.
-
-
Implication:
-
A move above the upper band could indicate strengthening bullish momentum.
-
A drop below the lower band may suggest increased bearish sentiment.
-
🔄 Elliott Wave Analysis
-
Insight:
-
The pair appears to be in a corrective phase (Wave 4).
-
Holding above the pivot could support a bullish Wave 5 toward R1-R3.
-
A move below S1 might indicate an extended correction.
-
⚠️ Final Thoughts & Disclaimer
This report provides a combination of technical and fundamental insights to offer a well-rounded outlook on AUD/USD market conditions. Given the forex market’s volatility, traders should implement strong risk management strategies.
Disclaimer: Forex trading involves significant risks. This analysis is for informational purposes only. Traders should conduct their own research before making any financial decisions.
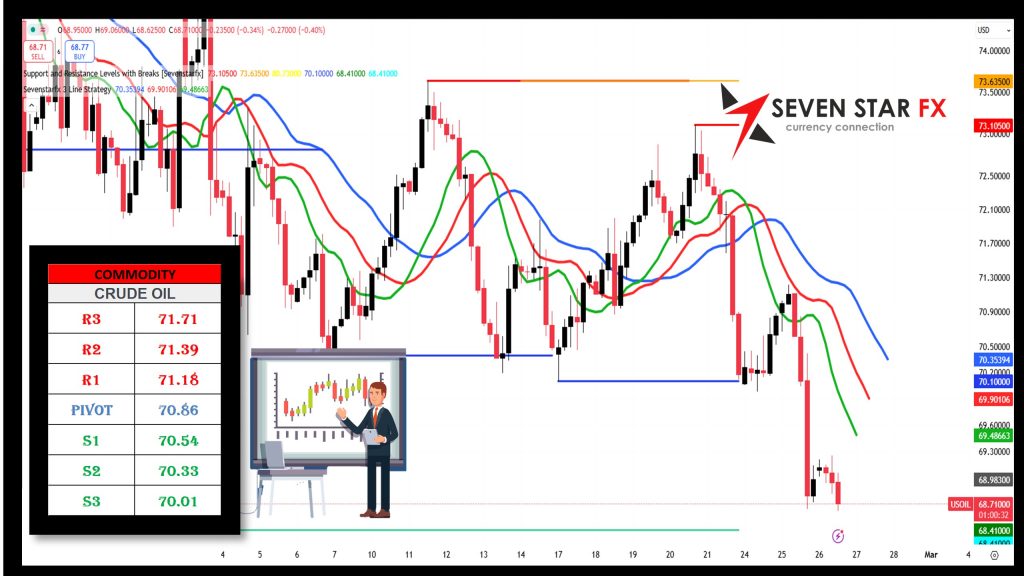
📊 Daily Report: Crude Oil – February 25, 2025
📊 Key Technical Levels
Resistance:
-
R3: 71.71
-
R2: 71.39
-
R1: 71.18
Pivot:
-
70.86
Support:
-
S1: 70.54
-
S2: 70.33
-
S3: 70.01
These levels serve as crucial indicators for market movement. Trading above the pivot (70.86) signals bullish momentum, while a decline below S1 (70.54) could lead to further downside pressure.
🔍 Fundamental Analysis
⚖️ Supply & Demand Dynamics:
-
OPEC+ production strategies continue to influence crude oil prices, with expectations of output adjustments impacting sentiment.
-
US shale production remains a key variable, affecting supply levels and price movements.
💰 Global Economic Factors:
-
Concerns over global economic growth and energy demand fluctuations are shaping market trends.
-
Inflationary pressures and central bank policies, particularly from the Federal Reserve, impact overall commodity markets.
🌐 Geopolitical & Market Sentiment:
-
Ongoing Middle East tensions and global trade policies continue to affect crude oil volatility.
-
Investor sentiment remains cautious, with demand forecasts influencing price direction.
🛠️ Technical Analysis Tools
🌟 Fibonacci Retracement
-
Implication:
-
Staying above Pivot (70.86) could lead to a test of higher resistance levels.
-
A drop below S1 (70.54) may trigger further downside toward S2 and S3.
-
🔄 Bollinger Bands
-
Setup:
-
Trading near the middle band suggests neutral to slightly bullish momentum.
-
The upper band acts as resistance, while the lower band offers support.
-
-
Implication:
-
A breakout above the upper band may indicate bullish strength.
-
A move below the lower band could signal a bearish trend.
-
🔄 Elliott Wave Analysis
-
Insight:
-
The market appears to be in a corrective phase (Wave 4).
-
Holding above the pivot could set the stage for Wave 5 toward R1-R3.
-
A move below S1 may indicate an extended correction.
-
⚠️ Final Thoughts & Disclaimer
This report provides a combination of technical and fundamental insights to offer a well-rounded outlook on crude oil market conditions. Given the volatility in commodity markets, traders should implement strong risk management strategies.
Disclaimer: Commodity trading involves significant risks. This analysis is for informational purposes only. Traders should conduct their own research before making any financial decisions.
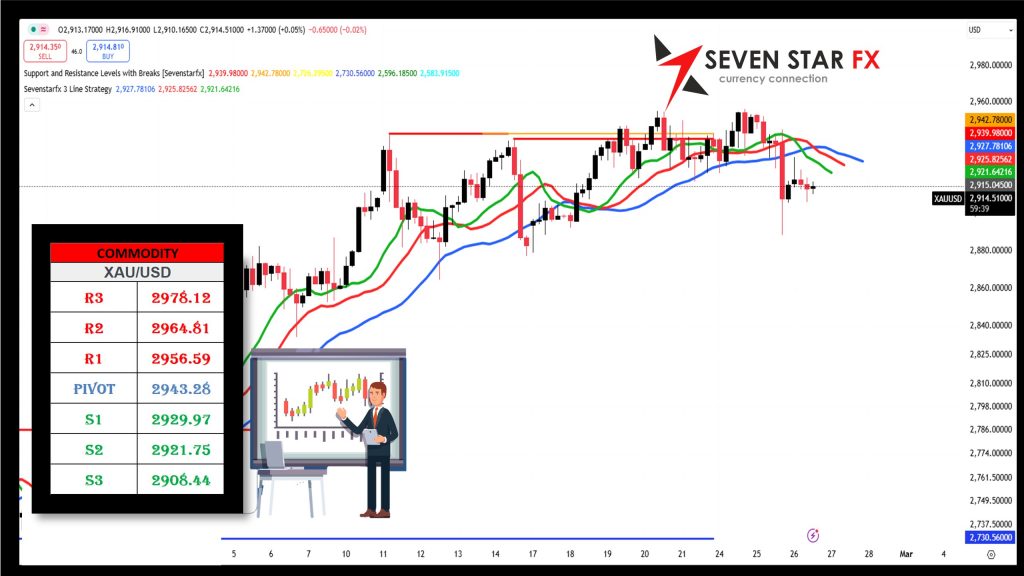
📊 Daily Report: XAU/USD – February 25, 2025
📊 Key Technical Levels
Resistance:
-
R3: 2978.12
-
R2: 2964.81
-
R1: 2956.59
Pivot:
-
2943.28
Support:
-
S1: 2929.97
-
S2: 2921.75
-
S3: 2908.44
These levels act as key indicators in the market. Trading above the pivot (2943.28) signals bullish momentum, while a break below S1 (2929.97) could indicate further downside pressure.
🔍 Fundamental Analysis
⚖️ Global Economic Factors:
-
Inflation trends and Federal Reserve policy decisions continue to shape gold prices.
-
The US Dollar’s strength remains a key factor in determining gold’s direction.
💰 Market Demand & Central Bank Influence:
-
Increased central bank gold purchases provide strong demand support.
-
Geopolitical uncertainties contribute to gold’s safe-haven appeal.
🌐 Investor Sentiment:
-
Risk-off sentiment boosts gold’s attractiveness amid stock market volatility.
-
Traders remain focused on inflationary data and interest rate movements.
🛠️ Technical Analysis Tools
🌟 Fibonacci Retracement
-
Implication:
-
Holding above Pivot (2943.28) may drive price action toward higher resistance levels.
-
A break below S1 (2929.97) may increase selling pressure, leading to tests of S2 and S3.
-
🔄 Bollinger Bands
-
Setup:
-
Trading near the middle band suggests neutral to slightly bullish momentum.
-
The upper band acts as resistance, while the lower band offers support.
-
-
Implication:
-
A move above the upper band could indicate stronger buying momentum.
-
A break below the lower band might suggest a shift to bearish conditions.
-
🔄 Elliott Wave Analysis
-
Insight:
-
The market appears to be in a corrective phase (Wave 4).
-
Holding above the pivot may lead to a bullish Wave 5 targeting R1-R3.
-
A decline below S1 may indicate an extended correction.
-
⚠️ Final Thoughts & Disclaimer
This report provides a combination of technical and fundamental insights to offer a comprehensive outlook on XAU/USD market conditions. Given the volatility in precious metals, traders should apply strong risk management strategies.
Disclaimer: Forex and commodity trading involve significant risks. This analysis is for informational purposes only. Traders should conduct their own research before making financial decisions.
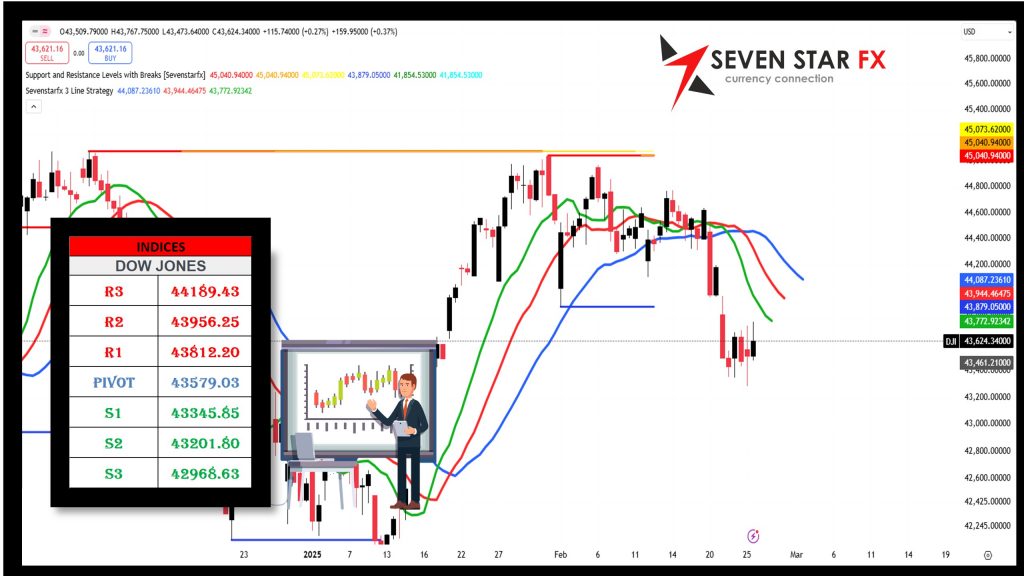
📊 Daily Report: DOW JONES – February 25, 2025
📊 Key Technical Levels
Resistance:
-
R3: 44189.43
-
R2: 43956.25
-
R1: 43812.20
Pivot:
-
43579.03
Support:
-
S1: 43345.85
-
S2: 43201.80
-
S3: 42968.63
These levels serve as crucial markers in the market. Trading above the pivot (43579.03) signals bullish momentum, while a decline below S1 (43345.85) could lead to further downside pressure.
🔍 Fundamental Analysis
⚖️ US Economic Outlook:
-
The Federal Reserve’s policy stance remains a key driver for equity market movements.
-
Economic growth indicators, including GDP and employment reports, continue to influence investor sentiment.
💰 Corporate Earnings & Market Sentiment:
-
Ongoing corporate earnings reports shape short-term market direction.
-
Investor sentiment remains mixed amid inflationary concerns and geopolitical risks.
🌐 Global Market Influences:
-
International trade dynamics and economic conditions in major economies impact the Dow Jones index.
-
The US dollar strength and bond yield fluctuations contribute to overall market performance.
🛠️ Technical Analysis Tools
🌟 Fibonacci Retracement
-
Implication:
-
Holding above Pivot (43579.03) may drive price action toward higher resistance levels.
-
A break below S1 (43345.85) may trigger further declines toward S2 and S3.
-
🔄 Bollinger Bands
-
Setup:
-
Trading near the middle band suggests neutral to slightly bullish momentum.
-
The upper band acts as resistance, while the lower band offers support.
-
-
Implication:
-
A move above the upper band could indicate stronger bullish momentum.
-
A drop below the lower band may suggest increasing bearish pressure.
-
🔄 Elliott Wave Analysis
-
Insight:
-
The market appears to be in a corrective phase (Wave 4).
-
Holding above the pivot could set the stage for bullish Wave 5 toward R1-R3.
-
A move below S1 may indicate a further corrective downturn.
-
⚠️ Final Thoughts & Disclaimer
This report provides a combination of technical and fundamental insights to offer a comprehensive outlook on Dow Jones market conditions. Given the volatility in equity markets, traders should implement strong risk management strategies.
Disclaimer: Stock market trading involves significant risks. This analysis is for informational purposes only. Traders should conduct their own research before making financial decisions.
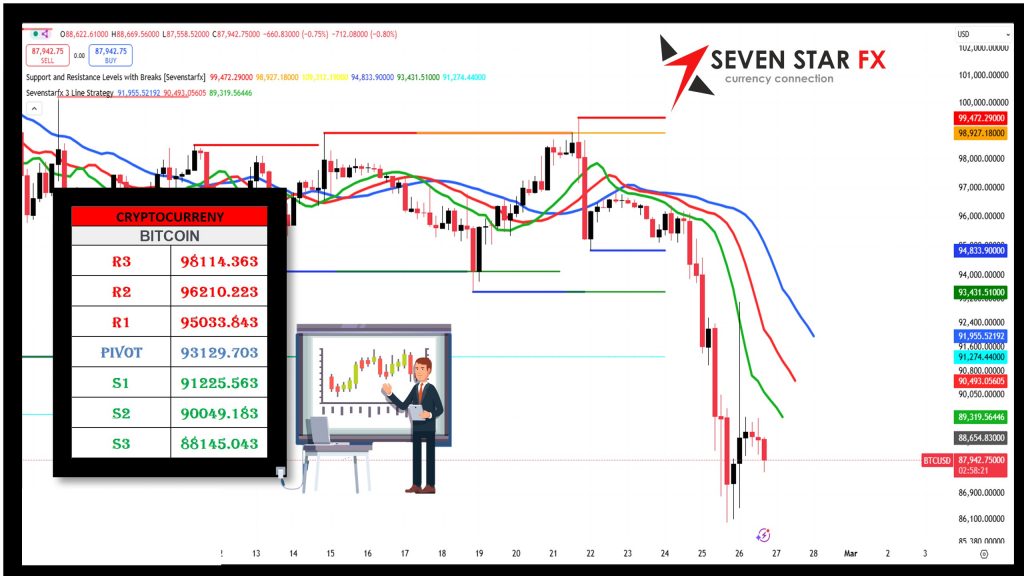
📊 Daily Report: BITCOIN – February 25, 2025
📊 Key Technical Levels
Resistance:
-
R3: 98114.363
-
R2: 96210.223
-
R1: 95033.843
Pivot:
-
93129.703
Support:
-
S1: 91225.563
-
S2: 90049.183
-
S3: 88145.043
These levels serve as crucial markers in the market. Trading above the pivot (93129.703) signals bullish momentum, while a decline below S1 (91225.563) could lead to further downside pressure.
🔍 Fundamental Analysis
⚖️ Bitcoin Market Trends & Institutional Adoption:
-
Institutional interest in Bitcoin continues to rise, influencing price stability and market sentiment.
-
Global regulatory developments remain key factors impacting Bitcoin’s trajectory.
💰 Macro-Economic Influences:
-
The Federal Reserve’s stance on interest rates affects Bitcoin’s attractiveness as a hedge against inflation.
-
Market volatility remains elevated due to global economic uncertainties.
🌐 Investor Sentiment & Market Dynamics:
-
Bitcoin continues to act as a risk-on asset, with sentiment fluctuating based on macroeconomic news.
-
Increasing adoption and developments in blockchain technology drive long-term interest.
🛠️ Technical Analysis Tools
🌟 Fibonacci Retracement
-
Implication:
-
Holding above Pivot (93129.703) may drive price action toward higher resistance levels.
-
A break below S1 (91225.563) may trigger further declines toward S2 and S3.
-
🔄 Bollinger Bands
-
Setup:
-
Trading near the middle band suggests neutral to slightly bullish momentum.
-
The upper band acts as resistance, while the lower band offers support.
-
-
Implication:
-
A move above the upper band could indicate stronger bullish momentum.
-
A drop below the lower band may suggest a shift to bearish conditions.
-
🔄 Elliott Wave Analysis
-
Insight:
-
The market appears to be in a corrective phase (Wave 4).
-
Holding above the pivot may lead to a bullish Wave 5 targeting R1-R3.
-
A decline below S1 may indicate an extended correction.
-
⚠️ Final Thoughts & Disclaimer
This report provides a combination of technical and fundamental insights to offer a comprehensive outlook on Bitcoin market conditions. Given the volatility in cryptocurrency markets, traders should apply strong risk management strategies.
Disclaimer: Cryptocurrency trading involves significant risks. This analysis is for informational purposes only. Traders should conduct their own research before making financial decisions.
————————————————————————————————————————————————————————————————————————————-
Notice: The data presented is derived from technical analysis and does not constitute financial advice. For those trading in forex, consulting a qualified financial advisor prior to making investment decisions is strongly recommended.
Caution: The information above reflects ongoing technical analysis and should not be interpreted as financial advice. Forex trading involves high volatility, and without proper knowledge, you risk losing all your capital. It is essential to consult with a financial advisor before investing.
Advisory: The insights shared are the result of technical analysis and are not intended as financial advice. Forex traders should seek advice from professional financial advisors before making any investment decisions. Remember, the forex market is highly volatile, and trading without adequate knowledge can lead to significant losses.
Important: The analysis provided is for informational purposes only and should not be seen as financial advice. Forex trading carries substantial risks, and it is advisable to consult financial advisors before proceeding with any investments. This content is intended solely for Wealth Management Education purposes.