Daily Report: EURO/USD
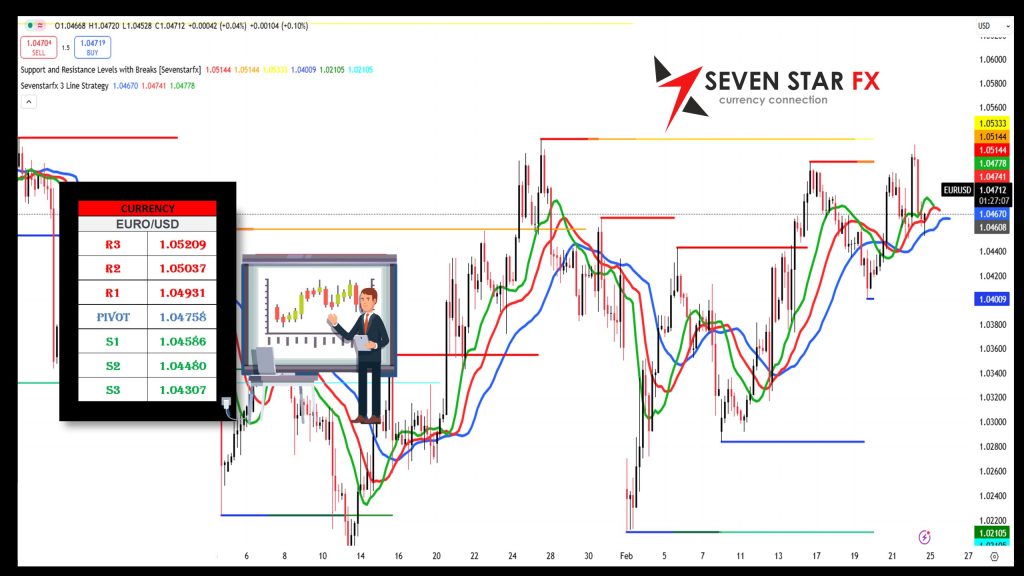
📊 Key Technical Levels
-
Resistance:
- R3: 1.05209
- R2: 1.05037
- R1: 1.04931
-
Pivot: 1.04758
-
Support:
- S1: 1.04586
- S2: 1.04480
- S3: 1.04307
These levels are critical markers. Staying above the pivot indicates strength, while a break below S1 could lead to further downside.
🔍 Fundamental Analysis
-
ECB Monetary Policy & Economic Outlook:
- The ECB remains cautious, delaying rate cuts amid persistent inflation.
- Eurozone data shows moderate growth but ongoing inflation concerns keep sentiment on edge.
-
US Federal Reserve & USD Dynamics:
- The Fed’s deliberate pace supports a strong USD despite soft economic data.
- This dynamic pressures the Euro, influencing the pair’s performance.
-
Geopolitical & Market Sentiment:
- US-EU trade discussions and global uncertainties continue to create volatility.
- Mixed risk sentiment and safe-haven flows add to the cautious trading environment.
🔧 Technical Analysis Tools
Fibonacci Retracement
- Implication:
- Above Pivot (1.04758): May test higher retracement levels.
- Below S1 (1.04586): Could trigger a move toward S2 and S3.
Bollinger Bands
- Setup:
- Trading near the middle band suggests a neutral to slightly bullish stance.
- The upper band acts as resistance, while the lower band offers support.
- Implication:
- A move above the upper band signals potential momentum; a breach below the lower band may indicate bearish shifts.
Elliott Wave Analysis
- Insight:
- The pair is likely in a corrective phase (Wave 4).
- Holding above the pivot may set the stage for a bullish Wave 5 between R1 and R3.
- A break below S1 could signal an extended correction.
⚠️ Final Thoughts & Disclaimer
This report blends technical and fundamental insights to offer a holistic view of the EURO/USD market. In a constantly shifting landscape, stay vigilant and use robust risk management.
Disclaimer: Forex trading is highly volatile and involves significant risk. This analysis is for educational purposes only. Always employ proper risk management when trading.
Daily Report: GBP/USD
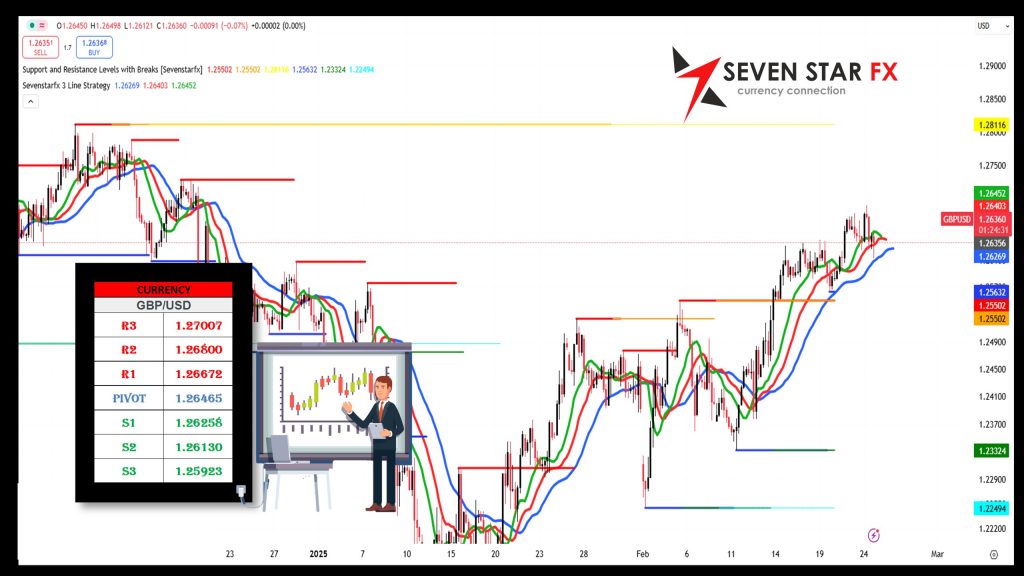
📊 Key Technical Levels
-
Resistance:
- R3: 1.27007
- R2: 1.26800
- R1: 1.26672
-
Pivot: 1.26465
-
Support:
- S1: 1.26258
- S2: 1.26130
- S3: 1.25923
These levels act as key reference points. Trading above the pivot indicates strength, while a break below S1 may signal increased selling pressure.
🔍 Fundamental Analysis
-
Bank of England (BoE) Policy & UK Economic Outlook:
- The BoE continues to adopt a cautious stance amid mixed economic signals.
- While inflation pressures have moderated slightly, core economic indicators and wage growth maintain a hawkish tone, supporting the pound.
-
US Federal Reserve & Market Sentiment:
- The Fed’s policy remains on hold, contributing to a relatively steady USD environment.
- Soft US economic data, however, tempers the dollar’s potential gains, keeping GBP/USD dynamics in a balanced state.
-
Geopolitical & Market Impact:
- Brexit-related issues and ongoing trade discussions add layers of uncertainty.
- Mixed risk sentiment in global markets is currently influencing GBP/USD volatility.
🔧 Technical Analysis Tools
Fibonacci Retracement
- Implication:
- Maintaining levels above the pivot (1.26465) could prompt a move toward higher retracement targets, indicating bullish momentum.
- A break below S1 (1.26258) might pave the way for further retracement toward S2 and S3.
Bollinger Bands
- Current Setup:
- Trading near the middle band suggests a neutral to moderately bullish bias.
- The upper band acts as resistance, while the lower band provides support.
- Implication:
- A move above the upper band could accelerate bullish trends, whereas a breach below the lower band might intensify bearish pressure.
Elliott Wave Analysis
- Insight:
- GBP/USD appears to be in a corrective phase, potentially setting up for a bullish Wave 5.
- Holding above key levels like the pivot is crucial; a drop below S1 may indicate an extended corrective phase.
⚠️ Final Thoughts & Disclaimer
This report combines technical indicators and fundamental insights to offer a comprehensive view of GBP/USD. Given the dynamic nature of the market influenced by central bank policies, economic data, and geopolitical developments, traders should exercise caution and implement robust risk management practices.
Disclaimer: Forex trading is highly volatile and involves significant risk. This analysis is for educational purposes only. Always use proper risk management when trading.
Daily Report: USD/JPY
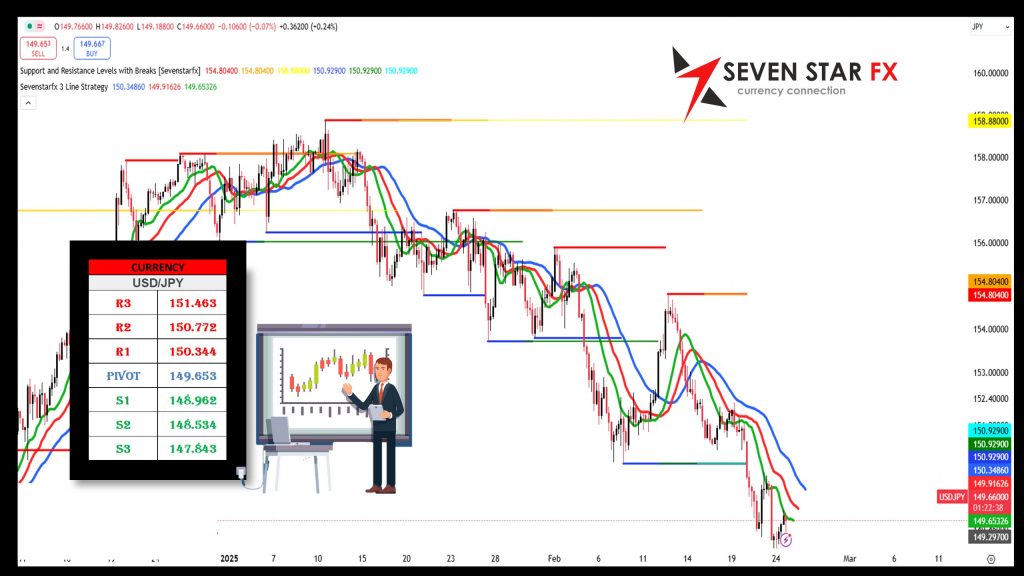
📊 Key Technical Levels
-
Resistance:
- R3: 151.463
- R2: 150.772
- R1: 150.344
-
Pivot: 149.653
-
Support:
- S1: 148.962
- S2: 148.534
- S3: 147.843
These levels are key reference points for assessing potential price movements. Trading above the pivot indicates bullish momentum, while a break below S1 could signal increased bearish pressure.
🔍 Fundamental Analysis
-
US Federal Reserve & Dollar Strength:
- The Fed’s ongoing normalization efforts continue to support the USD amid robust economic indicators.
- Consistent rate hikes and a positive labor market bolster the greenback.
-
Bank of Japan (BoJ) Policy & Yen Dynamics:
- The BoJ remains committed to its ultra-loose monetary policy, contributing to yen weakness.
- Despite efforts to stimulate growth, low inflation and subdued domestic demand persist.
-
Market Sentiment & Global Influences:
- Geopolitical developments and risk sentiment shifts impact safe-haven flows, influencing USD/JPY volatility.
- The divergence between US and Japanese monetary policies remains a key driver for the pair.
🔧 Technical Analysis Tools
Fibonacci Retracement
- Implication:
- Staying above the pivot (149.653) could support a move towards higher retracement levels, reinforcing bullish sentiment.
- A break below S1 (148.962) might trigger a deeper decline toward S2 and S3.
Bollinger Bands
- Setup:
- Trading near the middle Bollinger Band suggests a neutral stance with potential for directional movement.
- The upper band acts as resistance, while the lower band provides support.
- Implication:
- A move above the upper band may signal strengthening momentum, whereas a breach of the lower band could accelerate bearish trends.
Elliott Wave Analysis
- Insight:
- USD/JPY appears to be in a corrective phase, potentially setting the stage for a subsequent bullish impulse.
- Maintaining levels above key support is crucial; a drop below S1 might indicate an extended corrective move.
⚠️ Final Thoughts & Disclaimer
This report integrates both technical indicators and fundamental insights to offer a comprehensive view of the USD/JPY market. With the contrasting monetary policies of the Fed and the BoJ playing a central role, traders should remain alert to market shifts and employ sound risk management practices.
Disclaimer: Forex trading is highly volatile and involves significant risk. This analysis is for educational purposes only. Trading decisions should always be made with proper risk management.
Daily Report: AUD/USD
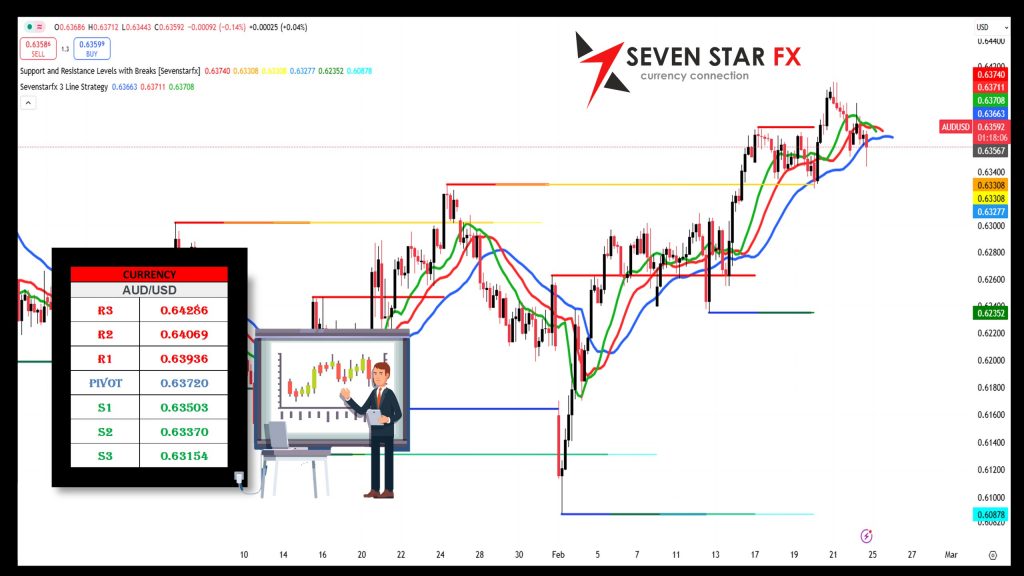
📊 Key Technical Levels
-
Resistance:
- R3: 0.64286
- R2: 0.64069
- R1: 0.63936
-
Pivot: 0.63720
-
Support:
- S1: 0.63503
- S2: 0.63370
- S3: 0.63154
These levels serve as important markers to gauge potential market moves. Trading above the pivot suggests bullish sentiment, while a break below S1 could indicate increased bearish pressure.
🔍 Fundamental Analysis
-
Reserve Bank of Australia (RBA) Policy & Economic Outlook:
- The RBA is maintaining a cautious approach amid moderate economic growth and inflation concerns.
- Market participants are watching for any policy signals that might shift the current stance.
-
US Economic Factors & USD Influence:
- The strength of the USD, driven by solid US economic data and the Fed’s stance, exerts downward pressure on the AUD.
- This dynamic is crucial in shaping the AUD/USD pair’s performance.
-
Global Risk & Commodity Market Trends:
- As a commodity-linked currency, the AUD is sensitive to shifts in global commodity prices and risk sentiment.
- Any change in global risk appetite or commodity trends could impact the pair significantly.
🔧 Technical Analysis Tools
Fibonacci Retracement
- Implication:
- Holding above the pivot (0.63720) could pave the way for a move toward higher retracement levels, indicating bullish momentum.
- A break below S1 (0.63503) might signal further retracement towards S2 and S3.
Bollinger Bands
- Setup:
- Trading near the middle band typically indicates a neutral stance with potential for a directional move.
- The upper band acts as resistance, while the lower band provides support.
- Implication:
- A move above the upper band may accelerate bullish momentum, while a breach below the lower band could intensify bearish pressure.
Elliott Wave Analysis
- Insight:
- AUD/USD appears to be in a corrective phase, which might set the stage for a subsequent bullish impulse if key levels are maintained.
- Staying above the pivot is crucial; a drop below S1 could lead to an extended corrective trend.
⚠️ Final Thoughts & Disclaimer
This report integrates technical and fundamental insights to provide a comprehensive outlook on the AUD/USD market. With shifts in RBA policy, global commodity trends, and USD dynamics all playing a role, traders should remain cautious and use sound risk management practices.
Disclaimer: Forex trading is highly volatile and involves significant risk. This analysis is for educational purposes only. Trading decisions should always be made with proper risk management.
Daily Report: CRUDE OIL
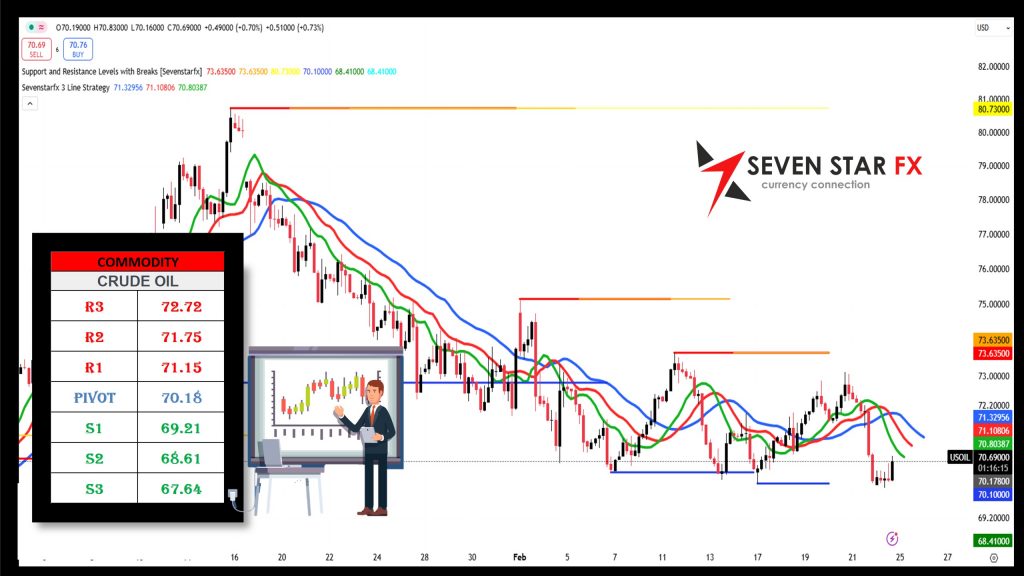
📊 Key Technical Levels
-
Resistance:
- R3: 72.72
- R2: 71.75
- R1: 71.15
-
Pivot: 70.18
-
Support:
- S1: 69.21
- S2: 68.61
- S3: 67.64
These levels are essential markers. Trading above the pivot indicates bullish sentiment, while a break below S1 could pave the way for further downside.
🔍 Fundamental Analysis
-
Global Supply & Demand Dynamics:
- Ongoing production discipline from OPEC+ is supporting prices amid robust demand from recovering economies.
- However, concerns over oversupply and shifting energy trends continue to create a cautious outlook.
-
US Dollar & Market Sentiment:
- The strength of the USD tends to exert downward pressure on crude oil prices.
- Mixed risk sentiment and broader macroeconomic uncertainties are adding volatility to the oil market.
-
Geopolitical & Economic Factors:
- Geopolitical tensions and regional supply disruptions can significantly influence crude oil prices.
- Economic data pointing to a global slowdown may dampen demand, further impacting price movements.
🔧 Technical Analysis Tools
Fibonacci Retracement
- Implication:
- Holding above the pivot (70.18) could allow prices to test higher levels near R1 and R2.
- Conversely, a break below S1 (69.21) might signal a deeper retracement towards S2 and S3.
Bollinger Bands
- Setup:
- Trading near the middle band suggests a balanced market stance with potential for directional shifts.
- The upper band, around the R1 level, acts as resistance, while the lower band near S1 supports the downside.
- Implication:
- A breakout above the upper band may trigger further bullish momentum, whereas a breakdown below the lower band could accelerate a bearish trend.
Elliott Wave Analysis
- Insight:
- Crude oil appears to be in a corrective phase, potentially setting the stage for a bullish impulse if key levels hold.
- Maintaining the pivot level is crucial; a sustained drop below S1 could indicate a prolonged corrective movement.
⚠️ Final Thoughts & Disclaimer
This report combines both technical and fundamental insights to provide a comprehensive outlook on the crude oil market. Given the interplay of global supply dynamics, currency influences, and geopolitical risks, traders should remain vigilant and implement robust risk management practices.
Disclaimer: Trading in crude oil is highly volatile and involves significant risk. This analysis is for educational purposes only. Trading decisions should always be made using appropriate risk management techniques.
Daily Report: XAU/USD
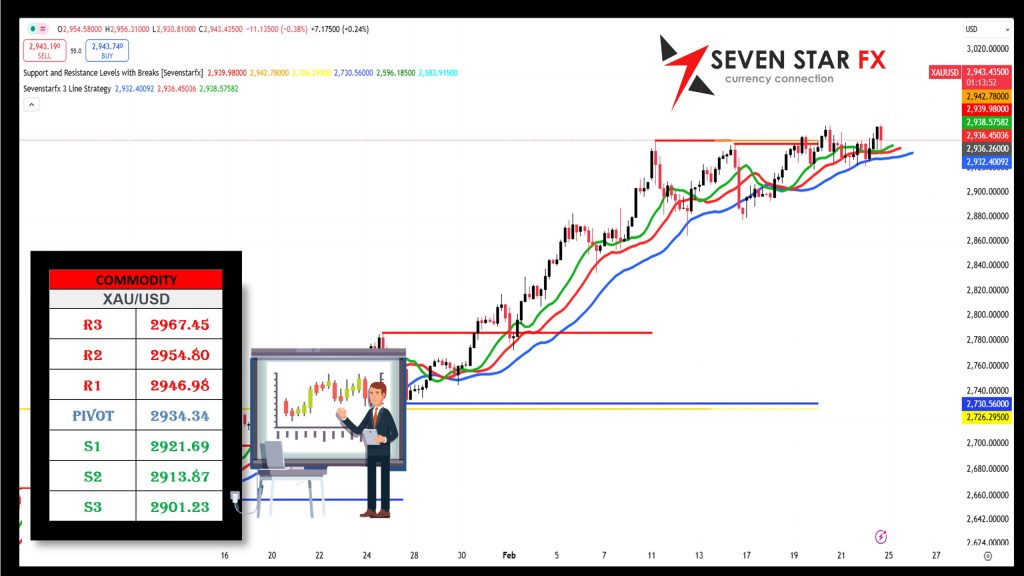
📊 Key Technical Levels
-
Resistance:
- R3: 2967.45
- R2: 2954.80
- R1: 2946.98
-
Pivot: 2934.34
-
Support:
- S1: 2921.69
- S2: 2913.87
- S3: 2901.23
These levels act as critical reference points. Trading above the pivot indicates bullish momentum, while a break below S1 could pave the way for further downside.
🔍 Fundamental Analysis
-
US Dollar & Market Dynamics:
- Gold is widely regarded as a safe haven, often gaining appeal when the US Dollar weakens.
- Recent mixed economic data and geopolitical uncertainties have fueled risk-off sentiment, supporting gold demand.
-
Inflation & Monetary Policy:
- Persistent inflation concerns make gold an attractive hedge.
- The Federal Reserve’s monetary policy stance, especially any dovish signals, can further bolster gold prices.
-
Global Economic Outlook:
- Geopolitical tensions and economic uncertainties continue to drive investors toward safe-haven assets like gold.
- These factors contribute to the overall bullish sentiment for XAU/USD amid market volatility.
🔧 Technical Analysis Tools
Fibonacci Retracement
- Implication:
- Holding above the pivot (2934.34) could enable a move toward higher resistance levels (R1 and R2).
- Conversely, a break below S1 (2921.69) might trigger a deeper retracement toward S2 and S3.
Bollinger Bands
- Setup:
- Trading near the middle band indicates a balanced market outlook with potential for directional shifts.
- The upper band, near R1, serves as resistance, while the lower band, close to S1, offers support.
- Implication:
- A breakout above the upper band may accelerate bullish momentum, whereas a breakdown below the lower band could intensify bearish pressure.
Elliott Wave Analysis
- Insight:
- XAU/USD appears to be in a corrective phase, potentially setting the stage for a bullish impulse if key support levels hold.
- Maintaining the pivot level is crucial; a sustained move below S1 could signal an extended corrective trend.
⚠️ Final Thoughts & Disclaimer
This report blends both technical indicators and fundamental insights to provide a comprehensive view of the XAU/USD market. With factors such as USD dynamics, inflation concerns, and global uncertainties all in play, traders should remain vigilant and employ robust risk management strategies.
Disclaimer: Trading gold (XAU/USD) is highly volatile and involves significant risk. This analysis is for educational purposes only. Always use proper risk management when trading.
Daily Report: DOW JONES
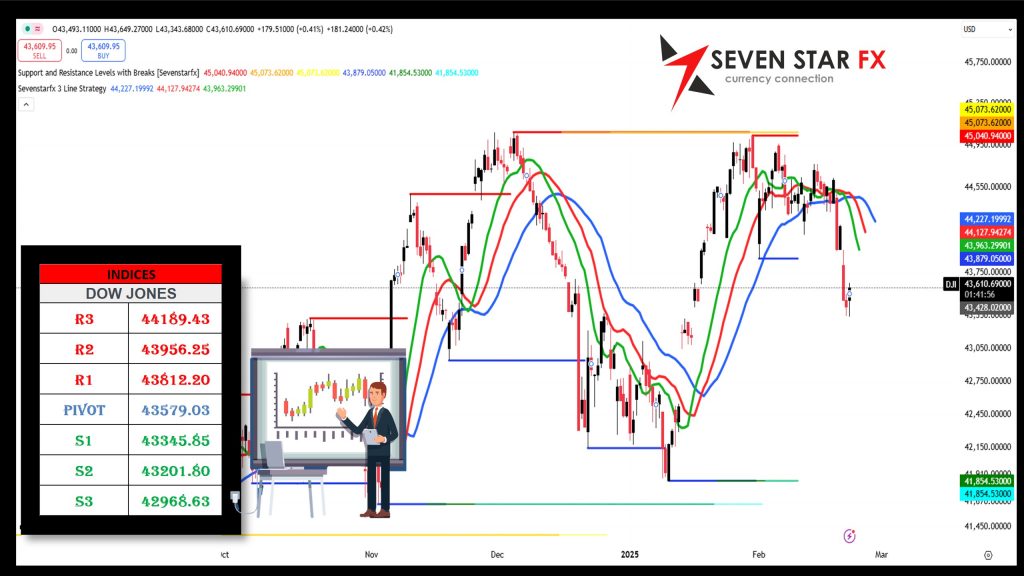
📊 Key Technical Levels
-
Resistance:
- R3: 44189.43
- R2: 43956.25
- R1: 43812.20
-
Pivot: 43579.03
-
Support:
- S1: 43345.85
- S2: 43201.80
- S3: 42968.63
These levels serve as critical reference points. Trading above the pivot indicates bullish momentum, while a break below S1 may trigger further downside.
🔍 Fundamental Analysis
-
US Economic Environment & Corporate Earnings:
- Recent data suggests mixed economic signals, with cautious optimism in corporate earnings and steady job growth.
- Market participants remain attentive to inflation and interest rate developments as key drivers for investor sentiment.
-
Federal Reserve Policy:
- The Fed’s stance on monetary policy, including hints about future rate adjustments, continues to impact market sentiment.
- Investors are watching for any dovish or hawkish cues that may influence overall market direction.
-
Global Geopolitical & Market Sentiment:
- Geopolitical uncertainties and global trade developments add layers of volatility to the market.
- Shifts in risk sentiment, whether towards risk-on or risk-off modes, are expected to influence Dow Jones performance.
🔧 Technical Analysis Tools
Fibonacci Retracement
- Implication:
- Staying above the pivot (43579.03) may allow the index to test higher resistance levels near R1 and R2.
- A break below S1 (43345.85) could open the door for further retracement towards S2 and S3.
Bollinger Bands
- Setup:
- Trading near the middle Bollinger Band indicates a balanced market stance, with potential for a directional breakout.
- The upper band (around R1) is acting as resistance, while the lower band (near S1) provides support.
- Implication:
- A move above the upper band might signal bullish momentum, whereas a drop below the lower band could accelerate bearish trends.
Elliott Wave Analysis
- Insight:
- The index appears to be in a corrective phase, potentially setting the stage for a bullish impulse if key support levels hold.
- Maintaining levels above the pivot is crucial; a sustained decline below S1 could indicate an extended corrective move.
⚠️ Final Thoughts & Disclaimer
This report integrates both technical indicators and fundamental insights to offer a comprehensive view of the Dow Jones market. Given the current economic backdrop, evolving Fed policy, and global geopolitical uncertainties, traders should remain vigilant and adopt robust risk management practices.
Disclaimer: Trading in equity indices like the Dow Jones is highly volatile and involves significant risk. This analysis is for educational purposes only. Trading decisions should always be made using proper risk management techniques.
Daily Report: BITCOIN
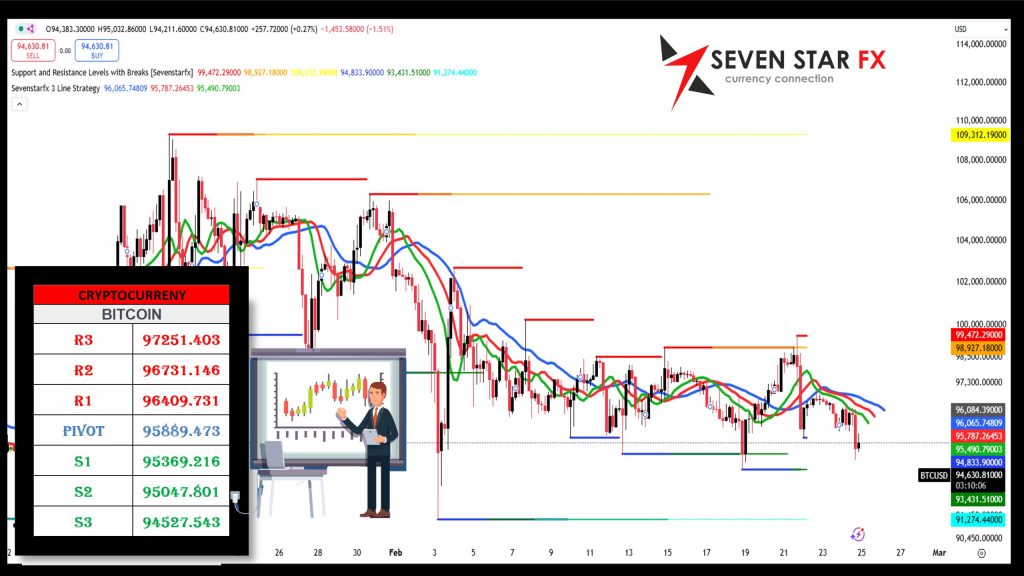
📊 Key Technical Levels
-
Resistance:
- R3: 97,251.40
- R2: 96,731.14
- R1: 96,409.73
-
Pivot: 95,889.47
-
Support:
- S1: 95,369.21
- S2: 95,047.80
- S3: 94,527.54
These levels serve as critical reference points. Trading above the pivot suggests bullish momentum, while a break below S1 may indicate a potential shift to bearish pressure.
🔍 Fundamental Analysis
-
Market Sentiment & Institutional Interest:
- Bitcoin continues to attract significant attention from institutional investors and retail traders alike.
- Growing adoption and increased liquidity are contributing to its reputation as digital gold in a volatile market.
-
Regulatory Environment & Global Developments:
- Regulatory news remains a key driver for Bitcoin’s price action, with announcements from major economies influencing market sentiment.
- Ongoing discussions around cryptocurrency regulation continue to add layers of uncertainty and opportunity.
-
Technological Developments & Network Dynamics:
- Innovations within the blockchain ecosystem, including upgrades and enhanced security measures, bolster confidence in Bitcoin’s long-term viability.
- The network’s performance and evolving use cases are closely monitored as indicators of its fundamental strength.
🔧 Technical Analysis Tools
Fibonacci Retracement
- Implication:
- Maintaining a position above the pivot (95,889.47) could pave the way for a move towards higher resistance levels, reinforcing bullish sentiment.
- Conversely, a drop below S1 (95,369.21) might trigger further retracement toward S2 and S3.
Bollinger Bands
- Setup:
- Trading near the middle Bollinger Band suggests a balanced market outlook with potential for a directional breakout.
- The upper band, aligned with R1, acts as resistance, while the lower band near S1 offers support.
- Implication:
- A breakout above the upper band may accelerate bullish momentum, whereas a breakdown below the lower band could intensify bearish pressure.
Elliott Wave Analysis
- Insight:
- Bitcoin appears to be navigating through a corrective phase, which may set the stage for a subsequent impulsive move if key levels hold.
- Maintaining levels above the pivot is crucial; a sustained move below S1 could signal an extended corrective trend.
⚠️ Final Thoughts & Disclaimer
This report integrates both technical and fundamental insights to provide a comprehensive view of the Bitcoin market. With factors such as institutional interest, regulatory developments, and evolving network dynamics all influencing Bitcoin’s performance, traders should remain vigilant and apply robust risk management strategies.
Disclaimer: Trading Bitcoin is highly volatile and involves significant risk. This analysis is for educational purposes only. Always use proper risk management when trading.
————————————————————————————————————————————————————————————————————————————-
Notice: The data presented is derived from technical analysis and does not constitute financial advice. For those trading in forex, consulting a qualified financial advisor prior to making investment decisions is strongly recommended.
Caution: The information above reflects ongoing technical analysis and should not be interpreted as financial advice. Forex trading involves high volatility, and without proper knowledge, you risk losing all your capital. It is essential to consult with a financial advisor before investing.
Advisory: The insights shared are the result of technical analysis and are not intended as financial advice. Forex traders should seek advice from professional financial advisors before making any investment decisions. Remember, the forex market is highly volatile, and trading without adequate knowledge can lead to significant losses.
Important: The analysis provided is for informational purposes only and should not be seen as financial advice. Forex trading carries substantial risks, and it is advisable to consult financial advisors before proceeding with any investments. This content is intended solely for Wealth Management Education purposes.