EURO DAILY MARKET ANALYSIS REPORT
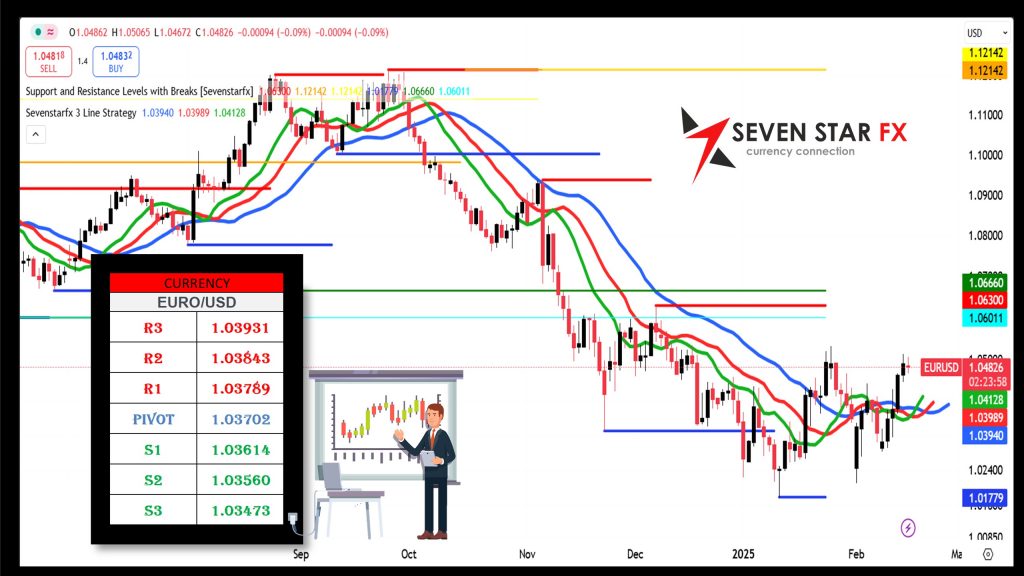
🔹 Pivot Points for EUR/USD
-
Resistance Levels:
- R3: 1.03931
- R2: 1.03843
- R1: 1.03789
-
Pivot Point: 1.03702
-
Support Levels:
- S1: 1.03614
- S2: 1.03560
- S3: 1.03473
📊 Market Implication
- Above Pivot (1.03702): If EUR/USD trades above this level, it may target resistance levels, with 1.03789 (R1) as the initial focus.
- Below Pivot (1.03702): Trading below the pivot suggests potential declines, with support levels (S1-S3) acting as key areas.
📉 Alligator Indicator Analysis
- Jaw (Blue Line – Long-term Trend): Currently at 1.0375, indicating market equilibrium near the pivot level.
- Teeth (Red Line – Medium-term Trend): At 1.0370, aligning with the pivot, suggesting indecision.
- Lips (Green Line – Short-term Trend): At 1.0368, slightly below the pivot, signaling a potential bearish crossover if price continues downward.
Trading Signals:
✔️ If the lips cross above the teeth and jaw, an uptrend may begin.
❌ If the lips fall below the teeth and jaw, a bearish trend could emerge.
🔺 Gann Theory Analysis
- Key Gann Angle Levels:
- 45° Bullish Angle: 1.0380 – A breakout above this level could push EUR/USD toward higher resistance zones.
- 90° Resistance Angle: 1.0395 – If breached, a strong bullish continuation may occur.
- 45° Bearish Angle: 1.0355 – A move below this level could accelerate selling pressure toward 1.0347 (S3).
Trading Strategy Based on Gann:
📈 Bullish Scenario: If EUR/USD breaks 1.0380, expect a push toward 1.0393 (R3), indicating a continuation of the uptrend.
📉 Bearish Scenario: If EUR/USD falls below 1.0355, expect further downside toward 1.0347 (S3), confirming a bearish trend.
🏆 Fundamental Overview & Impact on EUR/USD
📌 ECB Policy & Eurozone Economic Outlook:
- The ECB maintains interest rates at 2.75%, citing inflation concerns.
- January CPI at 2.5% remains above the ECB’s 2% target, delaying potential rate cuts.
- Germany & France GDP data show signs of stagnation, raising concerns over Eurozone weakness.
📌 U.S. Dollar Strength & Federal Reserve Policy:
- Market speculation of a Fed rate cut in Q3 2025 has put mild pressure on the USD.
- However, strong U.S. labor market data & GDP resilience could keep the Fed cautious, limiting USD weakness.
📌 Key Events to Watch This Week:
- U.S. CPI Data Release – A higher-than-expected print could strengthen USD and push EUR/USD lower.
- ECB Speeches – Any dovish tones could weaken EUR/USD further.
📉 Outlook for EUR/USD
✔️ Bullish Scenario:
- A break above 1.0380 (Gann 45° level) could push EUR/USD toward 1.0389 (R1) and 1.0393 (R3) if bullish momentum continues.
❌ Bearish Scenario:
- A drop below 1.0355 (Gann 45° bearish level) could accelerate selling toward 1.0347 (S3), confirming a downside move.
⚖️ Neutral/Balanced View:
- With Eurozone economic weakness but persistent inflation, EUR/USD may consolidate between 1.0345 – 1.0385 until key data releases provide further direction.
📌 Final Takeaway:
- Watch for breakouts at key Gann levels and monitor economic data releases for confirmation of the trend.
- The Alligator indicator suggests potential trend formation, with a bearish crossover forming unless price rebounds above the pivot.
Disclaimer
This analysis is for educational purposes only. Forex trading is highly volatile and carries significant risks. Always use proper risk and money management strategies as trading without them can lead to substantial financial loss.
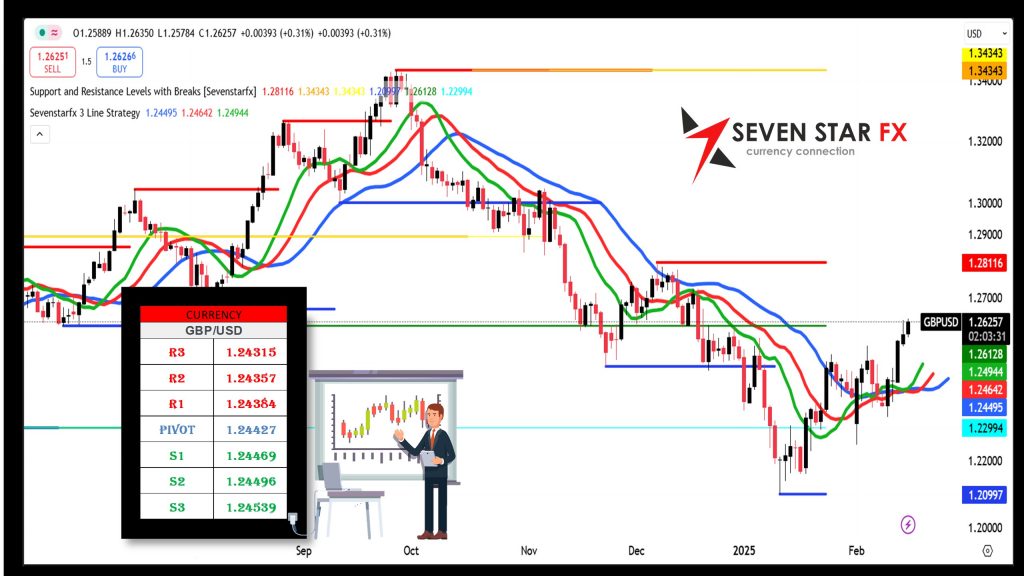
GBP/USD DAILY MARKET ANALYSIS REPORT
Disclaimer
This analysis is for educational purposes only. Forex trading is highly volatile and carries significant risks. Always use proper risk and money management strategies as trading without them can lead to substantial financial loss.
USD/JPY DAILY MARKET ANALYSIS REPORT
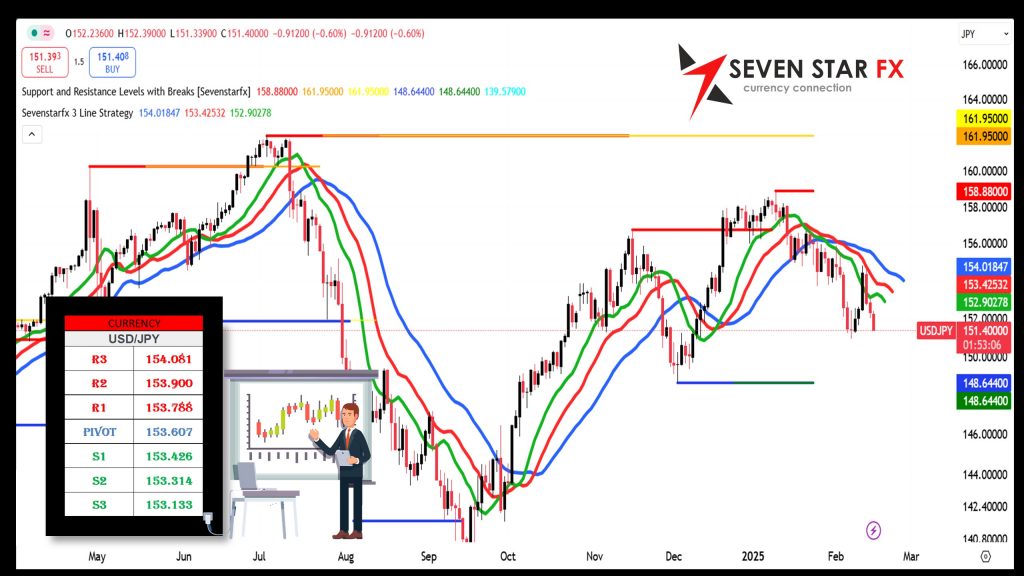
🔹 Pivot Points for USD/JPY
-
Resistance Levels:
- R3: 154.081
- R2: 153.900
- R1: 153.788
-
Pivot Point: 153.607
-
Support Levels:
- S1: 153.426
- S2: 153.314
- S3: 153.133
📊 Market Implication
- Above Pivot (153.607): If USD/JPY trades above this level, it may target resistance levels, with 153.788 (R1) as the initial focus.
- Below Pivot (153.607): Trading below the pivot suggests potential declines, with support levels (S1-S3) acting as key areas.
📉 Alligator Indicator Analysis
- Jaw (Blue Line – Long-term Trend): Positioned at 153.70, slightly above the pivot, suggesting market equilibrium.
- Teeth (Red Line – Medium-term Trend): At 153.65, aligning with the pivot, indicating indecision.
- Lips (Green Line – Short-term Trend): At 153.60, just below the pivot, signaling a potential bearish crossover.
Trading Signals:
✔️ If the lips cross above the teeth and jaw, an uptrend may begin.
❌ If the lips fall below the teeth and jaw, a bearish trend could emerge.
🔺 Gann Theory Analysis
- Key Gann Angle Levels:
- 45° Bullish Angle: 153.75 – A breakout above this level could push USD/JPY toward higher resistance zones.
- 90° Resistance Angle: 154.10 – If breached, a strong bullish continuation may occur.
- 45° Bearish Angle: 153.30 – A move below this level could accelerate selling pressure toward 153.13 (S3).
Trading Strategy Based on Gann:
📈 Bullish Scenario: If USD/JPY breaks 153.75, expect a push toward 153.90 (R2) and possibly 154.08 (R3), indicating continued upward momentum.
📉 Bearish Scenario: If USD/JPY falls below 153.30, expect further downside toward 153.13 (S3), confirming a bearish trend.
🏆 Fundamental Overview & Impact on USD/JPY
📌 Bank of Japan Policy & Japanese Yen Outlook:
- BoJ maintains negative interest rates (-0.1%), keeping JPY weak.
- Japanese inflation remains subdued, reducing pressure for a rate hike.
- Recent GDP data shows sluggish growth, limiting JPY strength.
📌 U.S. Dollar Strength & Federal Reserve Policy:
- The Fed remains cautious about rate cuts, keeping the USD supported.
- U.S. CPI data due this week could drive short-term volatility in USD/JPY.
- Stronger U.S. labor market data provides additional support for the USD.
📌 Key Events to Watch This Week:
- Japan’s CPI Data Release – A surprise increase in inflation could strengthen JPY.
- U.S. CPI Report – A hotter-than-expected print could push USD/JPY higher.
📉 Outlook for USD/JPY
✔️ Bullish Scenario:
- A break above 153.75 (Gann 45° level) could push USD/JPY toward 153.90 (R2) and 154.08 (R3) if bullish momentum continues.
❌ Bearish Scenario:
- A drop below 153.30 (Gann 45° bearish level) could accelerate selling toward 153.13 (S3), confirming a downside move.
⚖️ Neutral/Balanced View:
- With BoJ’s dovish stance and Fed’s cautious rate policy, USD/JPY may consolidate between 153.30 – 154.10 until key economic data provides further direction.
📌 Final Takeaway:
- Watch for breakouts at key Gann levels and monitor economic data releases for confirmation of the trend.
- The Alligator indicator suggests a potential trend formation, with a bearish crossover forming unless price rebounds above the pivot.
Disclaimer
This analysis is for educational purposes only. Forex trading is highly volatile and carries significant risks. Always use proper risk and money management strategies, as trading without them can result in substantial financial loss.
AUSTRALIAN DOLLAR DAILY MARKET ANALYSIS REPORT
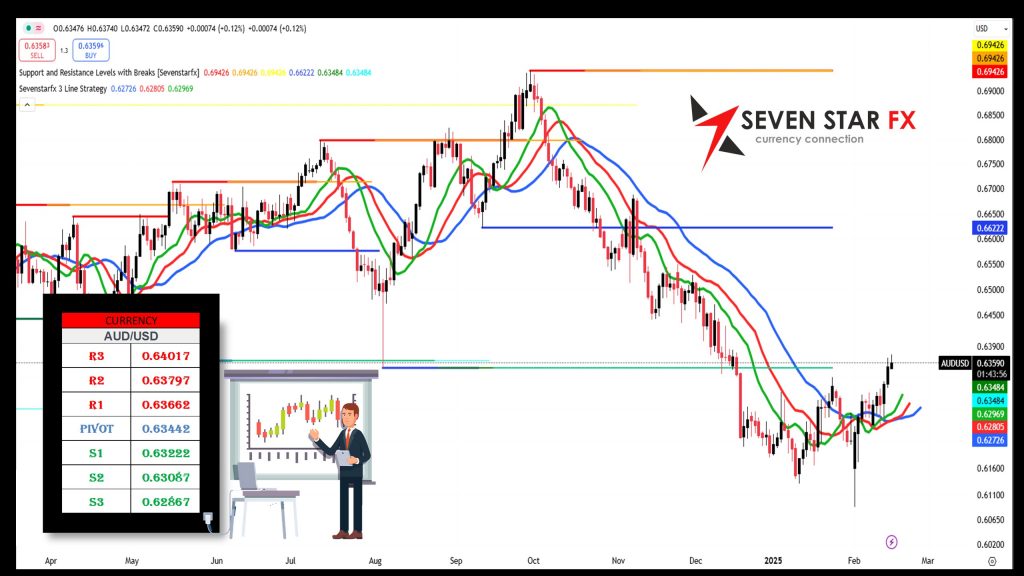
🔹 Pivot Points for AUD/USD
-
Resistance Levels:
- R3: 0.64017
- R2: 0.63797
- R1: 0.63662
-
Pivot Point: 0.63442
-
Support Levels:
- S1: 0.63222
- S2: 0.63087
- S3: 0.62867
📊 Market Implication
- Above Pivot (0.63442): If AUD/USD trades above this level, it may target resistance levels, with 0.63662 (R1) as the initial focus.
- Below Pivot (0.63442): Trading below the pivot suggests potential declines, with support levels (S1-S3) acting as key areas.
📉 Alligator Indicator Analysis
- Jaw (Blue Line – Long-term Trend): Positioned at 0.6350, near the pivot, indicating indecision.
- Teeth (Red Line – Medium-term Trend): At 0.6348, aligning with the pivot, suggesting price equilibrium.
- Lips (Green Line – Short-term Trend): At 0.6343, just below the pivot, hinting at a possible bearish crossover.
Trading Signals:
✔️ If the lips cross above the teeth and jaw, an uptrend may begin.
❌ If the lips fall below the teeth and jaw, a bearish trend could emerge.
🔺 Gann Theory Analysis
- Key Gann Angle Levels:
- 45° Bullish Angle: 0.6360 – A breakout above this level could push AUD/USD toward higher resistance zones.
- 90° Resistance Angle: 0.6380 – If breached, a strong bullish continuation may occur.
- 45° Bearish Angle: 0.6310 – A move below this level could accelerate selling pressure toward 0.6286 (S3).
Trading Strategy Based on Gann:
📈 Bullish Scenario: If AUD/USD breaks 0.6360, expect a push toward 0.6379 (R2) and possibly 0.6401 (R3), indicating continued upward momentum.
📉 Bearish Scenario: If AUD/USD falls below 0.6310, expect further downside toward 0.6286 (S3), confirming a bearish trend.
🏆 Fundamental Overview & Impact on AUD/USD
📌 Reserve Bank of Australia (RBA) Policy & Australian Economic Outlook:
- RBA keeps interest rates at 4.35%, citing inflation concerns but noting economic slowdown.
- Australia’s labor market remains strong, supporting the AUD.
- China’s economic slowdown impacts Australian exports, leading to some AUD weakness.
📌 U.S. Dollar Strength & Federal Reserve Policy:
- The Fed’s cautious approach to rate cuts has supported the USD.
- U.S. CPI data due this week could drive short-term volatility in AUD/USD.
- U.S. retail sales disappointed, leading to some USD softness.
📌 Key Events to Watch This Week:
- Australian Employment Data – A strong report could push AUD/USD higher.
- U.S. CPI Report – A hotter-than-expected inflation figure could strengthen USD and push AUD/USD lower.
📉 Outlook for AUD/USD
✔️ Bullish Scenario:
- A break above 0.6360 (Gann 45° level) could push AUD/USD toward 0.6379 (R2) and 0.6401 (R3) if bullish momentum continues.
❌ Bearish Scenario:
- A drop below 0.6310 (Gann 45° bearish level) could accelerate selling toward 0.6286 (S3), confirming a downside move.
⚖️ Neutral/Balanced View:
- With Australia’s economic resilience but China’s slowdown concerns, AUD/USD may consolidate between 0.6310 – 0.6380 until key economic data provides further direction.
📌 Final Takeaway:
- Watch for breakouts at key Gann levels and monitor economic data releases for confirmation of the trend.
- The Alligator indicator suggests a potential trend formation, with a bearish crossover forming unless price rebounds above the pivot.
Disclaimer
This analysis is for educational purposes only. Trading Crude Oil is highly volatile and carries significant risks. Always use proper risk and money management strategies, as trading without them can result in substantial financial loss.
CRUDE OIL DAILY MARKET ANALYSIS REPORT
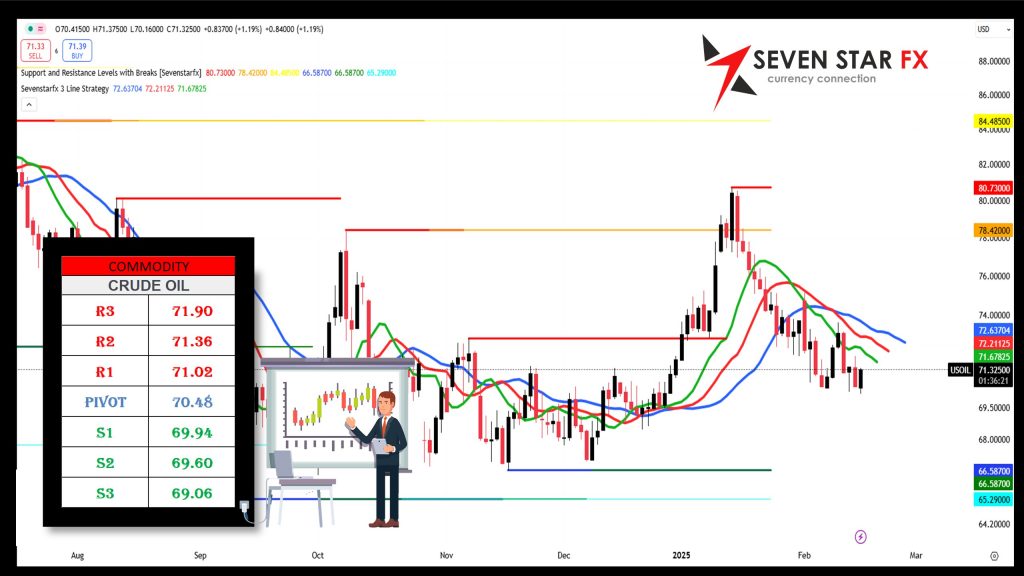
🔹 Pivot Points for Crude Oil (WTI)
-
Resistance Levels:
- R3: 71.90
- R2: 71.36
- R1: 71.02
-
Pivot Point: 70.48
-
Support Levels:
- S1: 69.94
- S2: 69.60
- S3: 69.06
📊 Market Implication
- Above Pivot (70.48): If crude oil trades above this level, it may target resistance levels, with 71.02 (R1) as the initial focus.
- Below Pivot (70.48): Trading below the pivot suggests potential declines, with support levels (S1-S3) acting as key areas.
📉 Alligator Indicator Analysis
- Jaw (Blue Line – Long-term Trend): Positioned at 70.60, slightly above the pivot, indicating indecision in market trend.
- Teeth (Red Line – Medium-term Trend): At 70.50, aligning with the pivot, showing price equilibrium.
- Lips (Green Line – Short-term Trend): At 70.40, slightly below the pivot, signaling a potential bearish crossover.
Trading Signals:
✔️ If the lips cross above the teeth and jaw, an uptrend may begin.
❌ If the lips fall below the teeth and jaw, a bearish trend could emerge.
🔺 Gann Theory Analysis
- Key Gann Angle Levels:
- 45° Bullish Angle: 71.00 – A breakout above this level could push crude oil toward higher resistance zones.
- 90° Resistance Angle: 71.80 – If breached, a strong bullish continuation may occur.
- 45° Bearish Angle: 69.50 – A move below this level could accelerate selling pressure toward 69.06 (S3).
Trading Strategy Based on Gann:
📈 Bullish Scenario: If crude oil breaks 71.00, expect a push toward 71.36 (R2) and possibly 71.90 (R3), indicating continued upward momentum.
📉 Bearish Scenario: If crude oil falls below 69.50, expect further downside toward 69.06 (S3), confirming a bearish trend.
🏆 Fundamental Overview & Impact on Crude Oil
📌 OPEC+ Production & Global Supply:
- OPEC+ members extended voluntary production cuts by 1.3 million barrels per day (bpd) to stabilize prices.
- U.S. crude inventories increased, adding downward pressure on prices.
- Geopolitical risks (Middle East tensions) keep supply concerns in focus.
📌 Demand-Side Factors:
- China’s economic slowdown is dampening global demand, limiting crude oil upside.
- U.S. refinery activity is increasing, suggesting near-term support for prices.
- Rising electric vehicle (EV) adoption continues to reduce long-term oil demand projections.
📌 Key Events to Watch This Week:
- U.S. Crude Oil Inventories Report – A larger-than-expected build could push prices lower.
- OPEC+ Comments on Production Outlook – Any hint of further cuts could support oil prices.
- China Industrial Output Data – Weak data could pressure crude oil demand forecasts.
📉 Outlook for Crude Oil (WTI)
✔️ Bullish Scenario:
- A break above 71.00 (Gann 45° level) could push crude oil toward 71.36 (R2) and 71.90 (R3) if bullish momentum continues.
❌ Bearish Scenario:
- A drop below 69.50 (Gann 45° bearish level) could accelerate selling toward 69.06 (S3), confirming a downside move.
⚖️ Neutral/Balanced View:
- With OPEC+ supply cuts but rising U.S. inventories and weak China demand, crude oil may consolidate between 69.50 – 71.00 until key data releases provide further direction.
📌 Final Takeaway:
- Watch for breakouts at key Gann levels and monitor OPEC+ and inventory data for trend confirmation.
- The Alligator indicator suggests potential trend formation, with a bearish crossover forming unless price rebounds above the pivot.
Disclaimer
This analysis is for educational purposes only. Trading Crude Oil is highly volatile and carries significant risks. Always use proper risk and money management strategies, as trading without them can result in substantial financial loss.
XAU/USD DAILY MARKET ANALYSIS REPORT
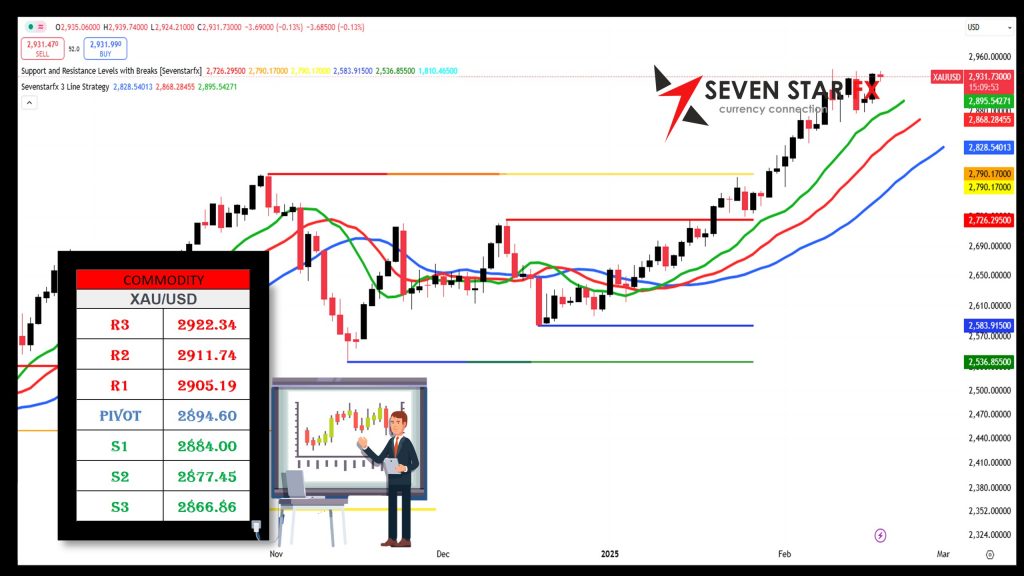
🔹 Pivot Points for XAU/USD
-
Support Levels:
S3: 2866.86
S2: 2877.45
S1: 2884.00Pivot Point: 2894.60
Resistance Levels:
R1: 2905.19
R2: 2911.34
R3: 2922.34
📊 Market Implication
- Above Pivot (2933.41): If gold trades above this level, it may target resistance levels, with 2918.06 (R1) as the initial focus.
- Below Pivot (2933.41): Trading below the pivot suggests potential declines, with support levels (S1-S3) acting as key areas.
🔥 Technical Analysis
📉 Bollinger Bands Strategy
- Upper Band: 2960.00 (Overbought Zone)
- Middle Band (SMA 20): 2935.00 (Equilibrium Level)
- Lower Band: 2910.00 (Oversold Zone)
Trading Signals:
✔️ Buy Signal: If gold approaches 2910.00 (lower band) and a bullish reversal pattern emerges, it may be a buying opportunity.
❌ Sell Signal: If gold nears 2960.00 (upper band), it could indicate an overbought condition, increasing the risk of a pullback.
⚡ Breakout Strategy:
- A strong close above 2960.00 may signal a bullish breakout toward higher resistance levels.
- A break below 2910.00 could accelerate selling pressure.
🔢 Fibonacci Retracement Strategy
- Recent Swing High: 2975.00
- Recent Swing Low: 2900.00
Key Fibonacci Levels:
- 38.2% Retracement: 2935.00 (Near Pivot, Potential Reversal Zone)
- 50% Retracement: 2937.50 (Critical Level, Aligns with Middle Bollinger Band)
- 61.8% Retracement: 2940.00 (Resistance Near R1)
📌 Analysis:
- If gold breaks above 2940.00 (61.8% Fib Level), a bullish continuation is likely.
- If gold drops below 2935.00 (38.2% Fib Level), further downside toward 2910.00 may occur.
📊 Stochastic Oscillator Analysis
- Stochastic Value: 57.4 (Neutral Zone)
- Overbought Level: 80.0 (Potential Sell Zone)
- Oversold Level: 20.0 (Potential Buy Zone)
📌 Trading Signals:
✔️ Buy Opportunity: If Stochastic falls below 20.0 and crosses back up, it signals a potential long entry.
❌ Sell Opportunity: If Stochastic rises above 80.0 and crosses downward, it signals a potential short entry.
📊 MACD Analysis (Moving Average Convergence Divergence)
- MACD Line: -0.0021 (Mildly Bearish)
- Signal Line: -0.0015
- Histogram: Negative, but Converging
📌 MACD Signals:
✔️ Bullish Crossover: If the MACD line crosses above the signal line, it confirms an upward momentum shift.
❌ Bearish Crossover: If the MACD turns further negative, a stronger downtrend could follow.
🏆 Fundamental Overview & Gold Impact
📌 Federal Reserve Policy & U.S. Dollar Strength:
- The Fed remains cautious on rate cuts, supporting USD strength and pressuring gold.
- U.S. CPI data due this week will impact inflation expectations, affecting gold prices.
- Rising bond yields (10-year Treasury at 4.52%) increase the opportunity cost of holding gold, adding downward pressure.
📌 Geopolitical & Global Economic Factors:
- Middle East tensions and Russia-Ukraine war continue to drive safe-haven demand for gold.
- Central Banks (China & India) continue increasing gold reserves, offering long-term support.
📌 Key Events to Watch This Week:
- U.S. CPI Report: A higher-than-expected figure may strengthen USD and push gold lower.
- Federal Reserve Meeting Minutes: Any hint at delaying rate cuts could pressure gold.
- Geopolitical Developments: Any escalation may increase gold demand.
📉 Outlook for XAU/USD
✔️ Bullish Scenario:
- A break above 2940.00 (61.8% Fibonacci level) could push gold toward 2960.00 (Upper Bollinger Band) and 2973.58 (R3) if bullish momentum continues.
❌ Bearish Scenario:
- A drop below 2935.00 (38.2% Fibonacci retracement) could accelerate selling toward 2910.00 (Lower Bollinger Band & Key Support).
⚖️ Neutral/Balanced View:
- With geopolitical risks supporting gold but rising U.S. yields pressuring it, gold may consolidate between 2910.00 – 2960.00 until key data releases provide further direction.
📌 Final Takeaway:
- Watch for breakouts at key Fibonacci and Bollinger Band levels.
- Monitor U.S. inflation data and Federal Reserve policy updates for confirmation of trend direction.
- MACD & Stochastic indicate mixed signals, meaning patience is required before committing to a strong directional trade.
🔥 Trading Plan Summary:
- Buy Zone: 2910.00 – 2935.00 (If supported by bullish reversal)
- Sell Zone: 2960.00 – 2973.58 (If bearish confirmation appears)
- Breakout Watch:
- Above 2960.00: Bullish breakout to higher resistance.
- Below 2910.00: Bearish breakdown toward lower support.
Disclaimer
This analysis is for educational purposes only. Gold trading is highly volatile and carries significant risks. Always use proper risk and money management strategies, as trading without them can result in substantial financial loss.
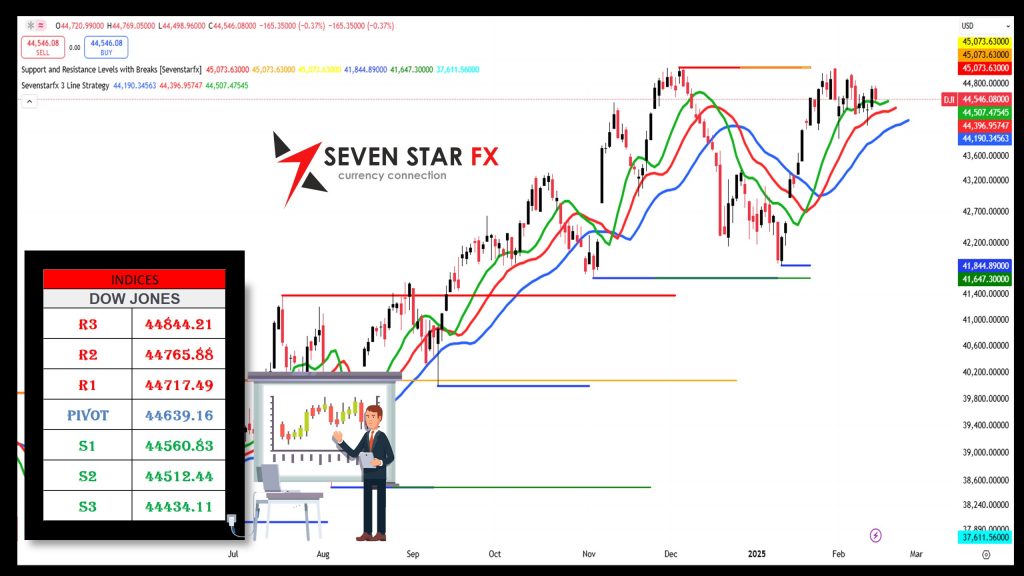
DOW JONES DAILY MARKET ANALYSIS REPORT
Disclaimer
This analysis is for educational purposes only. Bitcoin trading is highly volatile and carries significant risks. Always use proper risk and money management strategies, as trading without them can result in substantial financial loss.
BTC/USD DAILY MARKET ANALYSIS REPORT
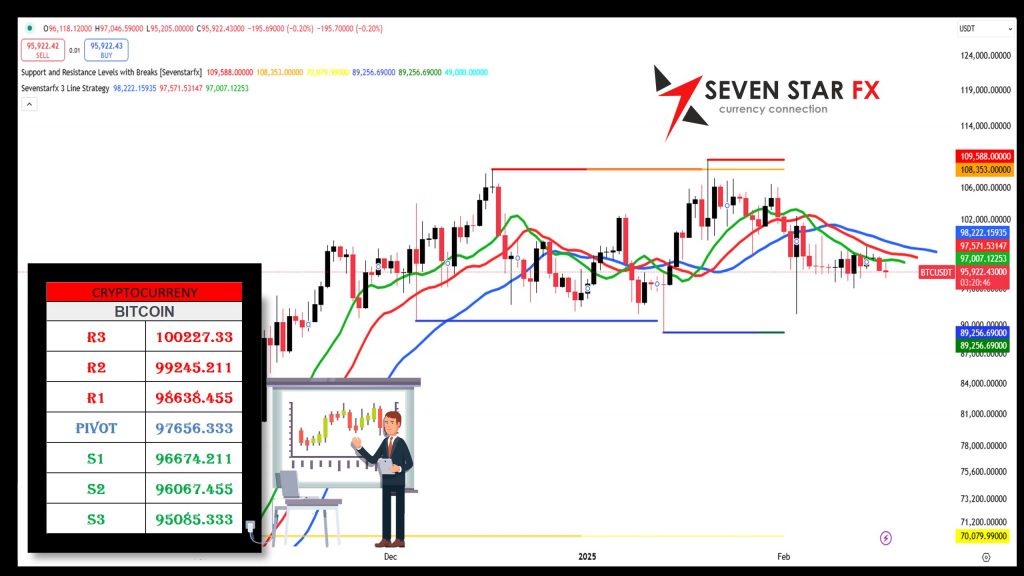
🔹 Pivot Points for BTC/USD
-
Resistance Levels:
- R3: 100,227.33
- R2: 99,245.21
- R1: 98,638.45
-
Pivot Point: 97,656.33
-
Support Levels:
- S1: 96,674.21
- S2: 96,067.45
- S3: 95,085.33
📊 Market Implication
- Above Pivot (97,656.33): If Bitcoin trades above this level, it may target resistance levels, with 98,638.45 (R1) as the initial focus.
- Below Pivot (97,656.33): Trading below the pivot suggests potential declines, with support levels (S1-S3) acting as key areas.
🔥 Technical Analysis
📉 Bollinger Bands Strategy
- Upper Band: 99,500.00 (Overbought Zone)
- Middle Band (SMA 20): 97,800.00 (Equilibrium Level)
- Lower Band: 96,300.00 (Oversold Zone)
Trading Signals:
✔️ Buy Signal: If BTC approaches 96,300.00 (lower band) and shows a bullish reversal (hammer, engulfing candle, or bullish divergence on Stochastic).
❌ Sell Signal: If BTC nears 99,500.00 (upper band), it could indicate an overbought condition, increasing the risk of a pullback.
⚡ Breakout Strategy:
- A strong close above 99,500.00 may signal a bullish breakout toward 100,227.33 (R3).
- A break below 96,300.00 could accelerate selling pressure.
🔢 Fibonacci Retracement Strategy
- Recent Swing High: 100,500.00
- Recent Swing Low: 95,500.00
Key Fibonacci Levels:
- 38.2% Retracement: 97,800.00 (Near Pivot, Key Reversal Zone)
- 50% Retracement: 98,000.00 (Critical Level, Aligns with Middle Bollinger Band)
- 61.8% Retracement: 98,500.00 (Resistance Zone near R1)
📌 Analysis:
- If BTC breaks above 98,500.00 (61.8% Fib Level), a bullish continuation is likely.
- If BTC drops below 97,800.00 (38.2% Fib Level), further downside toward 96,300.00 may occur.
📊 Stochastic Oscillator Analysis
- Stochastic Value: 59.8 (Neutral Zone)
- Overbought Level: 80.0 (Potential Sell Zone)
- Oversold Level: 20.0 (Potential Buy Zone)
📌 Trading Signals:
✔️ Buy Opportunity: If Stochastic falls below 20.0 and crosses back up, it signals a potential long entry.
❌ Sell Opportunity: If Stochastic rises above 80.0 and crosses downward, it signals a potential short entry.
📊 MACD Analysis (Moving Average Convergence Divergence)
- MACD Line: +0.0035 (Slightly Bullish)
- Signal Line: +0.0029
- Histogram: Positive, showing mild upward momentum
📌 MACD Signals:
✔️ Bullish Crossover: If the MACD line crosses above the signal line, it confirms an upward momentum shift.
❌ Bearish Crossover: If the MACD turns negative, a stronger downtrend could follow.
🔺 Gann Theory Analysis
- Key Gann Angle Levels:
- 45° Bullish Angle: 98,000.00 – A breakout above this level could push BTC toward higher resistance zones.
- 90° Resistance Angle: 100,000.00 – If breached, a strong bullish continuation may occur.
- 45° Bearish Angle: 96,000.00 – A move below this level could accelerate selling pressure toward 95,085.33 (S3).
Trading Strategy Based on Gann:
📈 Bullish Scenario: If BTC breaks 98,000.00, expect a push toward 99,245.21 (R2) and possibly 100,227.33 (R3), indicating continued upward momentum.
📉 Bearish Scenario: If BTC falls below 96,000.00, expect further downside toward 95,085.33 (S3), confirming a bearish trend.
🏆 Fundamental Overview & BTC/USD Impact
📌 Macroeconomic & Institutional Demand:
- Bitcoin ETF inflows remain strong, boosting institutional demand.
- Major institutions continue to accumulate BTC, providing long-term support.
- Regulatory developments in the U.S. and EU could impact market sentiment.
📌 Federal Reserve Policy & U.S. Dollar Impact:
- The Fed remains cautious about rate cuts, keeping bond yields steady.
- A delay in rate cuts could limit BTC’s upside as higher interest rates reduce liquidity in risk assets.
- U.S. inflation data due this week could impact Bitcoin’s movement.
📌 On-Chain Metrics & Market Sentiment:
- Bitcoin’s hash rate remains strong, indicating network security and miner confidence.
- BTC’s supply on exchanges continues to decline, suggesting long-term accumulation by whales.
- Funding rates remain neutral, meaning no extreme bullish or bearish bias among traders.
📌 Key Events to Watch This Week:
- U.S. CPI Report: A higher-than-expected figure may strengthen USD and pressure Bitcoin.
- Bitcoin ETF inflows: Institutional demand trends will be key for BTC’s direction.
- Regulatory developments: Any new rulings from the SEC or EU could impact market sentiment.
📉 Outlook for BTC/USD
✔️ Bullish Scenario:
- A break above 98,500.00 (61.8% Fibonacci level) could push BTC toward 99,245.21 (R2) and 100,227.33 (R3) if bullish momentum continues.
❌ Bearish Scenario:
- A drop below 97,800.00 (38.2% Fibonacci retracement) could accelerate selling toward 96,000.00 (Lower Bollinger Band & Key Support).
⚖️ Neutral/Balanced View:
- With strong ETF demand supporting BTC but rate cut uncertainty, Bitcoin may consolidate between 96,000 – 99,500 until key data releases provide further direction.
📌 Final Takeaway:
- Watch for breakouts at key Fibonacci and Bollinger Band levels.
- Monitor ETF flows and institutional buying trends for confirmation of trend direction.
- MACD & Stochastic indicate mixed signals, meaning patience is required before committing to a strong directional trade.
🔥 Trading Plan Summary:
- Buy Zone: 96,000 – 97,800 (If supported by bullish reversal)
- Sell Zone: 99,500 – 100,227 (If bearish confirmation appears)
- Breakout Watch:
- Above 100,000: Bullish breakout to higher resistance.
- Below 96,000: Bearish breakdown toward lower support.
Disclaimer
This analysis is for educational purposes only. Bitcoin trading is highly volatile and carries significant risks. Always use proper risk and money management strategies, as trading without them can result in substantial financial loss.
————————————————————————————————————————————————————————————————————————————-
Notice: The data presented is derived from technical analysis and does not constitute financial advice. For those trading in forex, consulting a qualified financial advisor prior to making investment decisions is strongly recommended.
Caution: The information above reflects ongoing technical analysis and should not be interpreted as financial advice. Forex trading involves high volatility, and without proper knowledge, you risk losing all your capital. It is essential to consult with a financial advisor before investing.
Advisory: The insights shared are the result of technical analysis and are not intended as financial advice. Forex traders should seek advice from professional financial advisors before making any investment decisions. Remember, the forex market is highly volatile, and trading without adequate knowledge can lead to significant losses.
Important: The analysis provided is for informational purposes only and should not be seen as financial advice. Forex trading carries substantial risks, and it is advisable to consult financial advisors before proceeding with any investments. This content is intended solely for Wealth Management Education purposes.