Market Wrap: Stocks, Bonds, Commodities
Most Asian currencies weakened on Friday with the Japanese yen recovering marginally from a five-month low as strong inflation data only partially offset a dovish outlook for the Bank of Japan.
The Dow Jones Industrial Average rose 15.37 points to 42,342.24, the S&P 500 loss 0.09% to 5,867.08 and the Nasdaq Composite down 19.92 points to 19,372.77.
MSCI’s index of Asia-Pacific stocks outside Japan is down 0.98% to 702.25 levels. The Australian index was lower by 1.24% to 8,067.00. Japanese Nikkei Index decrease 0.22% today.
European stocks were negative on Friday, with the Stoxx Europe 50 Index decrease 1.58% to 4,879.05 Germany’s DAX descend 1.35% to 19,969.86, and France’s CAC lower 1.22% to 7,294.37 and U.K.’s FTSE 100 loss 1.14% to 8,105.32.
Benchmark 10-year U.S. Treasury fail as demand for safe assets slipped again, today 10-year bond yields 0.43% to 4.5500.
U.S. President-elect Donald Trump said on Friday that the European Union must purchase U.S. oil and gas to make up for its “tremendous deficit” with the world’s largest economy, or face tariffs.
Spot Brent crude oil decrease 0.60% to $72.44 per barrel. US West Texas Intermediate crude is decrease 2.28% to $69.97 a barrel.
The yellow metal gold is up 0.39% to 2,618.24 dollars per ounce.
Market Wrap: Forex
British retail sales rose by a weaker-than-expected 0.2% in November, according to figures from the Office for National Statistics which added to signs of slow momentum in the economy.
Today, the U.S. dollar index measures the Greenback against a trade-weighted basket of six major currencies, which either descend 0.14% to 108.050.
The Euro US Dollar (EUR/USD) is a widely traded is up 0.16% today. This left the pair trading around $1.03790.
The Japanese yen was will move negative against the U.S. dollar on Friday. Today USD/JPY is trades pair that decrease 0.37% to the 156.84 level.
Another commodity-related currency positive against the U.S dollar, AUD/USD gain 0.02% to 0.62380, and NZD/USD increase 0.11% to 0.56360 level.
EUR/USD Intraday: Trend on the upside
Our pivot point is at 1.03660
Preferable Price Action: Take buy positions above pivot level with targets at 1.03960 & 1.04230 in extension.
Alternative Price Action: Sell pivot looks for a further downside to 1.03380 & 1.03120.
Comment: RSI is above 50 levels .
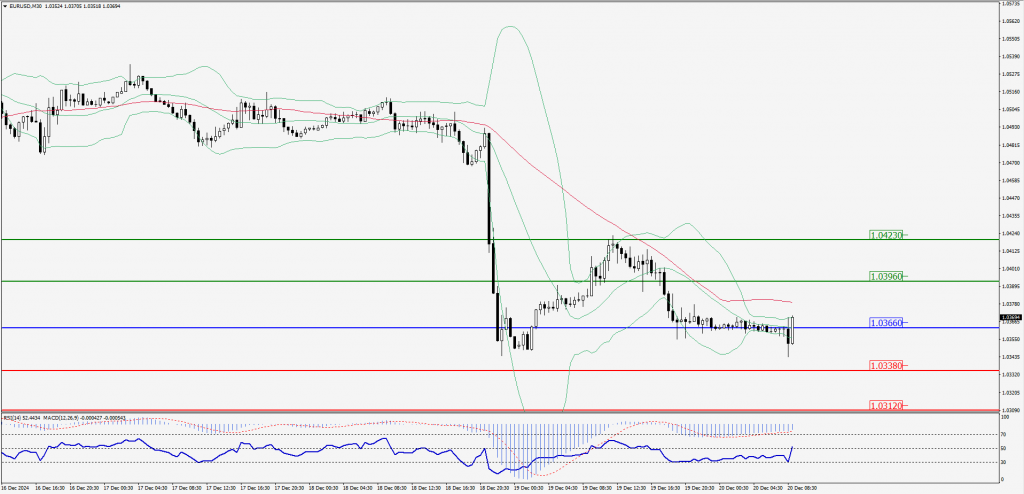
Green Lines Indicate Resistance Levels – Red Lines Indicate Support Levels
Light Blue is a Pivot Point – Black represents the price when the report was produced
GBP/USD Intraday: Trend on the downside
Our pivot point is at 1.25090
Preferable Price Action: Sell positions below pivot with targets at 1.24680 & 1.24360 in extension.
Alternative Price Action: The price above pivot would call for further upside to 1.25510 & 1.25860.
Comment: RSI is below 50 levels and pairs below its 55MA.
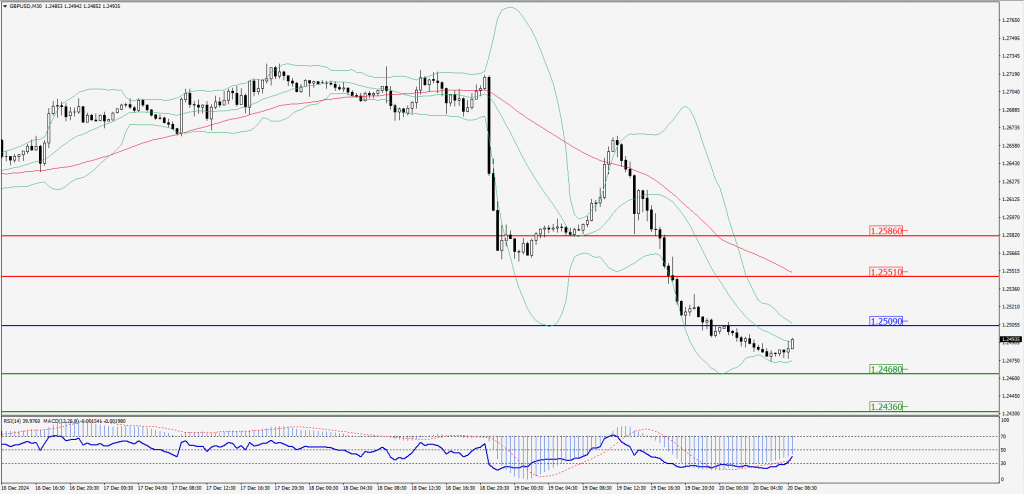
Green Lines Indicate Resistance Levels – Red Lines Indicate Support Levels
Light Blue is a Pivot Point – Black represents the price when the report was produced
USD/JPY Intraday: Trend on the downside
Our pivot point is at 157.170
Preferable Price Action: Sell position below pivot with the target at 156.550 and 155.970 in extension.
Alternative Price Action: The upside breakout of the pivot would call for 157.780 and 158.330.
Comment: MACD is below 50 levels and pairs below its 20MA.
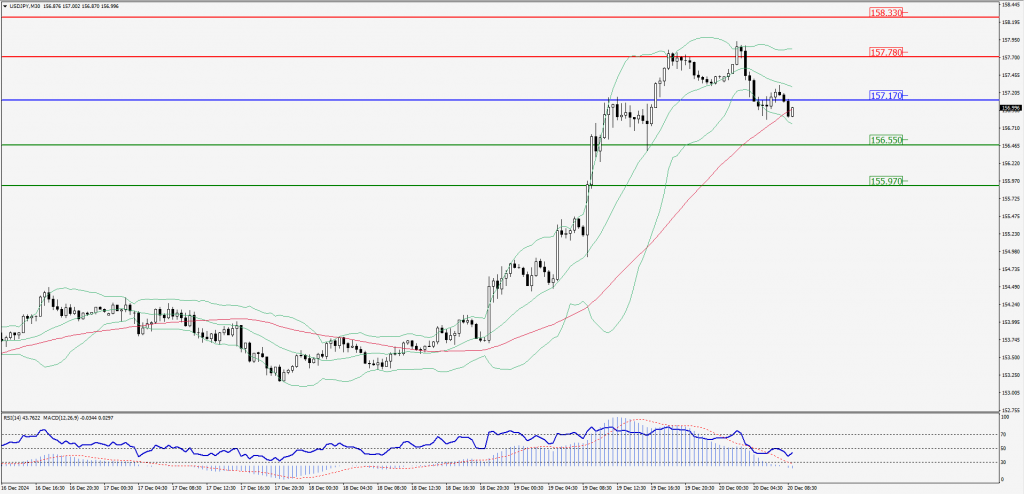
Green Lines Indicate Resistance Levels – Red Lines Indicate Support Levels
Light Blue is a Pivot Point – Black represents the price when the report was produced
AUD/USD Intraday: Trend on the upside
Our pivot point is at 0.62340
Preferable Price Action: Buy positions above pivot with targets at 0.62540 & 0.62720 in extension.
Alternative Price Action: Below pivot a further downside with 0.62540 & 0.62720 as targets.
Comment: RSI is above 50 levels and pairs above its 20MA.
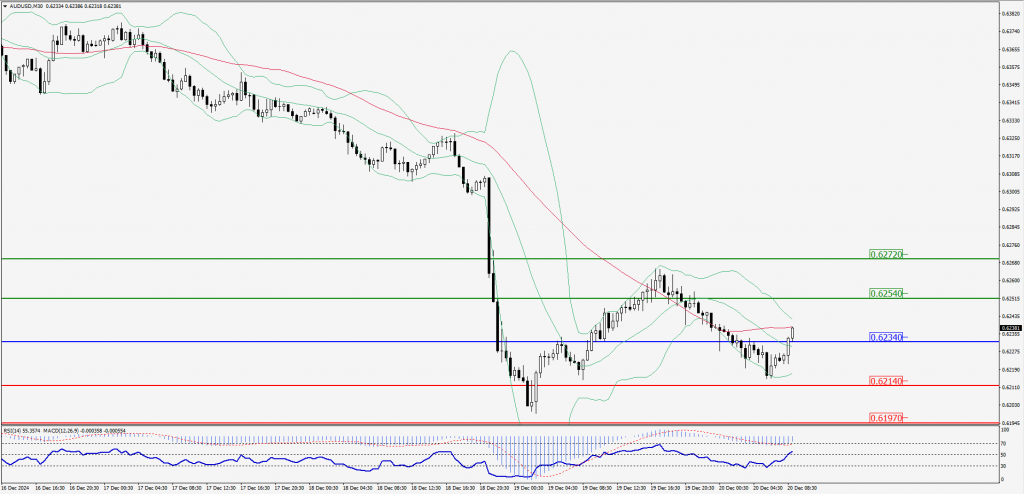
Green Lines Indicate Resistance Levels – Red Lines Indicate Support Levels
Light Blue is a Pivot Point – Black represents the price when the report was produced
CRUDEOIL Intraday: Trend on the downside
Our pivot point is at 69.21
Preferable Price Action: Below pivot sell oil with 68.96 & 68.76 as targets.
Alternative Price Action: Buy crude above pivot with targets at 69.45 & 69.66 in extension.
Comment: RSI is at below 50 levels and pairs below its 55MA.
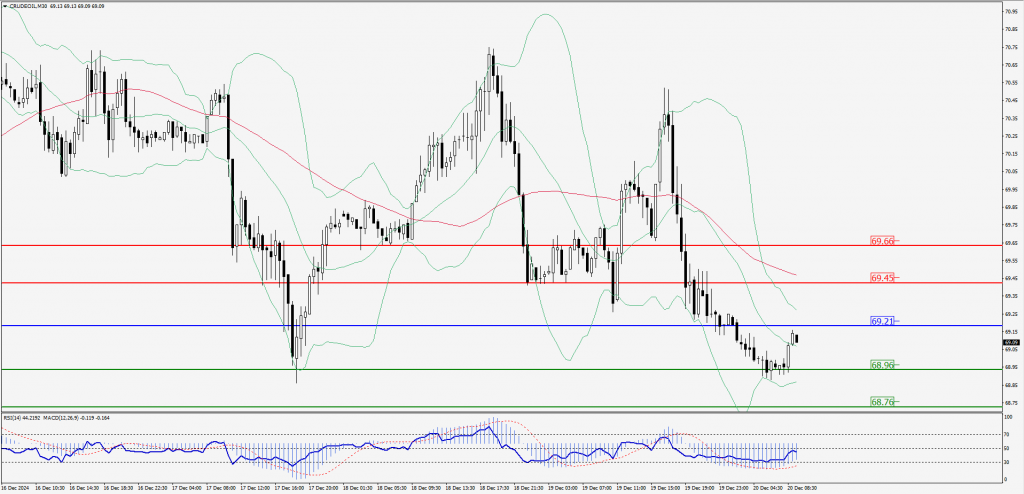
Green Lines Indicate Resistance Levels – Red Lines Indicate Support Levels
Light Blue is a Pivot Point – Black represents the price when the report was produced
XAU/USD Intraday: Trend on the upside
Our pivot point is at 2602.20
Preferable Price Action: Further upside to 2612.20 and 2521.10.
Alternative Price Action: If the price gives an downside breakout of a pivot, then the price extends to 2692.40 and 2583.90.
Comment: MACD is above 50 levels and pairs above its 20MA.
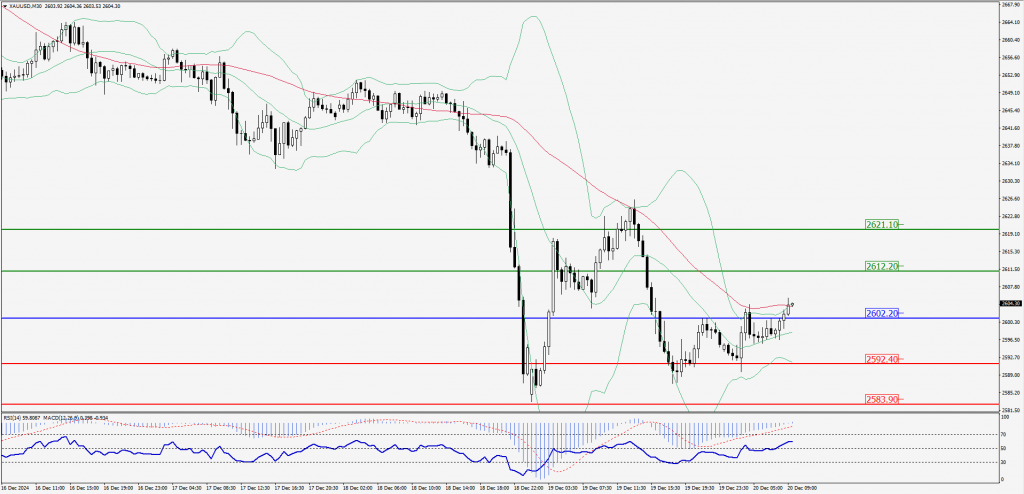
Green Lines Indicate Resistance Levels – Red Lines Indicate Support Levels
Light Blue is a Pivot Point – Black represents the price when the report was produced
Dow Jones Intraday: Trend on the downside
Our pivot point is 42,443.20
Preferable Price Action: Take sell positions below the pivot with targets at 42,198.40 & 42,006.10.
Alternative Price Action: Above 42,443.20 looks for further upside to 42,687.90 & 42,687.90.
Comment: RSI is below 50 levels and pairs below its 55MA.
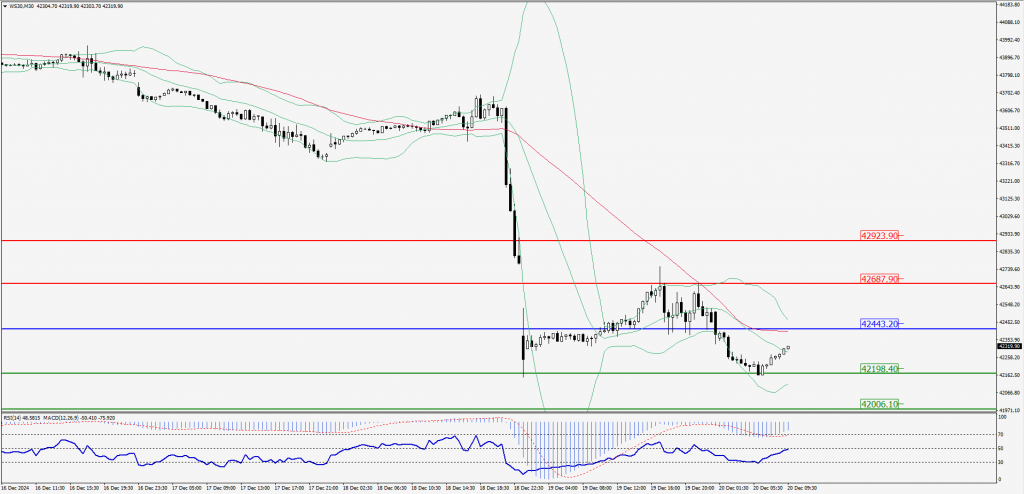
Green Lines Indicate Resistance Levels – Red Lines Indicate Support Levels
Light Blue is a Pivot Point – Black represents the price when the report was produced