Market Wrap: Stocks, Bonds, Commodities
Most Asian currencies were largely unchanged on Wednesday, while the Japanese yen firmed against the dollar as markets were worried about the implications of new tariffs under incoming U.S. President Donald Trump.
The Dow Jones Industrial Average rose 123.74 points to 44,860.31, the S&P 500 gain 0.57% to 6,021.60 and the Nasdaq Composite up 119.46 points to 19,174.30.
MSCI’s index of Asia-Pacific stocks outside Japan is down 0.42% to 706.79 levels. The Australian index was higher by 0.57% to 8,406.70. Japanese Nikkei Index decrease 0.78% today.
European stocks were mixed on Wednesday, with the Stoxx Europe 50 Index decrease 0.79% to 4,762.05 Germany’s DAX descend 0.56% to 19.295.98, and France’s CAC lower 0.87% to 7,194.51 and U.K.’s FTSE 100 loss 0.40% to 8,258.61.
Benchmark 10-year U.S. Treasury fail as demand for safe assets slipped again, today 10-year bond yields 0.42% to 4.2870.
Oil prices steadied on Wednesday, with markets assessing the potential impact of a ceasefire deal between Israel and Hezbollah, and ahead of Sunday’s OPEC+ meeting of producers.
Spot Brent crude oil increase 0.51% to $72.69 per barrel. US West Texas Intermediate crude is increase 0.39% to $69.16 a barrel.
The yellow metal gold is up 0.98% to 2,672.16 dollars per ounce.
Market Wrap: Forex
Bank of America Global Research (B of A) maintains a bearish stance on the Japanese yen (JPY) heading into 2025, projecting the USD/JPY exchange rate to reach 160 by the year’s end. The path, however, is expected to be uneven, shaped by U.S. policy shifts.
Today, the U.S. dollar index measures the Greenback against a trade-weighted basket of six major currencies, which either descend 0.23% to 106.722.
The Euro US Dollar (EUR/USD) is a widely traded is up 0.03% today. This left the pair trading around $1.04900.
The Japanese yen was will move negative against the U.S. dollar on Wednesday. Today USD/JPY is trades pair that decrease 0.69% to the 152.05 level.
Another commodity-related currency negative against the U.S dollar, AUD/USD gain 0.15% to 0.64820, and NZD/USD increase 0.67% to 0.58730 level.
EUR/USD Intraday: Trend on the downside
Our pivot point is at 1.04900
Preferable Price Action: Take sell positions below pivot level with targets at 1.04610 & 1.04360 in extension.
Alternative Price Action: Buy pivot looks for a further upside to 1.05170 & 1.05400.
Comment: RSI is above 50 levels and pairs above its 20MA.
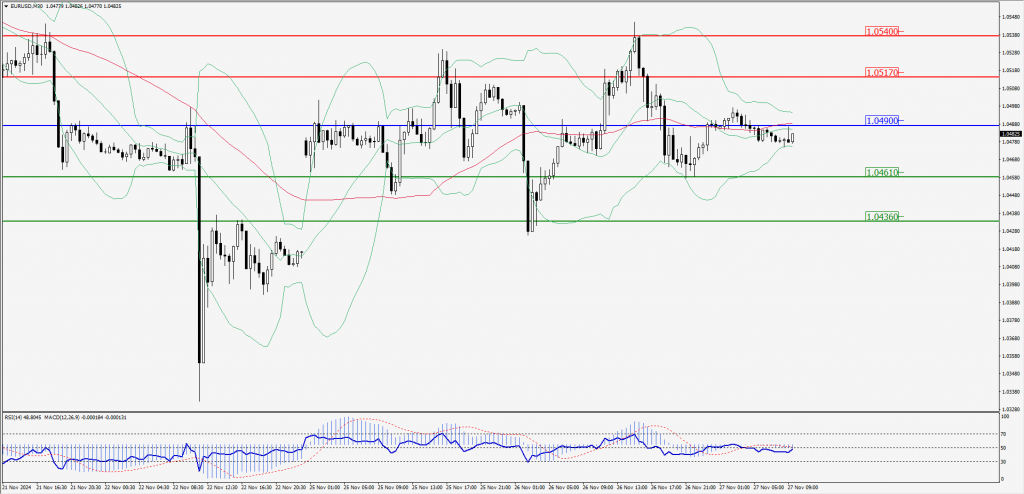
Green Lines Indicate Resistance Levels – Red Lines Indicate Support Levels
Light Blue is a Pivot Point – Black represents the price when the report was produced
GBP/USD Intraday: Trend on the upside
Our pivot point is at 1.25690
Preferable Price Action: Buy positions above pivot with targets at 1.25900 & 1.26070 in extension.
Alternative Price Action: The price below pivot would call for further downside to 1.25470 & 1.25290.
Comment: RSI is above 50 levels and pairs above its 55MA.
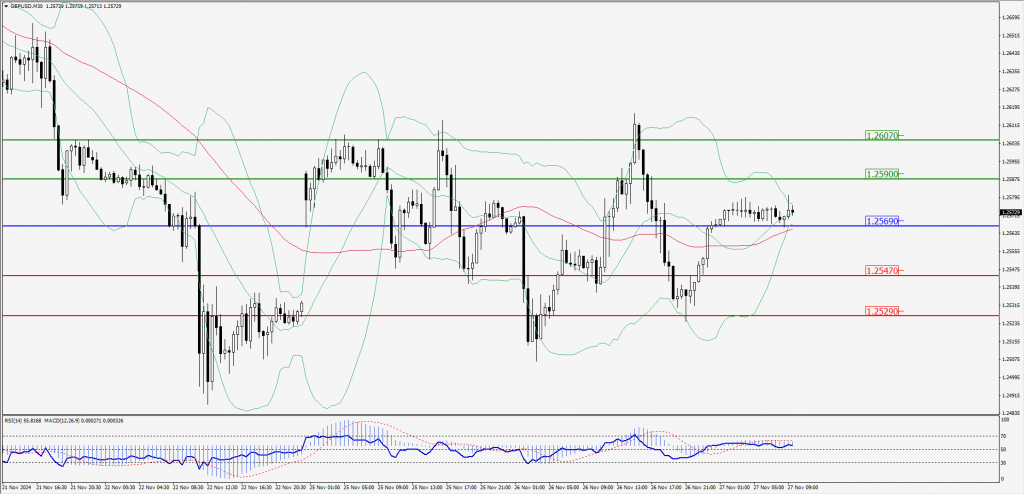
Green Lines Indicate Resistance Levels – Red Lines Indicate Support Levels
Light Blue is a Pivot Point – Black represents the price when the report was produced
USD/JPY Intraday: Major trend on the downside
Our pivot point is at 152.230
Preferable Price Action: Sell position below pivot with the target at 151.730 and 151.300 in extension.
Alternative Price Action: The upside breakout of the pivot would call for 152.760 and 153.180.
Comment: MACD is below 50 levels and pairs below its 55MA & 20MA.
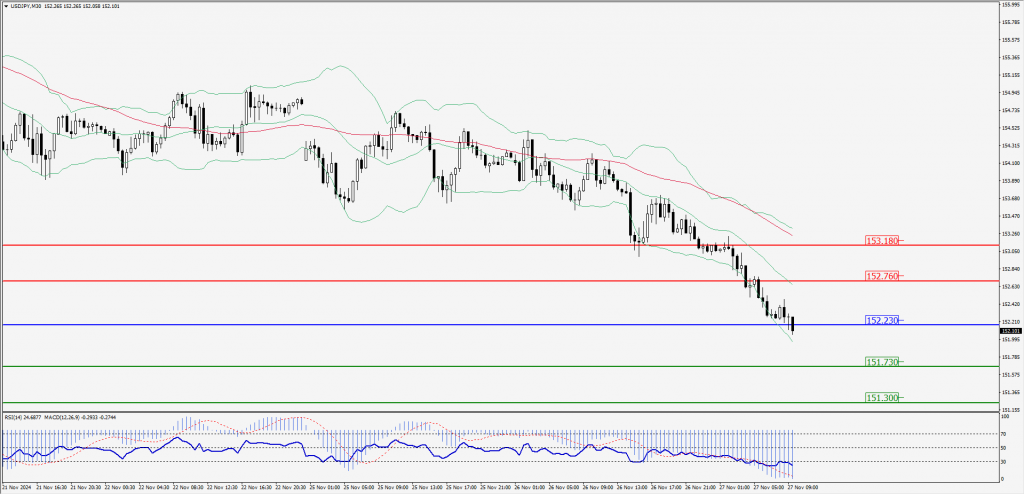
Green Lines Indicate Resistance Levels – Red Lines Indicate Support Levels
Light Blue is a Pivot Point – Black represents the price when the report was produced
AUD/USD Intraday: Trend on the upside
Our pivot point is at 0.64750
Preferable Price Action: Buy positions above pivot with targets at 0.64890 & 0.65020 in extension.
Alternative Price Action: Below pivot a further downside with 0.64610 & 0.64490 as targets.
Comment: RSI is above 50 levels.
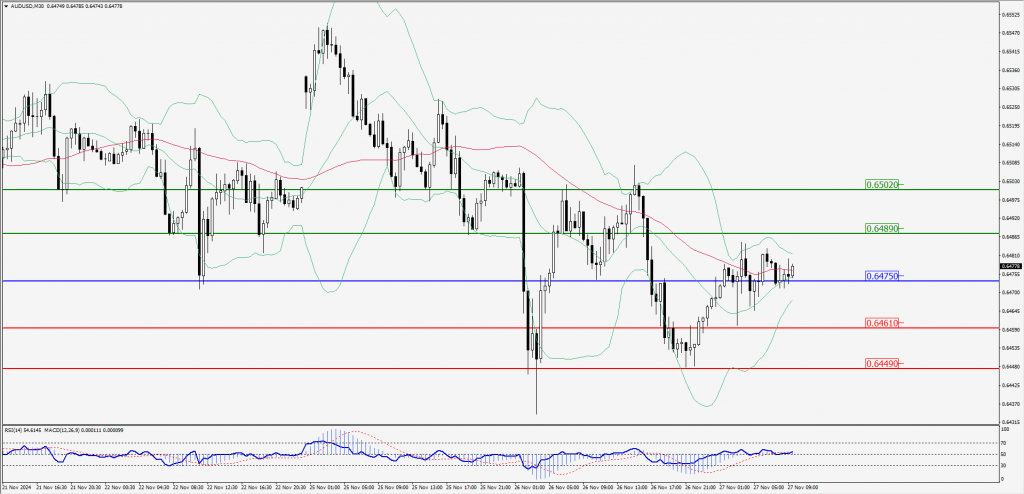
Green Lines Indicate Resistance Levels – Red Lines Indicate Support Levels
Light Blue is a Pivot Point – Black represents the price when the report was produced
CRUDEOIL Intraday: Trend on the upside
Our pivot point is at 68.72
Preferable Price Action: Above pivot buy oil with 69.16 & 69.55 as targets.
Alternative Price Action: Sell crude below pivot with targets at 68.29 & 67.93 in extension.
Comment: RSI is at above 50 levels and pairs above its 20MA.
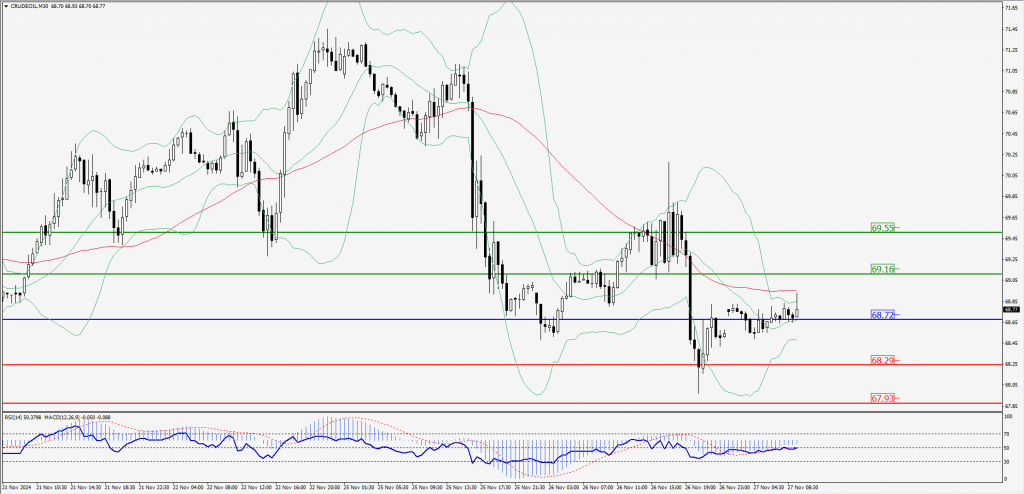
Green Lines Indicate Resistance Levels – Red Lines Indicate Support Levels
Light Blue is a Pivot Point – Black represents the price when the report was produced
XAU/USD Intraday: Trend on the upside
Our pivot point is at 2643.60
Preferable Price Action: Further upside to 2659.80 and 2673.80.
Alternative Price Action: If the price gives an downside breakout of a pivot, then the price extends to 2627.40 and 2613.70.
Comment: MACD is above 50 levels and pairs above its 20MA & 55MA.
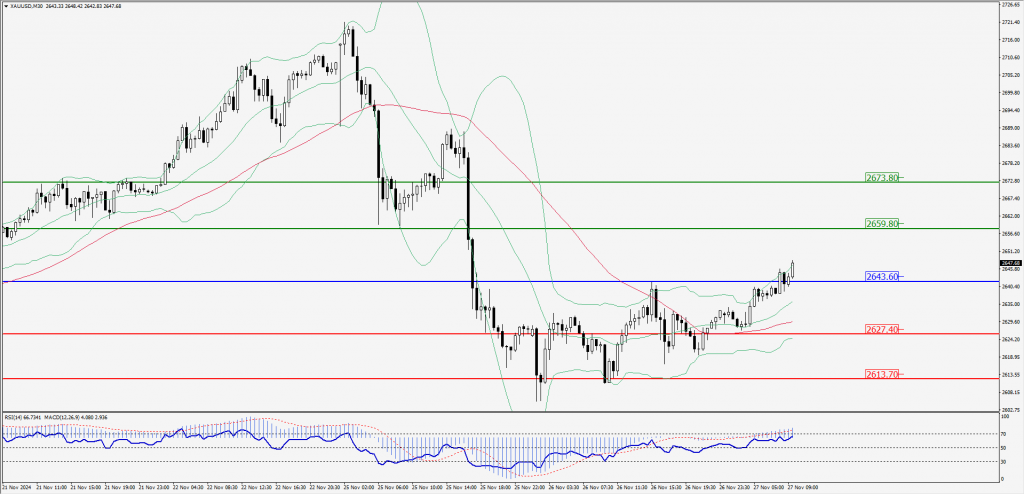
Green Lines Indicate Resistance Levels – Red Lines Indicate Support Levels
Light Blue is a Pivot Point – Black represents the price when the report was produced
Dow Jones Intraday: Trend on the upside
Our pivot point is 44,806.50
Preferable Price Action: Take buy positions above the pivot with targets at 45,096.60 & 45,316.50.
Alternative Price Action: Below 44,806.50 looks for further downside to 44,533.00 & 44,292.40.
Comment: RSI is above 50 levels and pairs above its 55MA.
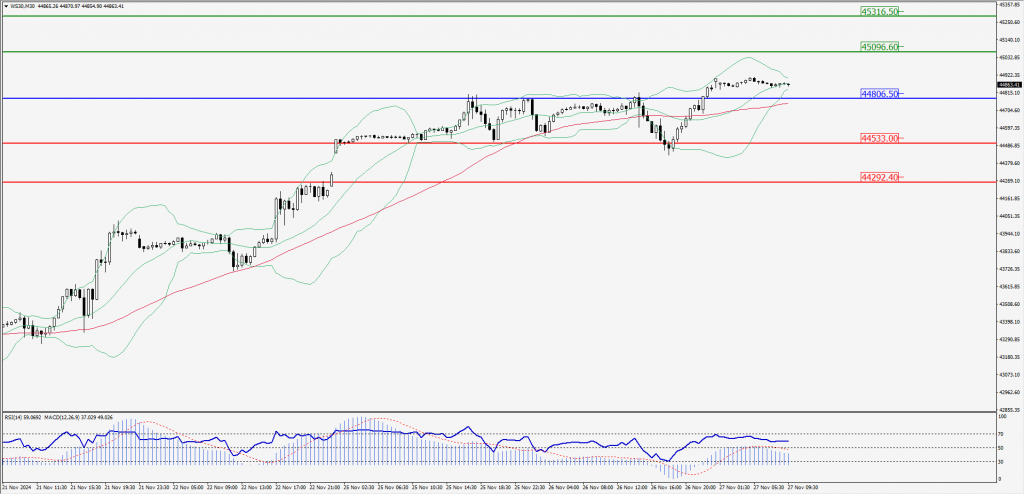
Green Lines Indicate Resistance Levels – Red Lines Indicate Support Levels
Light Blue is a Pivot Point – Black represents the price when the report was produced