Market Wrap: Stocks, Bonds, Commodities
The U.S. dollar steadied Tuesday as investors look forward to the release of key economic data, including Friday’s U.S. payrolls, that could cement an interest rate cut from the Federal Reserve later this month.
The Dow Jones Industrial Average gain 228.03 points to 41,563.08, the S&P 500 rose 1.01% to 5,648.40 and the Nasdaq Composite ascend 197.19 points to 17,713.62.
MSCI’s index of Asia-Pacific stocks outside Japan is down 0.84% to 698.70 levels. The Australian index was lower by 0.08% to 8,103.20. Japanese Nikkei Index increase 0.14% today.
European stocks were mixed on Tuesday, with the Stoxx Europe 50 Index increase 0.15% to 4,980.55 Germany’s DAX ascend 0.20% to 18,962.95, and France’s CAC higher 0.25% to 7,665.59 and U.K.’s FTSE 100 gain 0.12% to 8,373.66.
Benchmark 10-year U.S. Treasury fail as demand for safe assets slipped again, today 10-year bond yields 0.16% to 3.903.
Brent oil prices fell on Tuesday as sluggish economic growth in China, the world’s biggest crude importer, increased worries about demand that overshadowed the impact of the halt of production and exports from Libya.
Spot Brent crude oil decrease 0.70% to $76.98 per barrel. US West Texas Intermediate crude is increase 0.19% to $73.69 a barrel.
The yellow metal gold is up 0.27 % to 2,534.40 dollars per ounce.
Market Wrap: Forex
The dollar inched higher and held close to a two-week high on Tuesday as investors geared up for a slew of economic data, including Friday’s U.S. payrolls, that could influence the size of an expected interest rate cut from the Federal Reserve.
Today, the U.S. dollar index measures the Greenback against a trade-weighted basket of six major currencies, which decrease 0.01% to 101.617.
The Euro US Dollar (EUR/USD) is a widely traded is down 0.13% today. This left the pair trading around $1.10570.
The Japanese yen was will move positive against the U.S. dollar on Tuesday. Today USD/JPY is trades pair that decrease 0.71% to the 145.860 level.
Another commodity-related currency mixed against the U.S dollar, AUD/USD gain 0.59% to 0.67500, and NZD/USD decrease 0.49% to 0.62000 level.
EUR/USD Intraday: Trend on the downside
Our pivot point is at 1.10650
Preferable Price Action: Take sell positions below pivot level with targets at 1.10520 & 1.10410 in extension.
Alternative Price Action: Buy pivot looks for a further upside to 1.10780 & 1.10890.
Comment: RSI is below 50 levels and Pairs below its 20MA & 55MA.
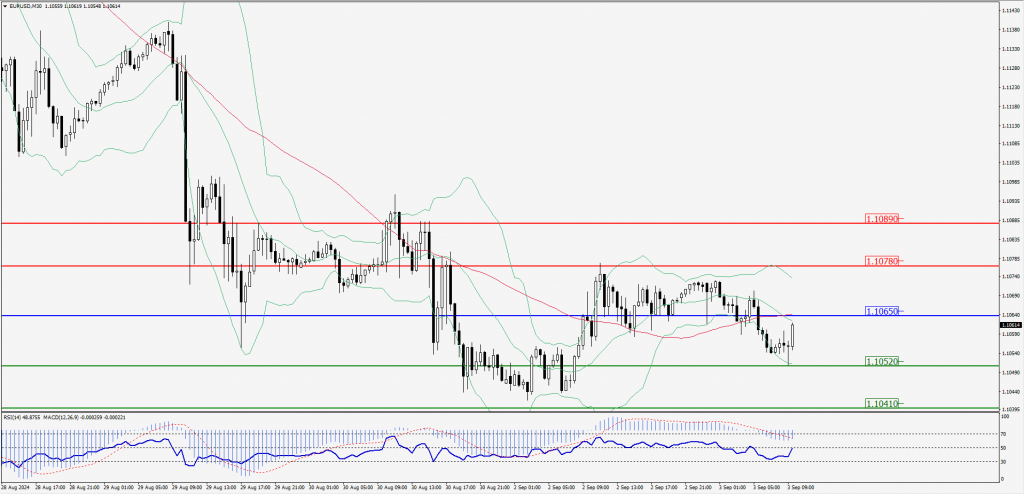
Green Lines Indicate Resistance Levels – Red Lines Indicate Support Levels
Light Blue is a Pivot Point – Black represents the price when the report was produced
GBP/USD Intraday: Trend on the downside
Our pivot point is at 1.31240
Preferable Price Action: Sell positions below pivot with targets at 1.31050 & 1.30880 in extension.
Alternative Price Action: The price above pivot would call for further upside to 1.31430 & 1.31610.
Comment: RSI is below 50 levels and Pairs below its 20MA & 55MA.
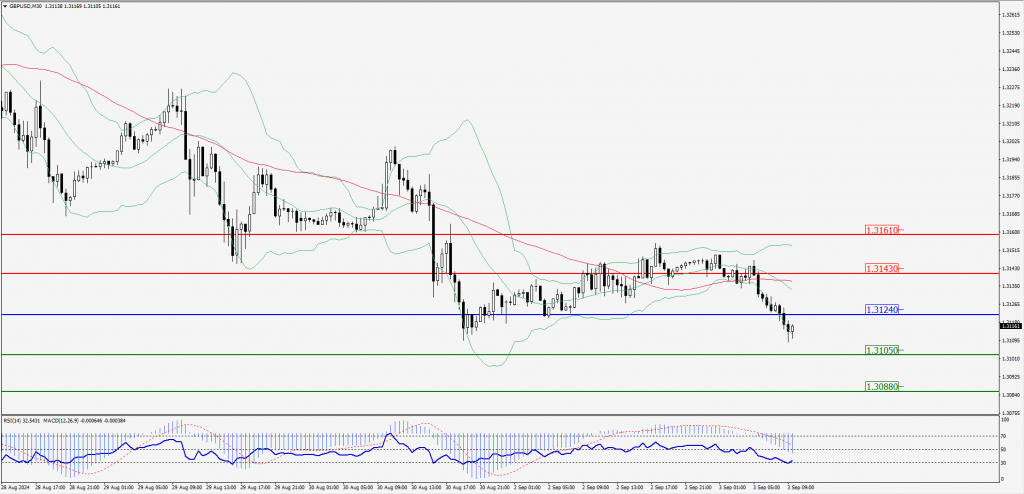
Green Lines Indicate Resistance Levels – Red Lines Indicate Support Levels
Light Blue is a Pivot Point – Black represents the price when the report was produced
USD/JPY Intraday: Trend on the downside
Our pivot point is at 146.220
Preferable Price Action: Sell position below pivot with the target at 145.760 and 145.390 in extension.
Alternative Price Action: The upside breakout of the pivot would call for 146.640 and 147.000.
Comment: MACD is below 50 levels and Pairs below its 55MA & 20MA.
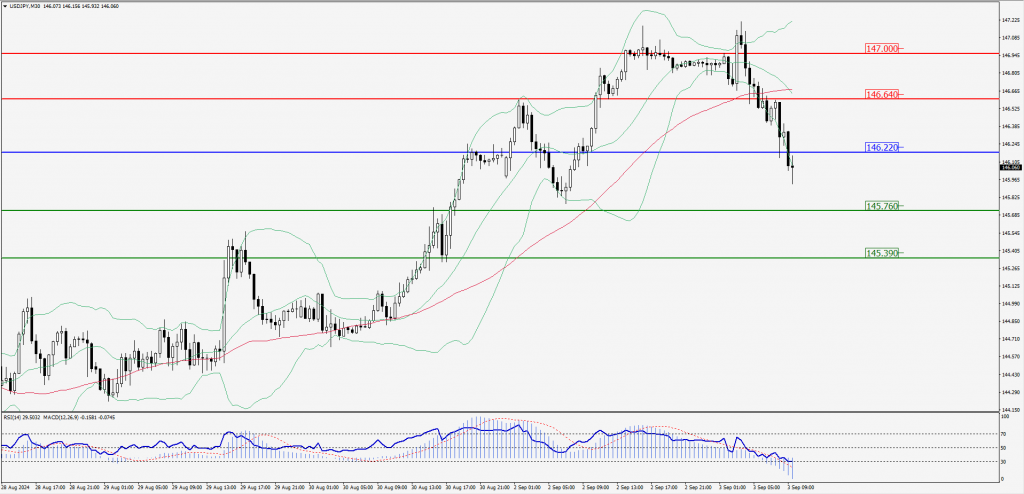
Green Lines Indicate Resistance Levels – Red Lines Indicate Support Levels
Light Blue is a Pivot Point – Black represents the price when the report was produced
AUD/USD Intraday: Major trend on the downside
Our pivot point is at 0.67460
Preferable Price Action: Sell positions below pivot with targets at 0.67310 & 0.67190 in extension.
Alternative Price Action: Above pivot a further upside with 0.67600 & 0.67730 as targets.
Comment: RSI is below 50 levels and pairs below its 20MA & 55MA.
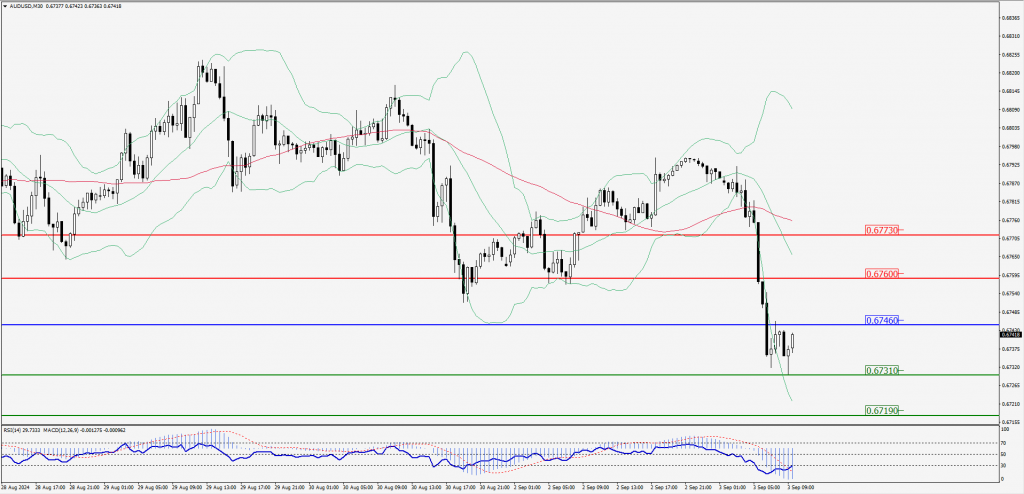
Green Lines Indicate Resistance Levels – Red Lines Indicate Support Levels
Light Blue is a Pivot Point – Black represents the price when the report was produced
CRUDEOIL Intraday: Trend on the upside
Our pivot point is at 73.38
Preferable Price Action: Above pivot buy oil with 73.96 & 74.49 as targets.
Alternative Price Action: Sell crude below pivot with targets at 72.86 and 72.39 in extension.
Comment: RSI is at above 50 levels and pairs above its 55MA & 20MA.
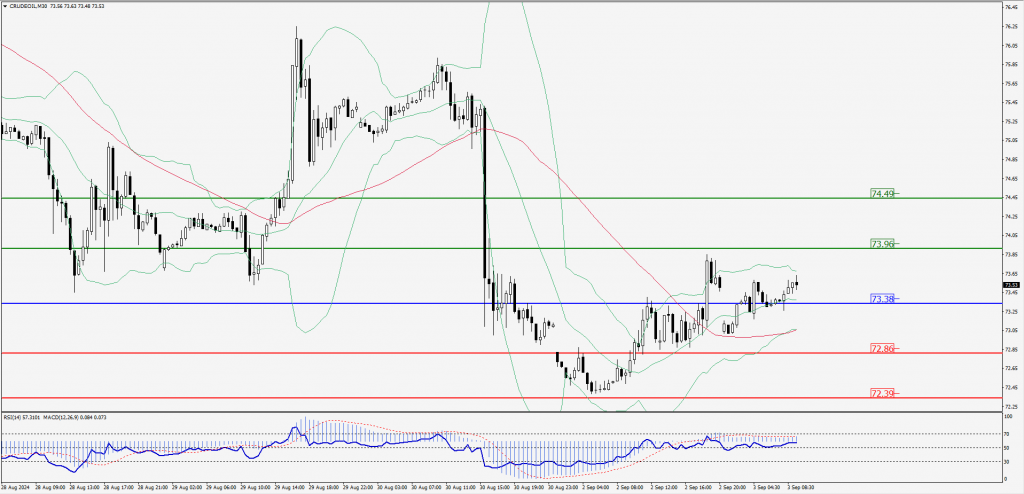
Green Lines Indicate Resistance Levels – Red Lines Indicate Support Levels
Light Blue is a Pivot Point – Black represents the price when the report was produced
XAU/USD Intraday: Trend on the upside
Our pivot point is at 2496.70
Preferable Price Action: Further upside to 2502.30 and 2507.50.
Alternative Price Action: If the price gives an downside breakout of a pivot, then the price extends to 2491.50 and 2486.50.
Comment: MACD is above 50 levels.
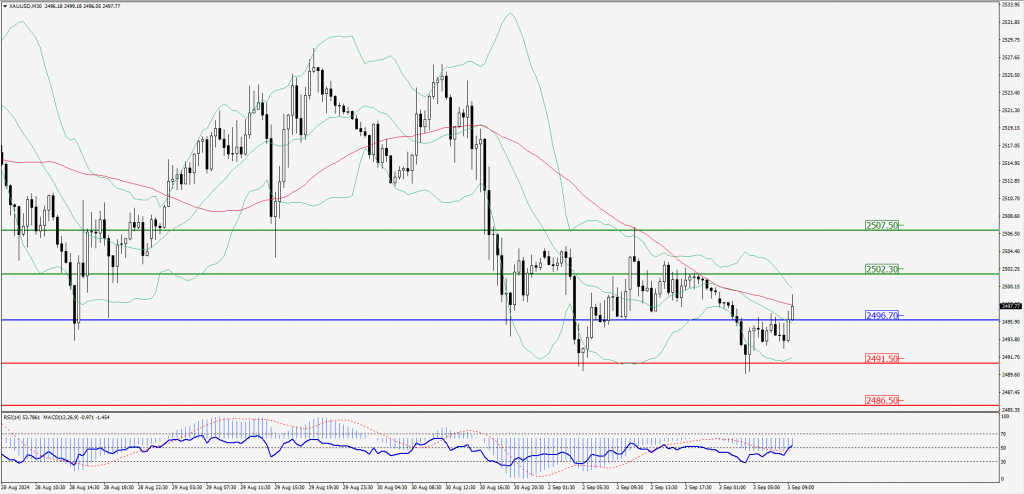
Green Lines Indicate Resistance Levels – Red Lines Indicate Support Levels
Light Blue is a Pivot Point – Black represents the price when the report was produced
Dow Jones Intraday: Trend on the upside
Our pivot point is 41,479.90
Preferable Price Action: Take buy positions above the pivot with targets at 41,609.40 & 41,717.10.
Alternative Price Action: Below 41,479.90 looks for further downside to 41,354.60 & 41,222.40.
Comment: RSI is above 50 levels.
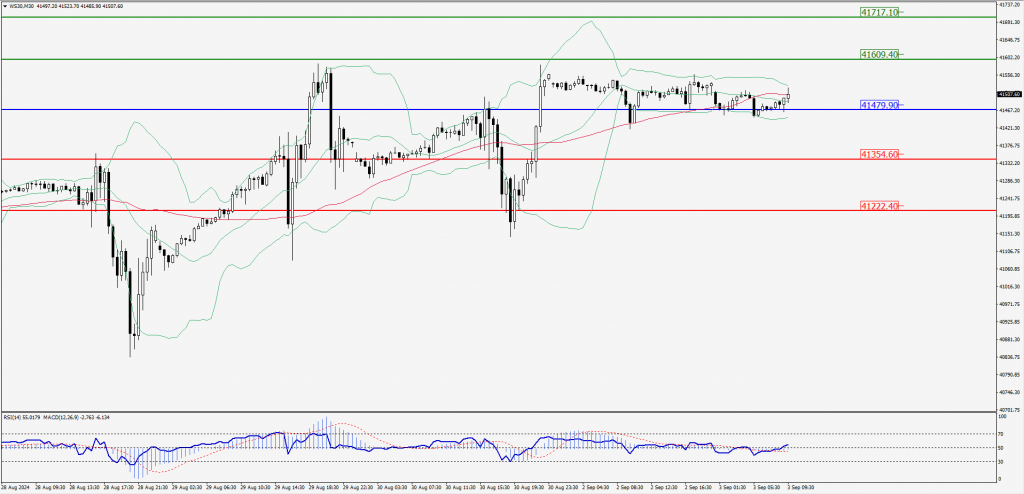
Green Lines Indicate Resistance Levels – Red Lines Indicate Support Levels
Light Blue is a Pivot Point – Black represents the price when the report was produced