Market Wrap: Stocks, Bonds, Commodities
The yen rose sharply on Monday and the euro touched its highest this year as the dollar retreated broadly with traders bracing for dovish signals from Federal Reserve meeting minutes and Chair Jerome Powell’s speech at Jackson Hole
The Dow Jones Industrial Average rose 96.70 points to 40,659.76, the S&P 500 gain 0.20% to 5,554.25 and the Nasdaq Composite ascend 37.22 points to 17,631.72.
MSCI’s index of Asia-Pacific stocks outside Japan is up 0.83% to 702.97 levels. The Australian index was higher by 0.12% to 7,980.40. Japanese Nikkei Index decrease 2.01% today.
European stocks were mixed on Monday, with the Stoxx Europe 50 Index increase 0.37% to 4,858.35, Germany’s DAX ascend 0.07% to 18,341.65, and France’s CAC higher 0.34% to 7,475.37 and U.K.’s FTSE 100 loss 0.11% to 8,302.05.
Benchmark 10-year U.S. Treasury rose as demand for safe assets slipped again, today 10-year bond yields decrease 0.51% to 3.8750.
Oil prices eased in trading on Monday as fears of weaker demand in top oil importer China weighed on market sentiment while investors focused on the progress of ceasefire talks in the Middle East, which could reduce supply risks.
Spot Brent crude oil decrease 1.10% to $78.80 per barrel. US West Texas Intermediate crude is decrease 1.16% to $74.66 a barrel.
The yellow metal gold is down 0.24% to 2,531.60 dollars per ounce.
Market Wrap: Forex
The U.S. dollar fell Monday ahead of the release of minutes from the Federal Reserve’s July policy meeting and Chair Jerome Powell’s upcoming speech at Jackson Hole later this week.
Today, the U.S. dollar index measures the Greenback against a trade-weighted basket of six major currencies, which decrease 0.21% to 102.095.
The Euro US Dollar (EUR/USD) is a widely traded pair that is increase 0.03% today. This left the pair trading around $1.10310.
The Japanese yen was will move negative against the U.S. dollar on Monday. Today USD/JPY is trades pair that decrease 0.78% to the 146.440 level.
Another commodity-related currency positive against the U.S dollar, AUD/USD gain 0.34% to 0.66880, and NZD/USD increase 0.27% to 0.60690 level.
EUR/USD Intraday: Trend on the upside
Our pivot point is at 1.10200
Preferable Price Action: Take buy positions above pivot level with targets at 1.10820 & 1.11320 in extension.
Alternative Price Action: Sell pivot looks for a further downside to 1.09645 & 1.09130.
Comment: RSI is above 50 levels and Pairs above its 55MA.
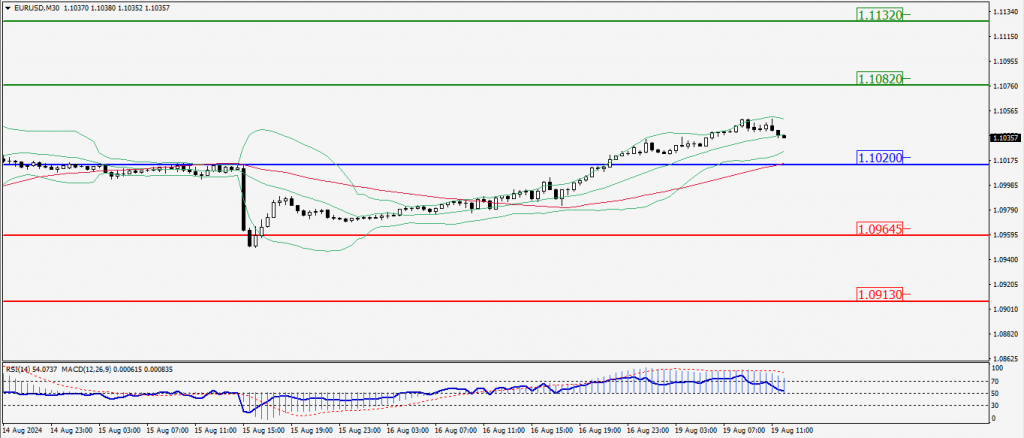
Green Lines Indicate Resistance Levels – Red Lines Indicate Support Levels
Light Blue is a Pivot Point – Black represents the price when the report was produced
GBP/USD Intraday: Trend on the upside
Our pivot point is at 1.29320
Preferable Price Action: Buy positions above pivot with targets at 1.30310 & 1.31130 in extension.
Alternative Price Action: The price below pivot would call for further downside to 1.28480 & 1.27700.
Comment: RSI is above 50 levels and Pairs above its 20MA & 55MA.
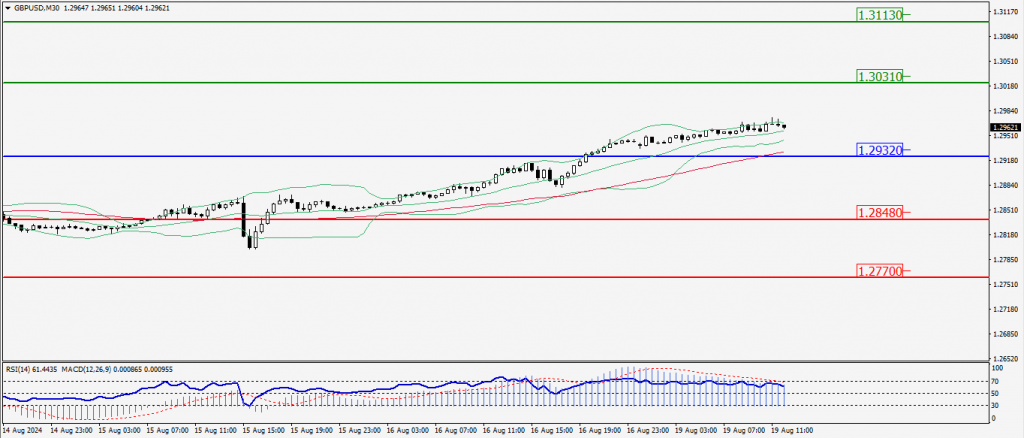
Green Lines Indicate Resistance Levels – Red Lines Indicate Support Levels
Light Blue is a Pivot Point – Black represents the price when the report was produced
USD/JPY Intraday: Trend on the downside
Our pivot point is at 146.610
Preferable Price Action: Sell position below pivot with the target at 145.525 and 144.580 in extension.
Alternative Price Action: The upside breakout of the pivot would call for 147.590 and 148.485.
Comment: MACD is below 50 levels and Pairs below its 20MA and 55MA.
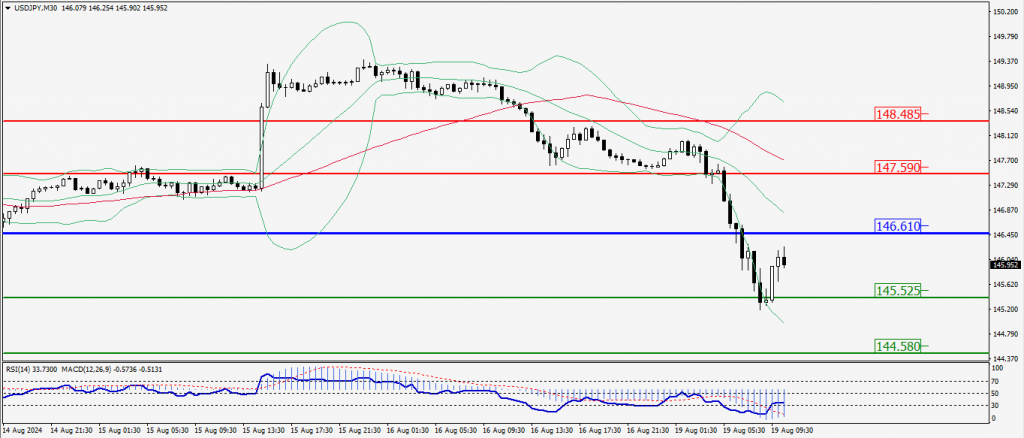
Green Lines Indicate Resistance Levels – Red Lines Indicate Support Levels
Light Blue is a Pivot Point – Black represents the price when the report was produced
AUD/USD Intraday: Trend on the upside
Our pivot point is at 0.66680
Preferable Price Action: Buy positions above pivot with targets at 0.67270 & 0.67760 in extension.
Alternative Price Action: Below pivot a further downside with 0.66060 & 0.65585 as targets.
Comment: RSI is above 50 levels and pairs above its 55MA.
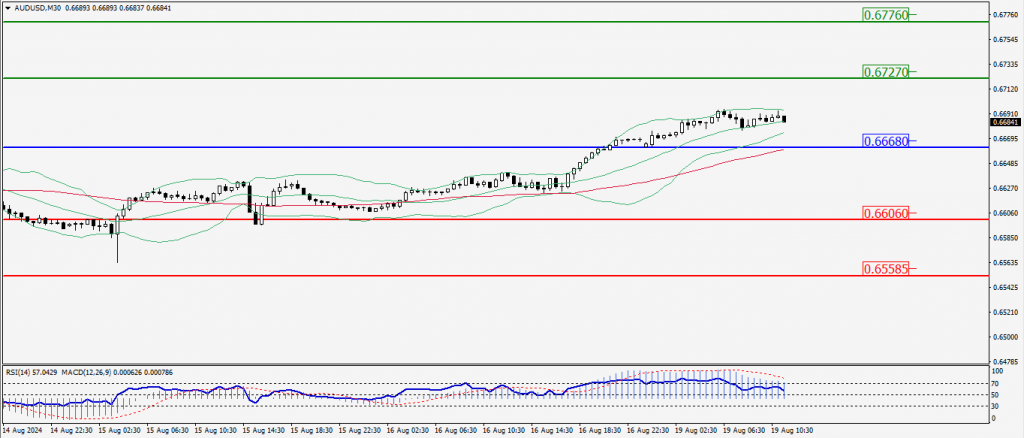
Green Lines Indicate Resistance Levels – Red Lines Indicate Support Levels
Light Blue is a Pivot Point – Black represents the price when the report was produced
CRUDEOIL Intraday: Trend on the downside
Our pivot point is at 75.54
Preferable Price Action: Below pivot sell oil with 74.37 & 73.39 as targets.
Alternative Price Action: Buy crude above pivot with targets at 76.72 and 77.63 in extension.
Comment: RSI is below 50 levels and pairs below its 20MA and 55MA.
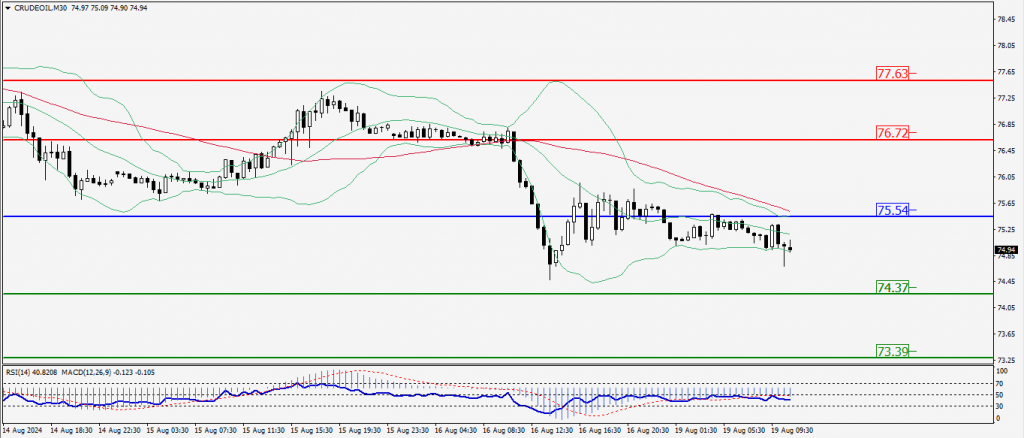
Green Lines Indicate Resistance Levels – Red Lines Indicate Support Levels
Light Blue is a Pivot Point – Black represents the price when the report was produced
XAU/USD Intraday: Trend on the upside
Our pivot point is at 2488.30
Preferable Price Action: Further upside to 2577.30 and 2558.80.
Alternative Price Action: If the price gives an downside breakout of a pivot, then the price extends to 2450.50 and 2415.40.
Comment: MACD is above 50 levels and pairs above its 55MA.
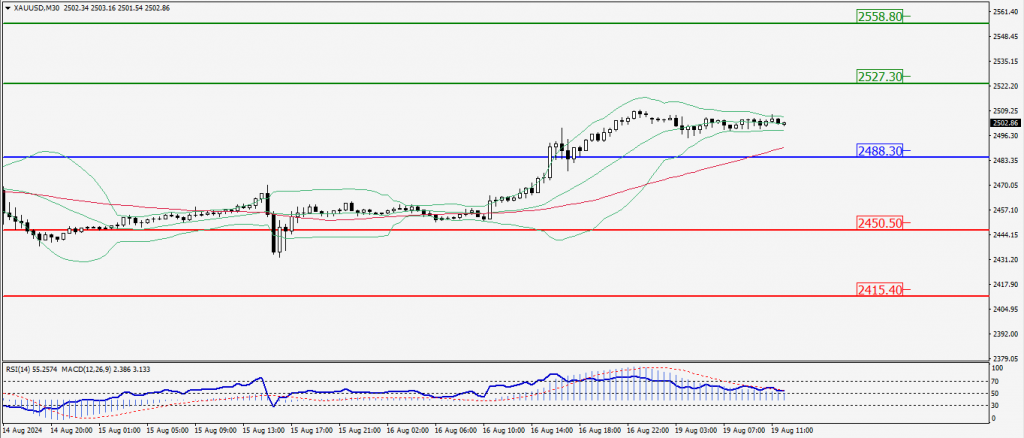
Green Lines Indicate Resistance Levels – Red Lines Indicate Support Levels
Light Blue is a Pivot Point – Black represents the price when the report was produced
Dow Jones Intraday: Trend on the upside
Our pivot point is 40,568.80
Preferable Price Action: Take buy positions above the pivot with targets at 40,982.70 & 41,982.70.
Alternative Price Action: Below 40,568.80 looks for further downside to 40,159.60 & 39,829.50.
Comment: RSI is above 50 levels and pairs above its 55MA.
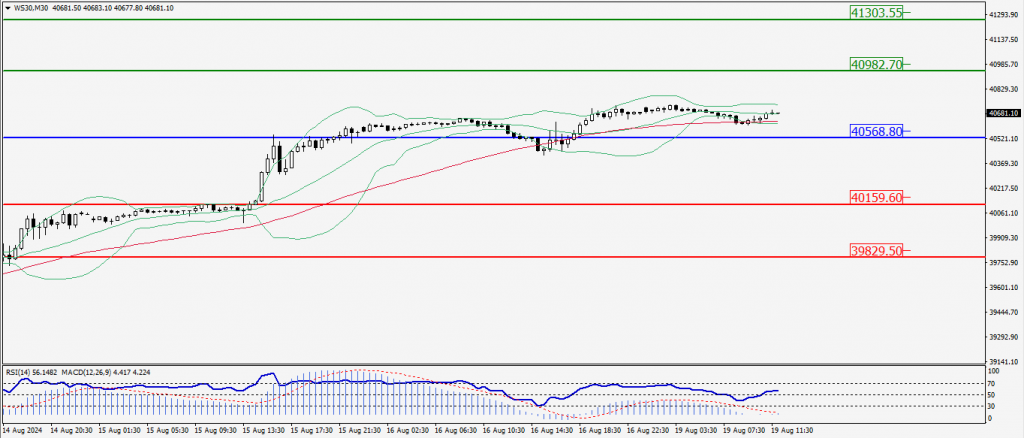
Green Lines Indicate Resistance Levels – Red Lines Indicate Support Levels
Light Blue is a Pivot Point – Black represents the price when the report was produced