Market Wrap: Stocks, Bonds, Commodities
Most Asian currencies moved in a tight range on Friday as growing risk-aversion in global financial markets sparked some safe haven flows into the dollar, while markets awaited key nonfarm payrolls data for more cues.
The Dow Jones Industrial Average fail 494.82 points to 40,347.97, the S&P 500 loss 1.37% to 5,446.68 and the Nasdaq Composite descend 405.26 points to 17,194.15.
MSCI’s index of Asia-Pacific stocks outside Japan is down 2.52% to 677.99 levels. The Australian index was lower by 2.11% to 7,943.20. Japanese Nikkei Index decrease 5.73% today.
European stocks were negative on Friday, with the Stoxx Europe 50 Index decrease 1.12% to 4,712.45, Germany’s DAX descend 1.13% to 17,883.05, and France’s CAC lower 0.41% to 7,340.03 and U.K.’s FTSE 100 loss 0.18% to 8,268.33.
Benchmark 10-year U.S. Treasury rose as demand for safe assets slipped again, today 10-year bond yields decrease 0.61% to 3.9510.
Oil prices rose on Friday but were set for a fourth successive weekly decline, as signs of disappointing global fuel demand growth outweighed fears of supply disruptions.
Spot Brent crude oil increase 1.04% to $80.35 per barrel. US West Texas Intermediate crude is increase 1.13% to $77.17 a barrel.
The yellow metal gold is up 1.07% to 2,507.40 dollars per ounce.
Market Wrap: Forex
Forex traders said a weak American currency and firm trend in the equity markets supported the local currency even as investors remained concerned ahead of the RBI’s monetary policy decision to be announced on Friday.
Today, the U.S. dollar index measures the Greenback against a trade-weighted basket of six major currencies, which decrease 0.13% to 104.290.
The Euro US Dollar (EUR/USD) is a widely traded pair that is increase 0.18% today. This left the pair trading around $1.08100.
The Japanese yen was will move negative against the U.S. dollar on Friday. Today USD/JPY is trades pair that decrease 0.17% to the 149.110 level.
Another commodity-related currency positive against the U.S dollar, AUD/USD gain 0.31% to 0.65180, and NZD/USD increase 0.11% to 0.59530 level.
EUR/USD Intraday: Trend on the upside
Our pivot point is at 1.07930
Preferable Price Action: Take buy positions above pivot level with targets at 1.08020 & 1.08110 in extension.
Alternative Price Action: Sell pivot looks for a further downside to 1.07840 & 1.07760.
Comment: RSI is above 50 levels.
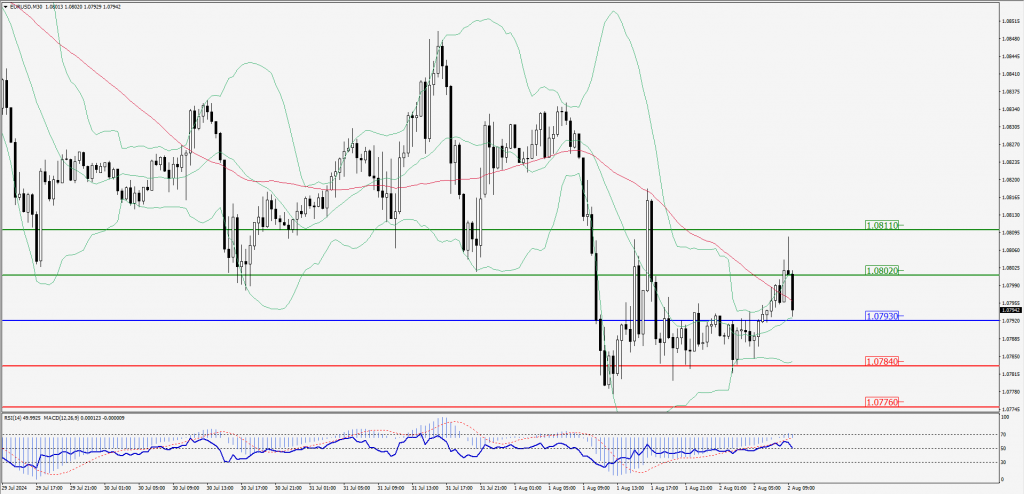
Green Lines Indicate Resistance Levels – Red Lines Indicate Support Levels
Light Blue is a Pivot Point – Black represents the price when the report was produced
GBP/USD Intraday: Trend on the downside
Our pivot point is at 1.27420
Preferable Price Action: Sell positions below pivot with targets at 1.27190 & 1.27000 in extension.
Alternative Price Action: The price above pivot would call for further upside to 1.27680 & 1.27890.
Comment: RSI is below 50 levels and Pairs below its 55MA.
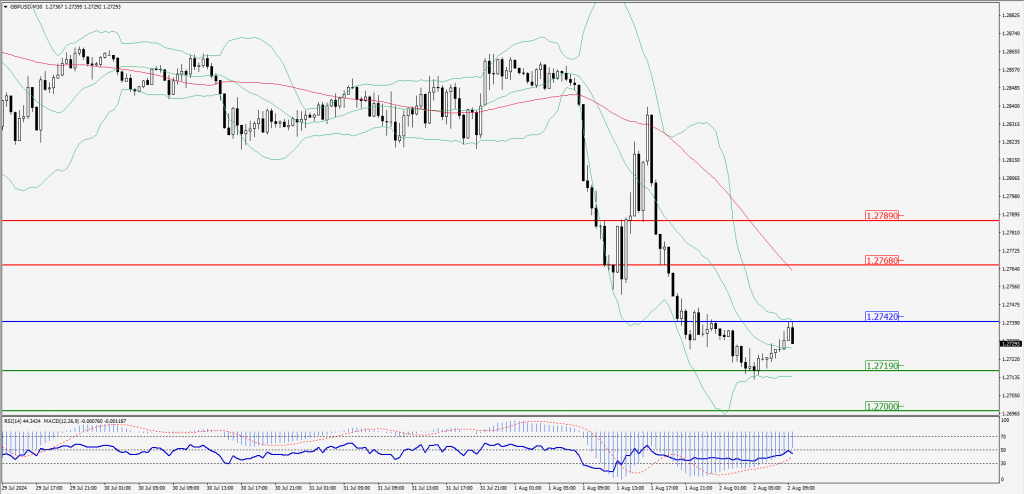
Green Lines Indicate Resistance Levels – Red Lines Indicate Support Levels
Light Blue is a Pivot Point – Black represents the price when the report was produced
USD/JPY Intraday: Trend on the downside
Our pivot point is at 149.330
Preferable Price Action: Sell position below pivot with the target at 148.220 and 147.340 in extension.
Alternative Price Action: The upside breakout of the pivot would call for 150.440 and 151.350.
Comment: MACD is below 50 levels and Pairs below its 20MA & 55MA.
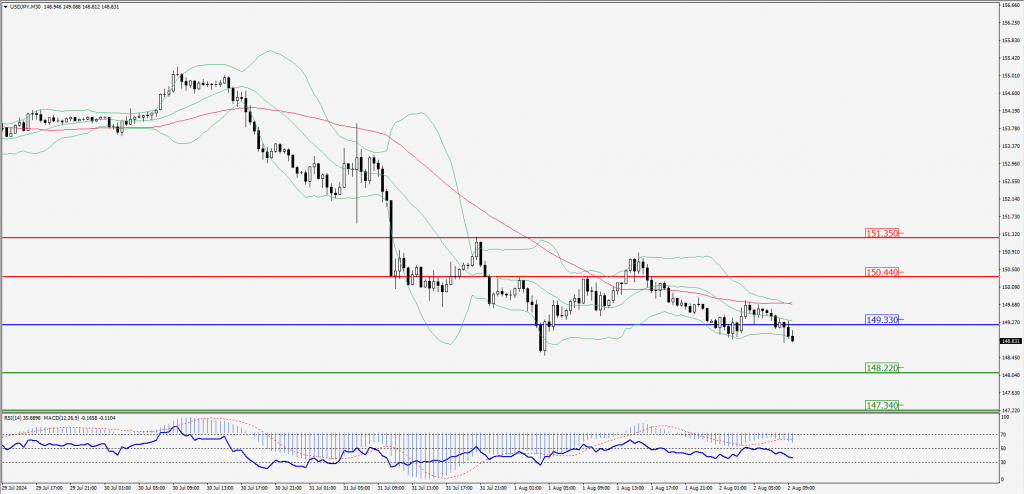
Green Lines Indicate Resistance Levels – Red Lines Indicate Support Levels
Light Blue is a Pivot Point – Black represents the price when the report was produced
AUD/USD Intraday: Support level at 0.65230
Our pivot point is at 0.65230
Preferable Price Action: Buy positions above pivot with targets at 0.65340 & 0.65440 in extension.
Alternative Price Action: Below pivot a further downside with 0.65120 & 0.65010 as targets.
Comment: RSI is above 50 levels and Pairs above its 20MA & 55MA.
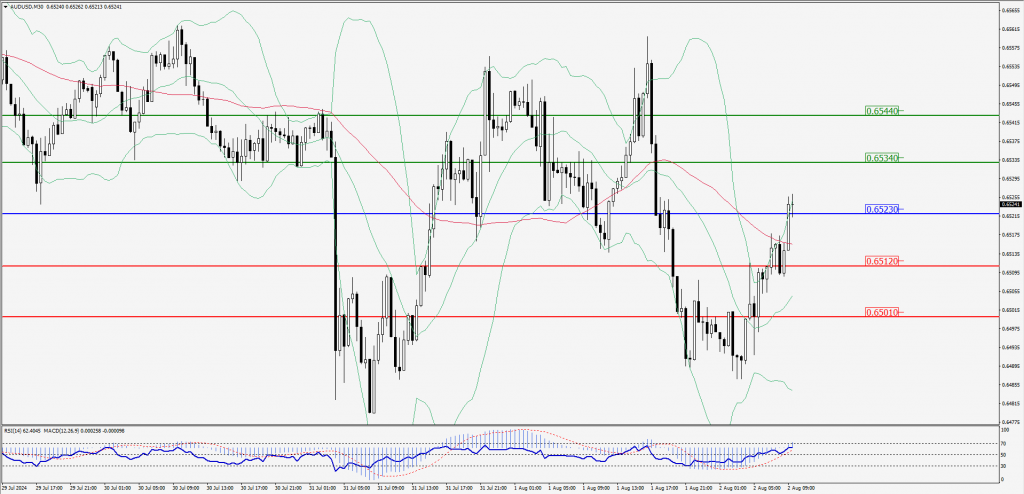
Green Lines Indicate Resistance Levels – Red Lines Indicate Support Levels
Light Blue is a Pivot Point – Black represents the price when the report was produced
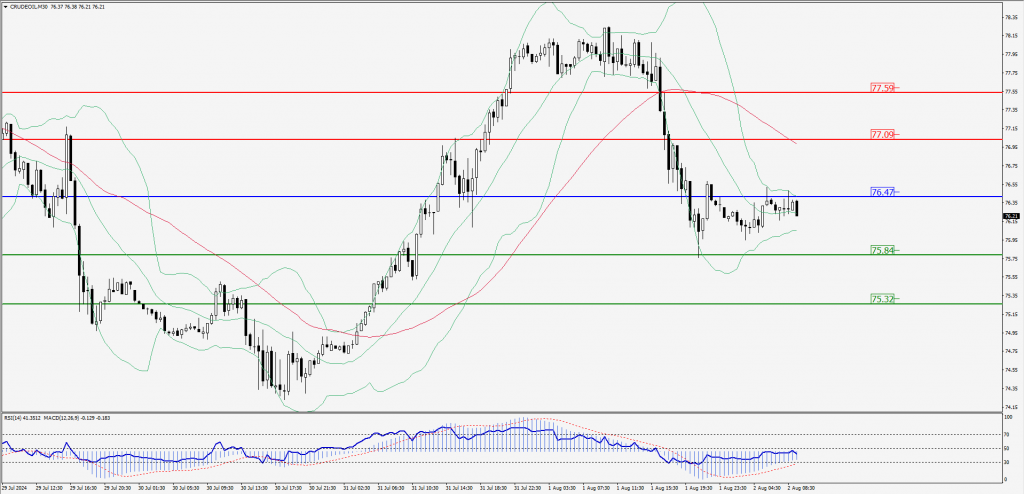
CRUDEOIL Intraday: Trend on the downside
Our pivot point is at 76.47
Preferable Price Action: Below pivot sell oil with 75.84 & 75.32 as targets.
Alternative Price Action: Buy crude above pivot with targets at 77.09 and 77.59 in extension.
Comment: RSI is below 50 levels and pairs below its 55MA.
Green Lines Indicate Resistance Levels – Red Lines Indicate Support Levels
Light Blue is a Pivot Point – Black represents the price when the report was produced
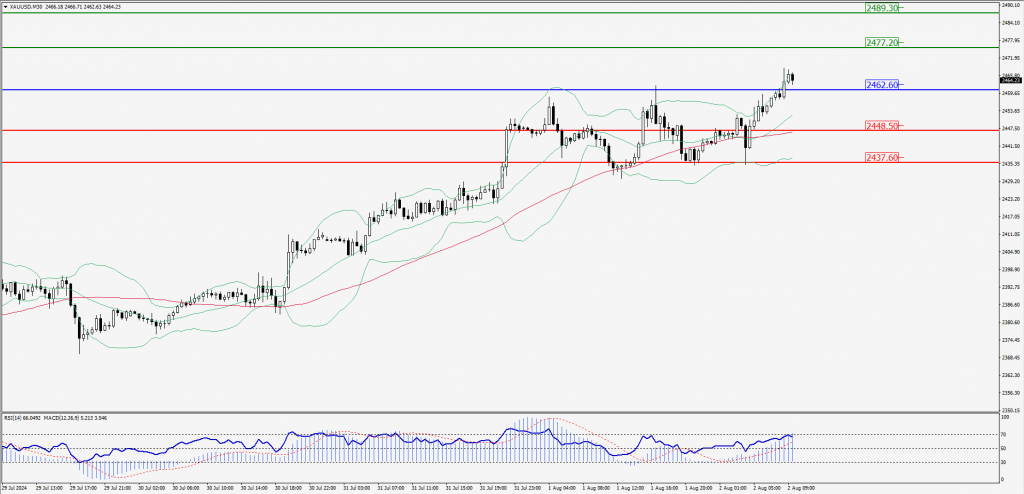
XAU/USD Intraday: Trend on the upside
Our pivot point is at 2462.60
Preferable Price Action: Further upside to 2477.20 and 2489.30.
Alternative Price Action: If the price gives an downside breakout of a pivot, then the price extends to 2448.50 and 2437.60.
Comment: MACD is above 50 levels and pairs above its 55MA & 20MA.
Green Lines Indicate Resistance Levels – Red Lines Indicate Support Levels
Light Blue is a Pivot Point – Black represents the price when the report was produced
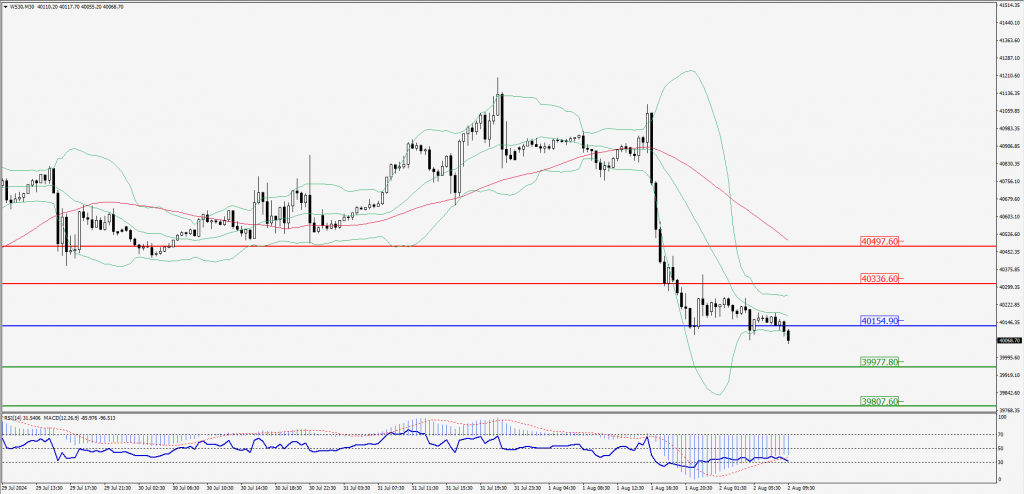
Dow Jones Intraday: Trend on the downside
Our pivot point is 40,154.90
Preferable Price Action: Take sell positions below the pivot with targets at 39,977.80 & 39,807.60.
Alternative Price Action: Above 40,154.90 looks for further upside to 40,336.60 & 40,497.60.
Comment: RSI is below 50 levels and pairs below its 20MA & 55MA.
Green Lines Indicate Resistance Levels – Red Lines Indicate Support Levels
Light Blue is a Pivot Point – Black represents the price when the report was produced