Market Wrap: Stocks, Bonds, Commodities
The U.S. dollar slipped lower in early European trade Thursday as weak economic data raised expectations of interest rate cuts by the Federal Reserve, while sterling edged higher as the U.K. went to the polls.
The Dow Jones Industrial Average fell 23.85 points to 39,308.00, the S&P 500 gain 0.51% to 5,537.02 and the Nasdaq Composite ascend 159.54 points to 18,188.30.
MSCI’s index of Asia-Pacific stocks outside Japan is up 1.11% to 708.92 levels. The Australian index was higher by 1.19% to 7,831.80. Japanese Nikkei Index increase 0.81% today.
European stocks were positive on Thursday, with the Stoxx Europe 50 Index increase 0.44% to 4,987.75, Germany’s DAX ascend 0.38% to 18,449.55, and France’s CAC higher 0.76% to 7,689.74 and U.K.’s FTSE 100 gain 0.74% to 8,231.87.
Benchmark 10-year U.S. Treasury rose as demand for safe assets slipped again, today 10-year bond yields increase 0.46% to 4.3640.
Oil prices fell from two-month highs on Thursday, as traders collected some profits from a strong run-up this week, while soft U.S. economic data raised some concerns over long-term demand.
Spot Brent crude oil decrease 0.63% to $86.79 per barrel. US West Texas Intermediate crude is decrease 0.72% to $83.28 a barrel.
The yellow metal gold is down 0.20% to 2,364.70 dollars per ounce.
Market Wrap: Forex
The U.S. dollar retreated in early European trade Thursday after Federal Reserve Chair Jerome Powell flagged progress towards bringing down inflation, while the euro edged higher ahead of the second round of the French parliamentary vote.
Today, the U.S. dollar index measures the Greenback against a trade-weighted basket of six major currencies, which ascend 0.15% to 104.919.
The Euro US Dollar (EUR/USD) is a widely traded pair that is increase 0.12% today. This left the pair trading around $1.07990.
The Japanese yen was negative against the U.S. dollar on Thursday. Today USD/JPY is trades pair that decreases 0.23% to the 161.310 level.
Another commodity-related currency positive against the U.S dollar, AUD/USD increase 0.21% to 0.67180, and NZD/USD increase 0.19% to 0.61140 level.
EUR/USD Intraday: Trend on the upside
Our pivot point is at 1.07870
Preferable Price Action: Take buy positions above pivot level with targets at 1.08060 & 1.08210 in extension.
Alternative Price Action: Sell pivot looks for a further downside to 1.07680 & 1.07520.
Comment: RSI is above 50 levels and pairs are above its 55MA.
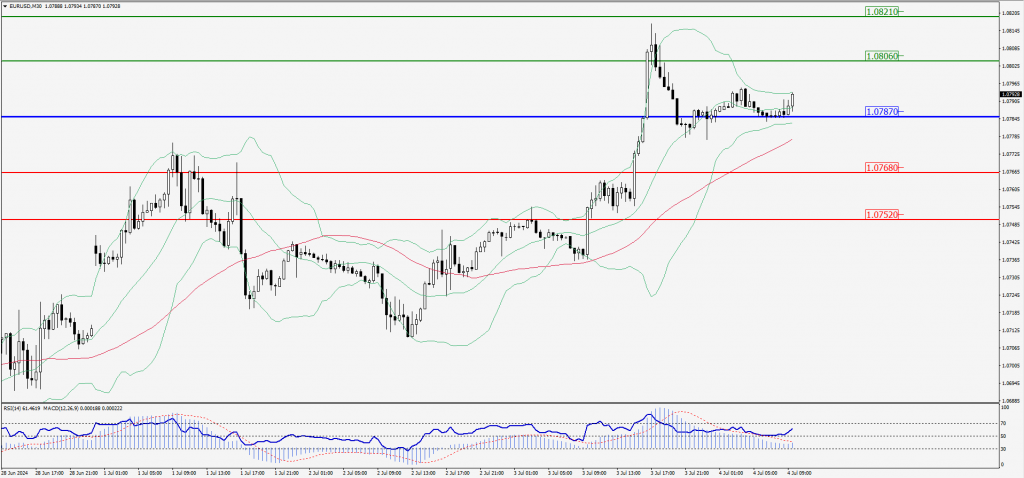
Green Lines Indicate Resistance Levels – Red Lines Indicate Support Levels
Light Blue is a Pivot Point – Black represents the price when the report was produced
GBP/USD Intraday: Trend on the upside
Our pivot point is at 1.27440
Preferable Price Action: Buy positions above pivot with targets at 1.27660 & 1.27830 in extension.
Alternative Price Action: The price below pivot would call for further downside to 1.27220 & 1.27030.
Comment: RSI is above 50 levels and pairs are above its 55MA.
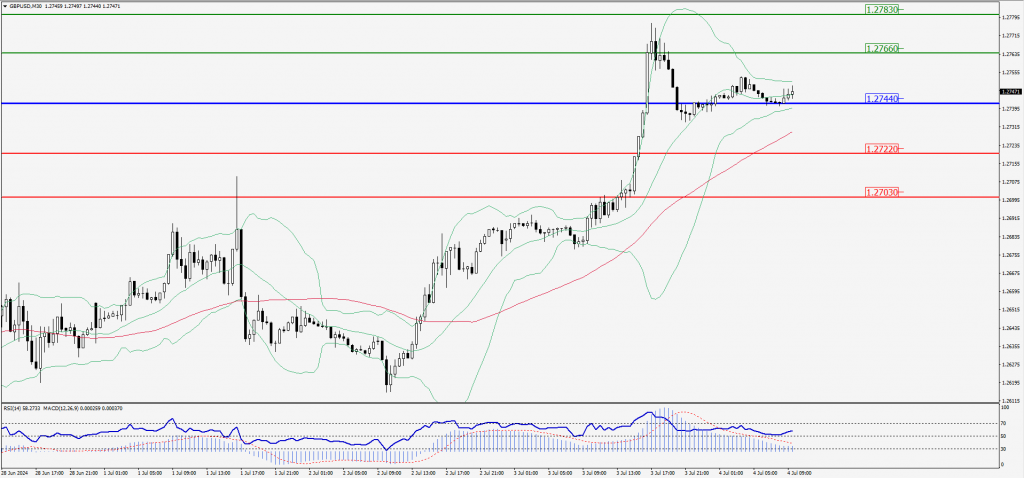
Green Lines Indicate Resistance Levels – Red Lines Indicate Support Levels
Light Blue is a Pivot Point – Black represents the price when the report was produced
USD/JPY Intraday: Trend on the downside
Our pivot point is at 161.460
Preferable Price Action: Sell position below pivot with the target at 161.080 and 160.770 in extension.
Alternative Price Action: The upside breakout of the pivot would call for 161.850 and 162.140.
Comment: MACD is below 50 levels and Pairs below its 20MA & 55MA.
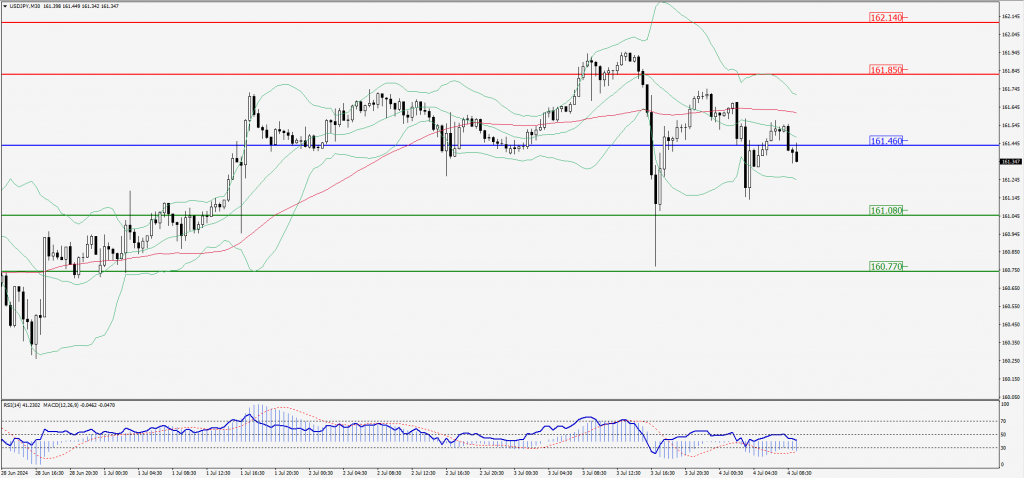
Green Lines Indicate Resistance Levels – Red Lines Indicate Support Levels
Light Blue is a Pivot Point – Black represents the price when the report was produced
AUD/USD Intraday: Trend on the upside
Our pivot point is at 0.67130
Preferable Price Action: Buy positions above pivot with targets at 0.67320 & 0.67460 in extension.
Alternative Price Action: Below pivot a further downside with 0.66940 & 0.66780 as targets.
Comment: RSI is above 50 levels and pairs above its 55MA.
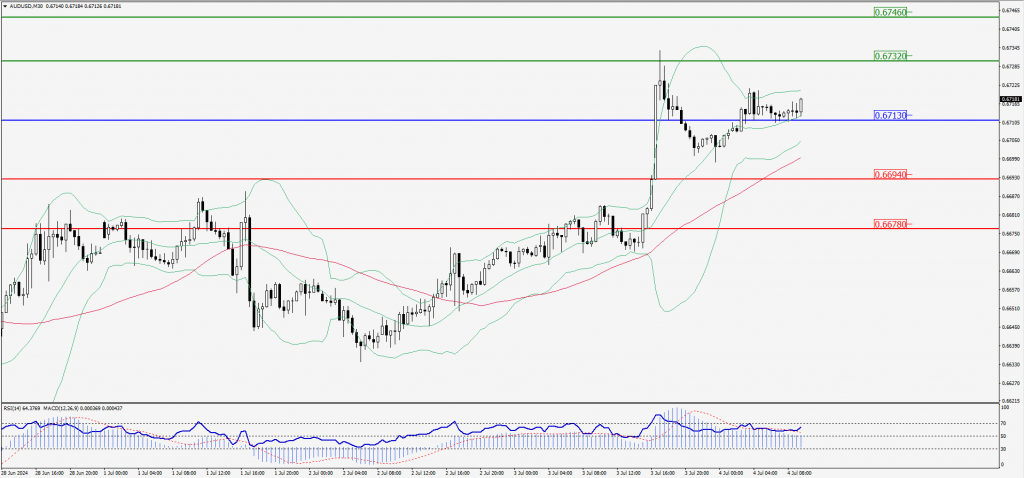
Green Lines Indicate Resistance Levels – Red Lines Indicate Support Levels
Light Blue is a Pivot Point – Black represents the price when the report was produced
CRUDEOIL Intraday: Trend on the downside
Our pivot point is at 82.94
Preferable Price Action: Below pivot sell oil with 82.39 & 81.96 as targets.
Alternative Price Action: Buy crude above pivot with targets at 83.48 and 83.91 in extension.
Comment: RSI is below 50 levels and pairs below its 20MA.
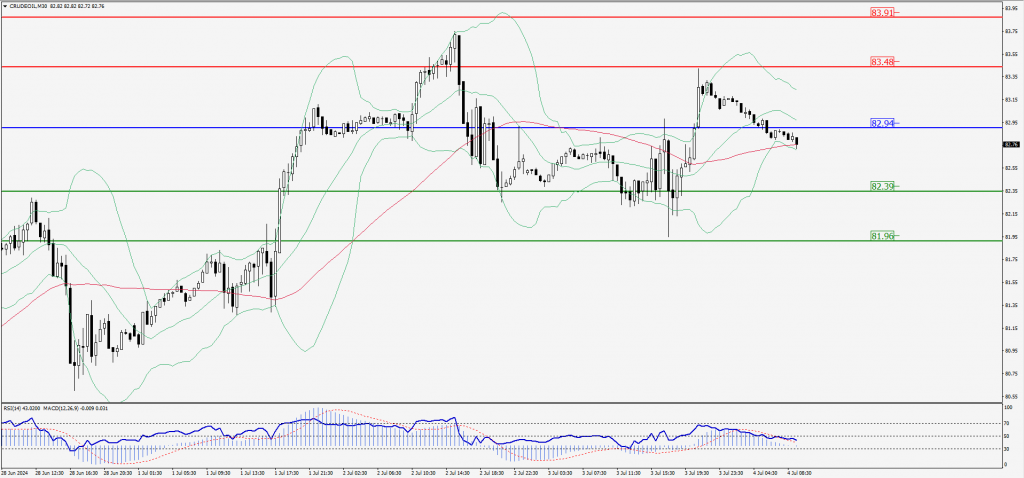
Green Lines Indicate Resistance Levels – Red Lines Indicate Support Levels
Light Blue is a Pivot Point – Black represents the price when the report was produced
XAU/USD Intraday: Trend on the downside
Our pivot point is 2358.30
Preferable Price Action: Further downside to 2350.60 and 2344.60.
Alternative Price Action: If the price gives an upside breakout of a pivot, then the price extends to 2365.70 and 2370.90.
Comment: MACD is below 50 levels and Pairs below its 20MA.
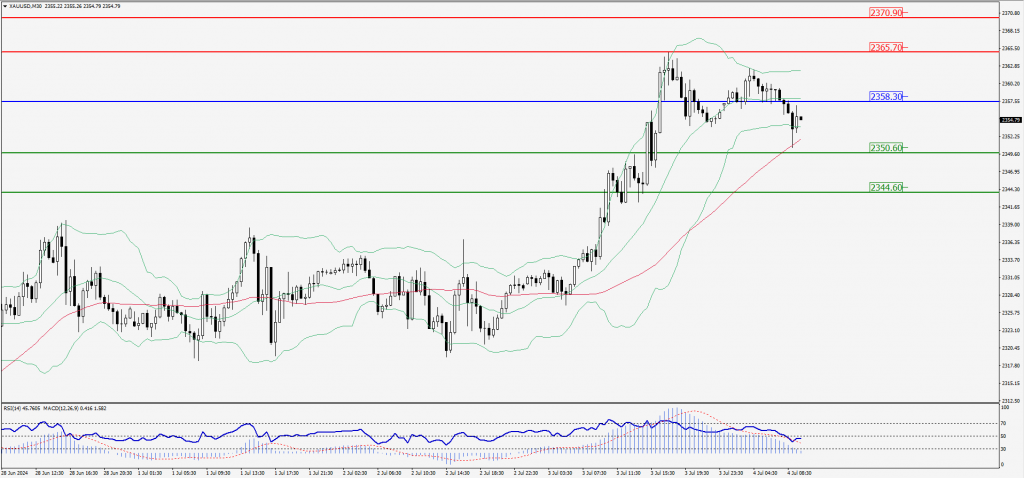
Green Lines Indicate Resistance Levels – Red Lines Indicate Support Levels
Light Blue is a Pivot Point – Black represents the price when the report was produced
Dow Jones Intraday: Support level at 39,297.50
Our pivot point is 39,297.50
Preferable Price Action: Take buy positions above the pivot with targets at 39,383.60 & 39,453.70.
Alternative Price Action: Below 39,297.50 looks for further downside to 39,215.70 & 39,148.50.
Comment: RSI is above 50 levels and pairs above its 20MA.
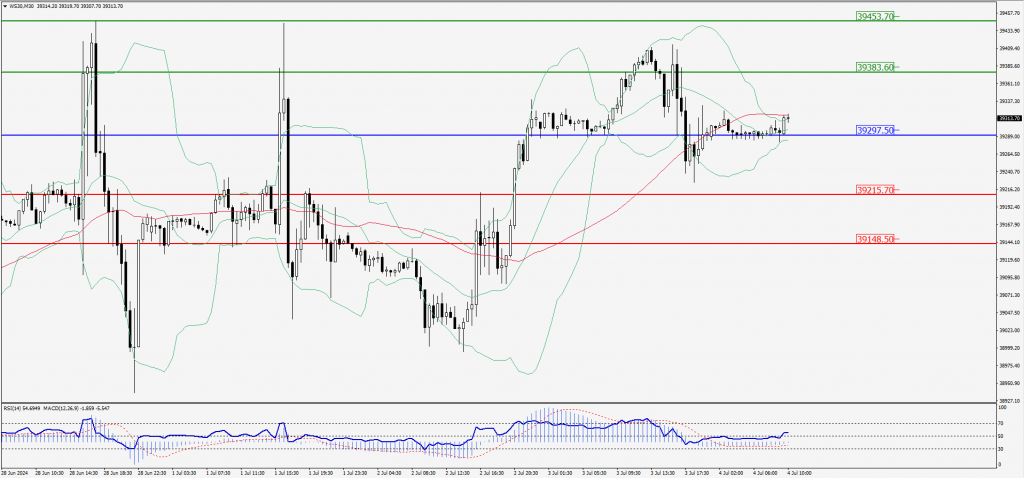
Green Lines Indicate Resistance Levels – Red Lines Indicate Support Levels
Light Blue is a Pivot Point – Black represents the price when the report was produced