Market Wrap: Stocks, Bonds, Commodities
The U.S. dollar retreated in early European trade Wednesday after Federal Reserve Chair Jerome Powell flagged progress towards bringing down inflation, while the euro edged higher ahead of the second round of the French parliamentary vote.
The Dow Jones Industrial Average rose 162.33 points to 39,331.85, the S&P 500 gain 0.62% to 5,509.01 and the Nasdaq Composite ascend 149.88 points to 18,029.18.
MSCI’s index of Asia-Pacific stocks outside Japan is up 0.94% to 700.15 levels. The Australian index was higher by 0.28% to 7,739.90. Japanese Nikkei Index increase 1.25% today.
European stocks were positive on Wednesday, with the Stoxx Europe 50 Index increase 1.05% to 4,957.65, Germany’s DAX ascend 0.81% to 18,300.05, and France’s CAC higher 1.11% to 7,621.64 and U.K.’s FTSE 100 gain 0.53% to 8,164.11.
Benchmark 10-year U.S. Treasury rose as demand for safe assets slipped again, today 10-year bond yields increase 0.11% to 4.4390.
Oil prices rose in Asian trade on Wednesday, staying near two-month highs after industry data showed U.S. inventories saw a massive drawdown in the past week, boosting optimism over demand.
Spot Brent crude oil increase 0.27% to $86.47 per barrel. US West Texas Intermediate crude is increase 0.27% to $83.03 a barrel.
The yellow metal gold is up 0.82% to 2,352.65 dollars per ounce.
Market Wrap: Forex
The dollar slipped on Wednesday in thin, choppy trading after Federal Reserve Chair Jerome Powell struck a moderately dovish tone in his comments, suggesting that the U.S. central bank is more than likely to start its easing cycle later this year.
Today, the U.S. dollar index measures the Greenback against a trade-weighted basket of six major currencies, which descend 0.10% to 105.61.
The Euro US Dollar (EUR/USD) is a widely traded pair that is increase 0.17% today. This left the pair trading around $1.07620.
The Japanese yen was positive against the U.S. dollar on Wednesday. Today USD/JPY is trades pair that increases 0.23% to the 161.810 level.
Another commodity-related currency positive against the U.S dollar, AUD/USD increase 0.17% to 0.66770, and NZD/USD either up or down 0.00% to 0.60780 level.
EUR/USD Intraday: Resistance level at 1.07430
Our pivot point is at 1.07430
Preferable Price Action: Take sell positions below pivot level with targets at 1.07290 & 1.07180 in extension.
Alternative Price Action: Buy pivot looks for a further upside to 1.07570 & 1.07680.
Comment: RSI is below 50 levels and pairs are below its 20MA.
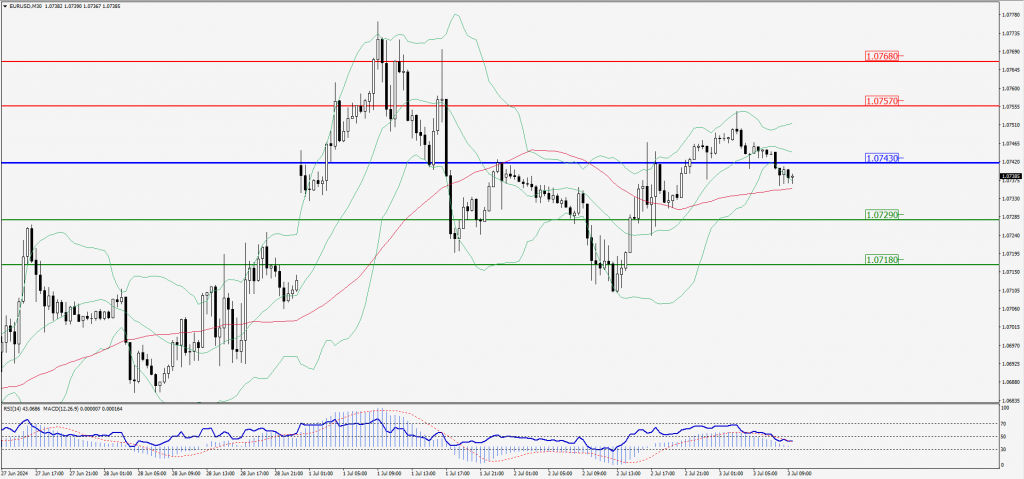
Green Lines Indicate Resistance Levels – Red Lines Indicate Support Levels
Light Blue is a Pivot Point – Black represents the price when the report was produced
GBP/USD Intraday: Trend on the upside
Our pivot point is at 1.26800
Preferable Price Action: Buy positions above pivot with targets at 1.26940 & 1.27060 in extension.
Alternative Price Action: The price below pivot would call for further downside to 1.26670 & 1.26550.
Comment: RSI is above 50 levels and pairs are above its 55MA.
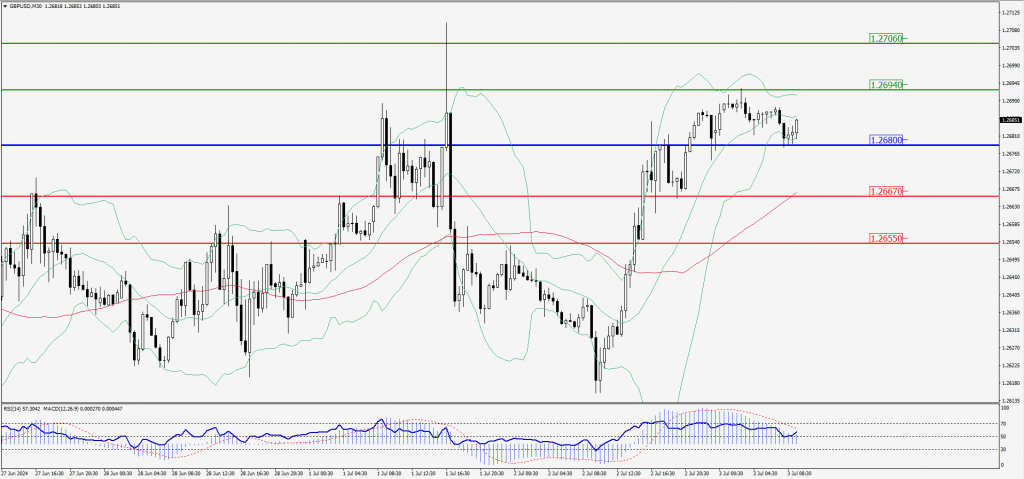
Green Lines Indicate Resistance Levels – Red Lines Indicate Support Levels
Light Blue is a Pivot Point – Black represents the price when the report was produced
USD/JPY Intraday: Major trend on the upside
Our pivot point is at 161.740
Preferable Price Action: Buy position above pivot with the target at 162.090 and 162.380 in extension.
Alternative Price Action: The downside breakout of the pivot would call for 161.370 and 161.060.
Comment: MACD is above 50 levels and Pairs above its 20MA & 55MA.
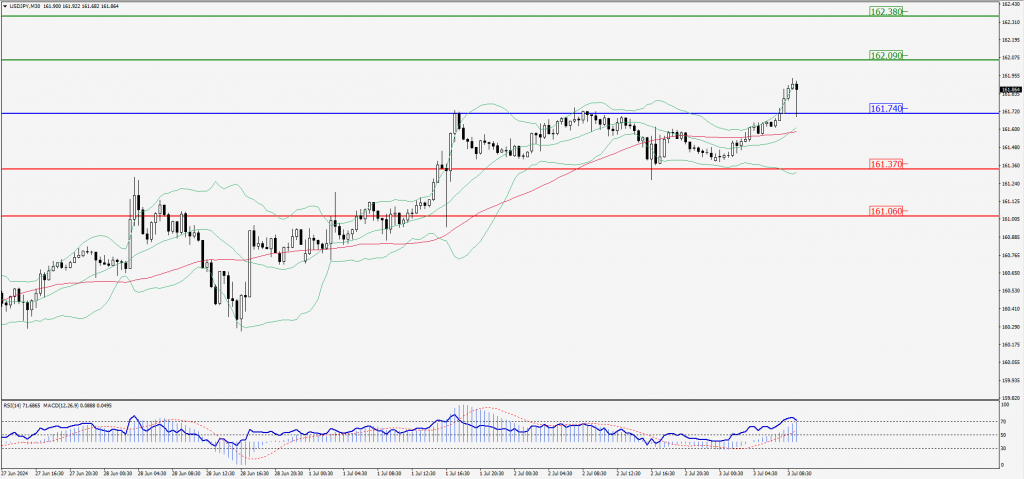
Green Lines Indicate Resistance Levels – Red Lines Indicate Support Levels
Light Blue is a Pivot Point – Black represents the price when the report was produced
AUD/USD Intraday: Trend on the upside
Our pivot point is at 0.66740
Preferable Price Action: Buy positions above pivot with targets at 0.66840 & 0.66910 in extension.
Alternative Price Action: Below pivot a further downside with 0.66640 & 0.66560 as targets.
Comment: RSI is above 50 levels and pairs above its 55MA.
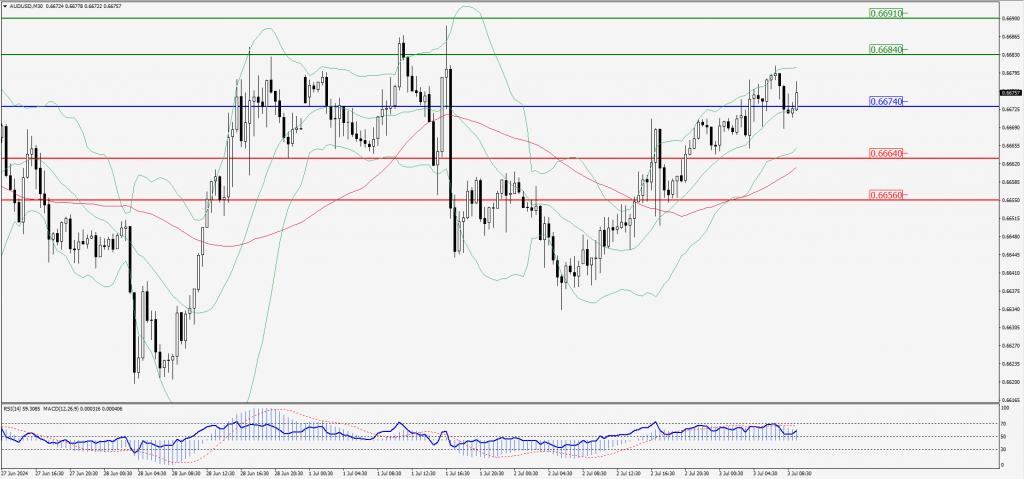
Green Lines Indicate Resistance Levels – Red Lines Indicate Support Levels
Light Blue is a Pivot Point – Black represents the price when the report was produced
CRUDEOIL Intraday: Trend on the upside
Our pivot point is at 82.52
Preferable Price Action: Above pivot buy oil with 83.08 & 83.55 as targets.
Alternative Price Action: Sell crude below pivot with targets at 82.01 and 81.54 in extension.
Comment: RSI is above 50 levels and pairs above its 20MA.
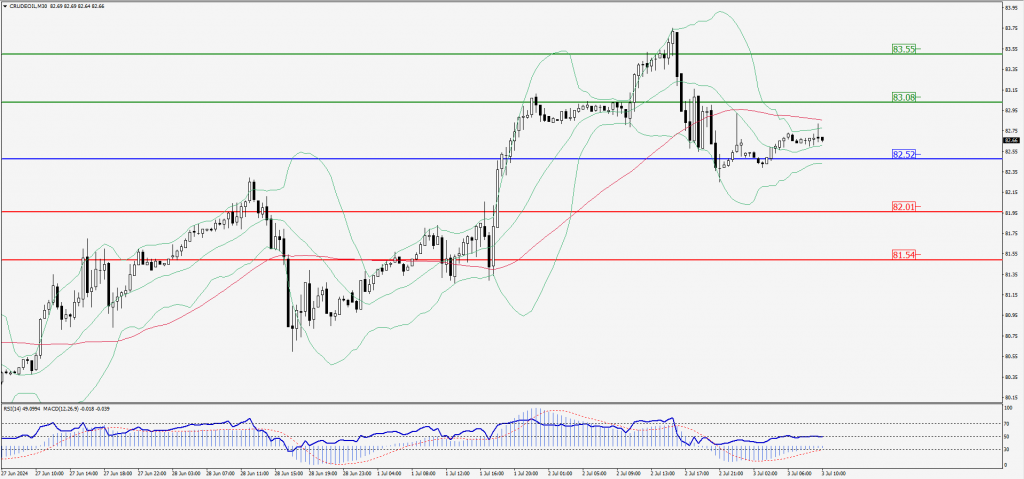
Green Lines Indicate Resistance Levels – Red Lines Indicate Support Levels
Light Blue is a Pivot Point – Black represents the price when the report was produced
XAU/USD Intraday: Major trend on the upside
Our pivot point is 2340.00
Preferable Price Action: Further upside to 2350.20 and 2357.10.
Alternative Price Action: If the price gives an downside breakout of a pivot, then the price extends to 2329.80 and 2321.60.
Comment:
MACD is above 50 levels and Pairs above its 20MA & 55MA.
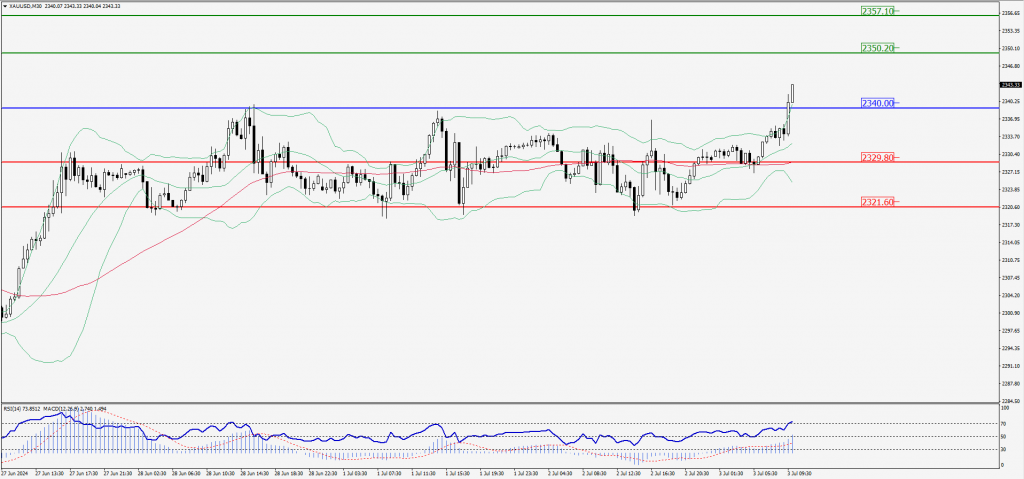
Green Lines Indicate Resistance Levels – Red Lines Indicate Support Levels
Light Blue is a Pivot Point – Black represents the price when the report was produced
Dow Jones Intraday: Trend on the upside
Our pivot point is 39,322.30
Preferable Price Action: Take buy positions above the pivot with targets at 39,401.20 & 39,460.30.
Alternative Price Action: Below 39,322.30 looks for further downside to 39,247.80 & 39,185.70.
Comment: RSI is above 50 levels and pairs above its 20MA & 55MA.
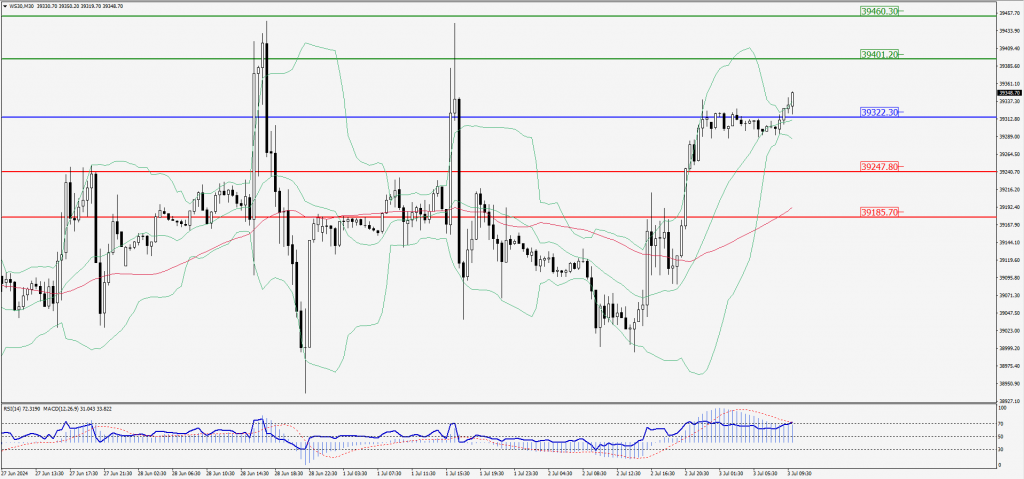
Green Lines Indicate Resistance Levels – Red Lines Indicate Support Levels
Light Blue is a Pivot Point – Black represents the price when the report was produced