Market Wrap: Stocks, Bonds, Commodities
The U.S. dollar surged to a fresh 38-year peak against the yen on Tuesday, as Treasury yields on the long end rose sharply, keeping investors on heightened alert for intervention from Japanese authorities to bolster the country’s currency.
The Dow Jones Industrial Average rose 50.66 points to 39,169.52, the S&P 500 gain 0.27% to 5,475.09 and the Nasdaq Composite ascend 143.65 points to 17,876.26.
MSCI’s index of Asia-Pacific stocks outside Japan is down 0.67% to 692.96 levels. The Australian index was lower by 0.42% to 7,718.20. Japanese Nikkei Index increase 1.24% today.
European stocks were negative on Tuesday, with the Stoxx Europe 50 Index decrease 0.95% to 4,883.25, Germany’s DAX descend 0.98% to 18,141.95, and France’s CAC lower 1.02% to 7,484.26 and U.K.’s FTSE 100 loss 0.67% to 8,111.86.
Benchmark 10-year U.S. Treasury rose as demand for safe assets slipped again, today 10-year bond yields decrease 0.74% to 4.4460.
Oil prices steadied in Asian trade on Tuesday after running up sharply in recent sessions as traders bet on increased demand during the Independence Day holiday and potential supply risks from geopolitics and weather-related disruptions.
Spot Brent crude oil increase 0.07% to $86.66 per barrel. US West Texas Intermediate crude is increase 0.02% to $83.40 a barrel.
The yellow metal gold is down 0.11% to 2,336.35 dollars per ounce.
Market Wrap: Forex
The U.S. dollar edged higher in early European trade Tuesday, on course for its second straight quarterly gain, the euro slipped and the Japanese yen remained on intervention watch.
Today, the U.S. dollar index measures the Greenback against a trade-weighted basket of six major currencies, which ascend 0.14% to 105.737.
The Euro US Dollar (EUR/USD) is a widely traded pair that is decrease 0.23% today. This left the pair trading around $1.07130.
The Japanese yen was positive against the U.S. dollar on Tuesday. Today USD/JPY is trades pair that increases 0.11% to the 161.620 level.
Another commodity-related currency negative against the U.S dollar, AUD/USD decrease 0.23% to 0.66440, and NZD/USD descend 0.41% to 0.60490 level.
EUR/USD Intraday: Trend on the downside
Our pivot point is at 1.07340
Preferable Price Action: Take sell positions below pivot level with targets at 1.07160 & 1.07010 in extension.
Alternative Price Action: Buy pivot looks for a further upside to 1.07520 & 1.07670.
Comment: RSI is below 50 levels and pairs are below its 20MA & 55MA.
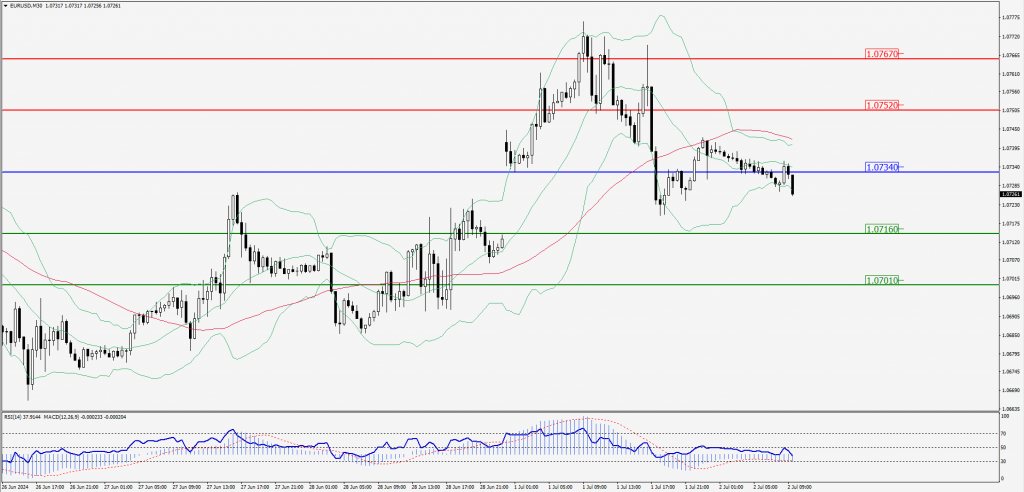
Green Lines Indicate Resistance Levels – Red Lines Indicate Support Levels
Light Blue is a Pivot Point – Black represents the price when the report was produced
GBP/USD Intraday: Trend on the downside
Our pivot point is at 1.26380
Preferable Price Action: Sell positions below pivot with targets at 1.26250 & 1.26150 in extension.
Alternative Price Action: The price above pivot would call for further upside to 1.26510 & 1.26620.
Comment: RSI is below 50 levels and pairs are below its 20MA & 55MA.
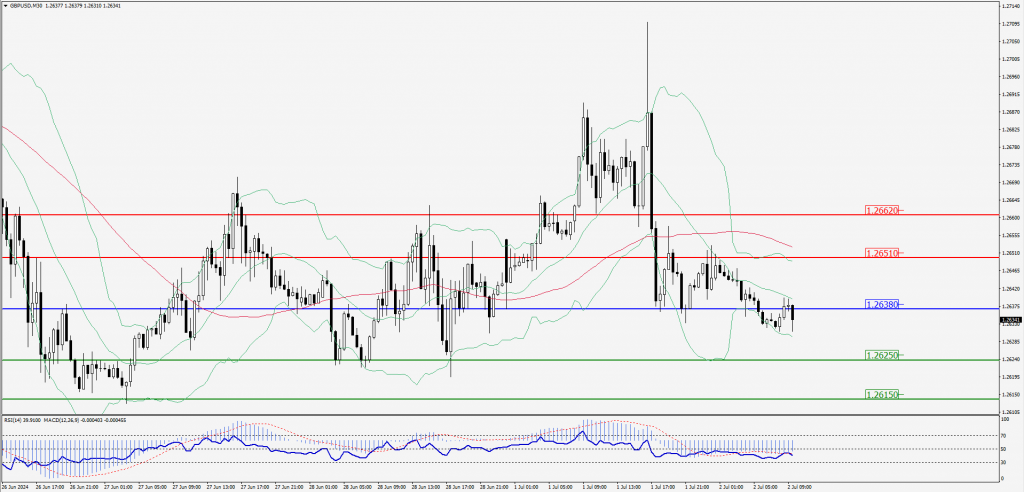
Green Lines Indicate Resistance Levels – Red Lines Indicate Support Levels
Light Blue is a Pivot Point – Black represents the price when the report was produced
USD/JPY Intraday: Trend on the upside
Our pivot point is at 161.560
Preferable Price Action: Buy position above pivot with the target at 161.860 and 162.140 in extension.
Alternative Price Action: The downside breakout of the pivot would call for 161.260 and 160.980.
Comment: MACD is above 50 levels and Pairs above its 55MA.
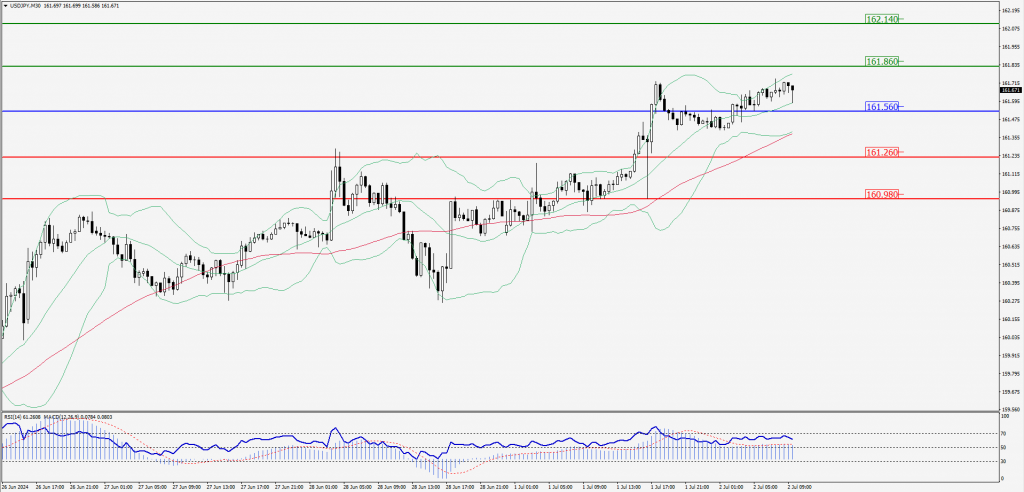
Green Lines Indicate Resistance Levels – Red Lines Indicate Support Levels
Light Blue is a Pivot Point – Black represents the price when the report was produced
AUD/USD Intraday: Trend on the downside
Our pivot point is at 0.66460
Preferable Price Action: Sell positions below pivot with targets at 0.66350 & 0.66250 in extension.
Alternative Price Action: Above pivot a further upside with 0.66570 & 0.66670 as targets.
Comment: RSI is below 50 levels and pairs below its 55MA & 20MA.
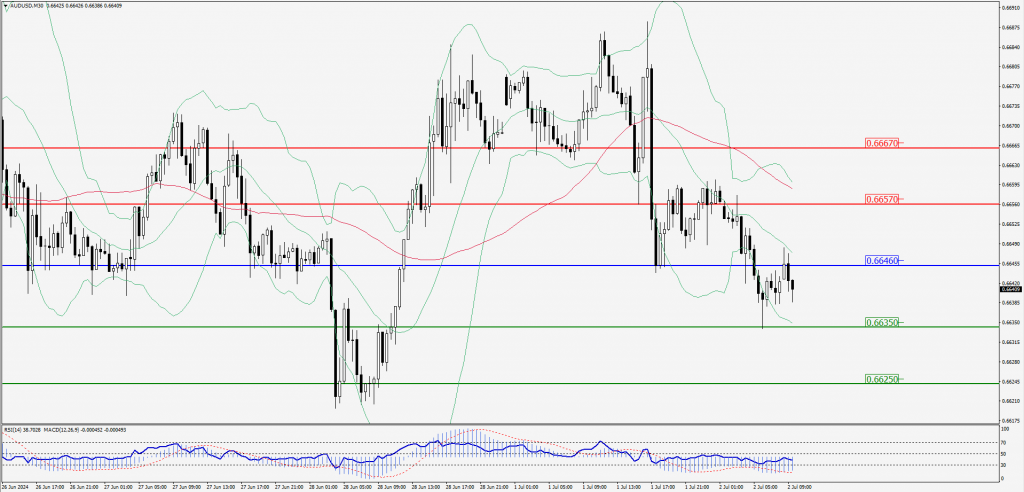
Green Lines Indicate Resistance Levels – Red Lines Indicate Support Levels
Light Blue is a Pivot Point – Black represents the price when the report was produced
CRUDEOIL Intraday: Trend on the upside
Our pivot point is at 82.80
Preferable Price Action: Above pivot buy oil with 83.37 & 83.87 as targets.
Alternative Price Action: Sell crude below pivot with targets at 82.25 and 81.74 in extension.
Comment: RSI is above 50 levels and pairs above its 55MA.
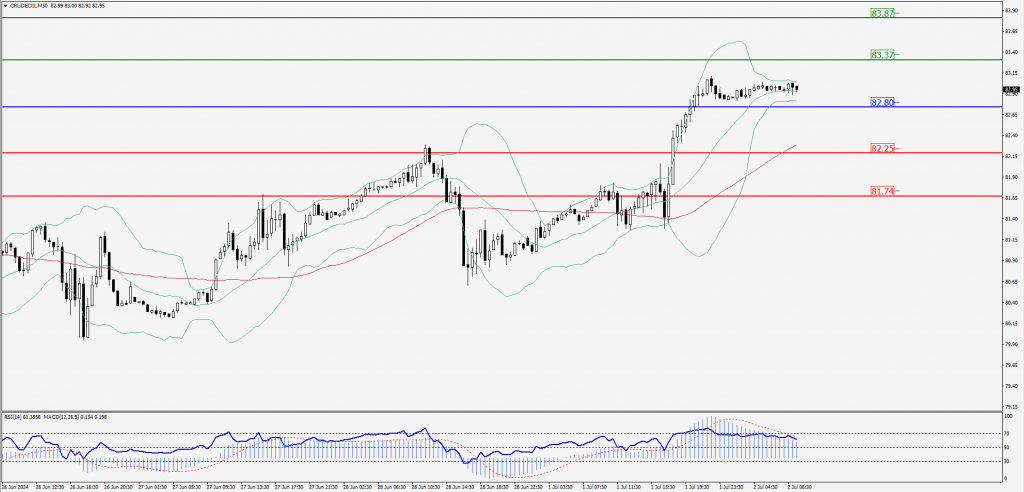
Green Lines Indicate Resistance Levels – Red Lines Indicate Support Levels
Light Blue is a Pivot Point – Black represents the price when the report was produced
XAU/USD Intraday: Trend on the downside
Our pivot point is 2331.20
Preferable Price Action: Further downside to 2325.40 and 2320.60.
Alternative Price Action: If the price gives an upside breakout of a pivot, then the price extends to 2336.60 and 2340.80.
Comment: MACD is below 50 levels.
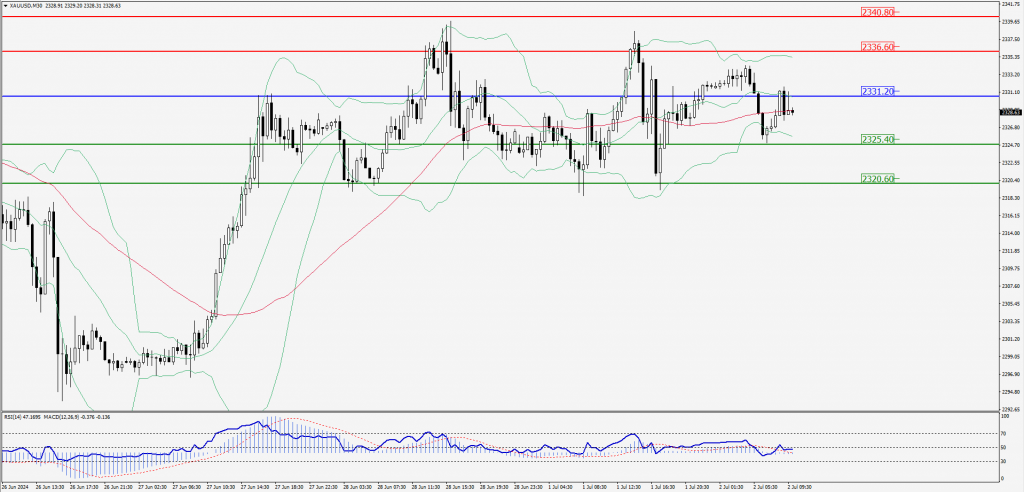
Green Lines Indicate Resistance Levels – Red Lines Indicate Support Levels
Light Blue is a Pivot Point – Black represents the price when the report was produced
Dow Jones Intraday: Trend on the downside
Our pivot point is 39,099.80
Preferable Price Action: Take sell positions below the pivot with targets at 39,027.20 & 38,958.40.
Alternative Price Action: Above 39,099.80 looks for further upside to 39,176.90 & 39,243.50.
Comment: RSI is below 50 levels and pairs below its 20MA & 55MA.
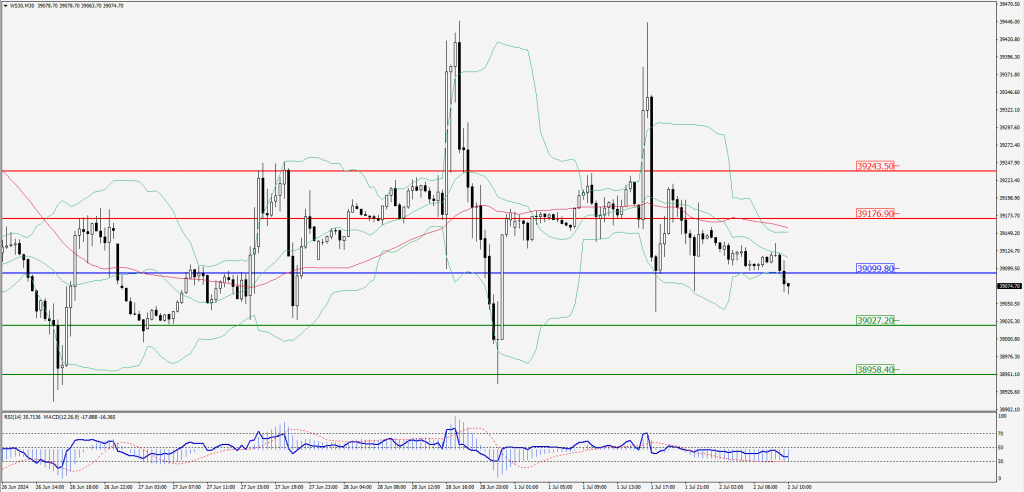
Green Lines Indicate Resistance Levels – Red Lines Indicate Support Levels
Light Blue is a Pivot Point – Black represents the price when the report was produced