Market Wrap: Stocks, Bonds, Commodities
Dow Jones, S&P500, and Nasdaq closed steady ahead of crucial inflation readings and earnings reports this week, as a survey revealed consumer concerns about rising prices.
The Dow Jones Industrial Average fell 81.33 points to 39,431.51, the S&P 500 loss 0.02% to 5,221.42 and the Nasdaq Composite surged 47.37 points to 16,388.24.
MSCI’s index of Asia-Pacific stocks outside Japan is surged 0.35% to 688.10 levels. The Australian index was low by 0.30% to 7,726.80. Japanese Nikkei Index increase 0.39% today.
European stocks were mixed on Tuesday, with the Stoxx Europe 50 Index decrease 0.14% to 5,071.95, Germany’s DAX drop 0.17% to 18,705.75, and France’s CAC lower 0.11% to 8,199.88 and U.K.’s FTSE 100 gain 0.15% to 8,427.45.
Benchmark 10-year U.S. Treasury rose as demand for safe assets slipped again, today 10-year bond yields either up or down 0.02% to 4.4810.
Oil prices rose on Tuesday as the supply-demand balance looked set to tighten on operational disruptions, stronger demand and voluntary output cuts.
Spot Brent crude oil drop 0.18% to $83.21 per barrel. US West Texas Intermediate crude is down 0.16% to $78.99 a barrel.
The yellow metal gold is increase 0.46% to 2,353.75 dollars per ounce.
Market Wrap: Forex
The U.S. dollar steadied Tuesday, largely drifting ahead of the release of key inflation data that are likely to factor into the outlook for interest rates.
Today, the U.S. dollar index measures the Greenback against a trade-weighted basket of six major currencies, which surged 0.04% to 105.150.
The Euro US Dollar (EUR/USD) is a widely traded pair that is increase 0.02% today. This left the pair trading around $1.07900.
The Japanese yen was positive against the U.S. dollar on Tuesday. Today USD/JPY is higher 0.16% to the 156.45 level.
Another commodity-related currency mixed against the U.S dollar, AUD/USD fell 0.02% to 0.66060, and NZD/USD ascend 0.20% to 0.60260 level.
EUR/USD Intraday: Trend on the downside
Our pivot point is at 1.07910
Preferable Price Action: Take sell positions below pivot level with targets at 1.07790 & 1.07690 in extension.
Alternative Price Action: Above pivot looks for a further upside to 1.08020 & 1.08110.
Comment: RSI is below 50 levels.
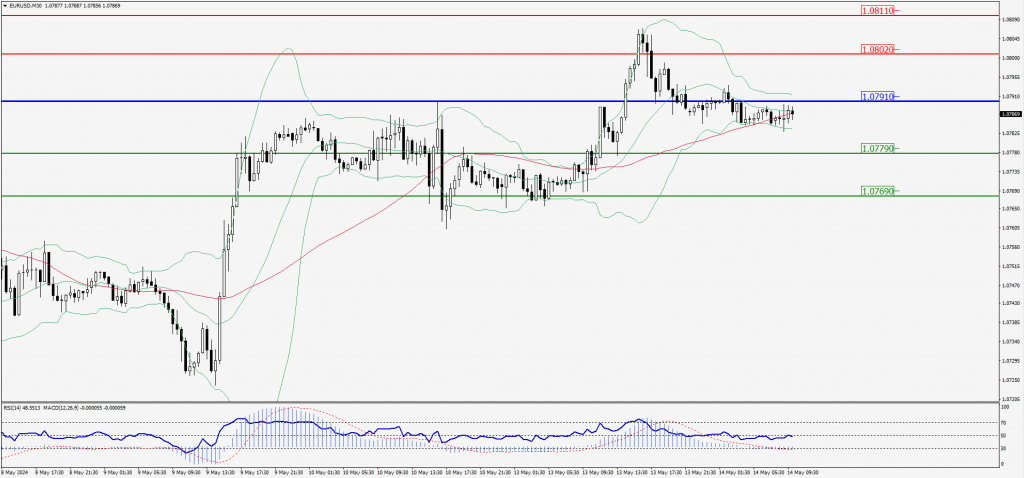
Green Lines Indicate Resistance Levels – Red Lines Indicate Support Levels
Light Blue is a Pivot Point – Black represents the price when the report was produced
GBP/USD Intraday: Trend on the downside
Our pivot point is at 1.25540
Preferable Price Action: Sell positions below pivot with targets at 1.25340 & 1.25180 in extension.
Alternative Price Action: The price above pivot would call for further upside to 1.25740 & 1.25890.
Comment: RSI is below 50 levels and pairs below its 20MA.
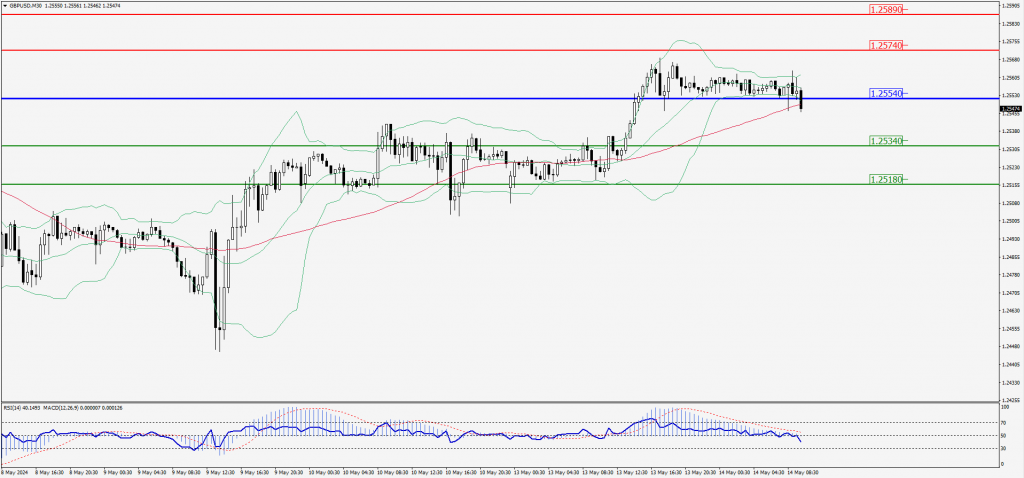
Green Lines Indicate Resistance Levels – Red Lines Indicate Support Levels
Light Blue is a Pivot Point – Black represents the price when the report was produced
USD/JPY Intraday: Major trend on the upside
Our pivot point is at 156.410
Preferable Price Action: Buy position above pivot with the target at 156.660 and 156.820 in extension.
Alternative Price Action: The downside breakout of the pivot would call for 156.170 and 155.990.
Comment: MACD is above 50 levels and pairs above its 20MA & 55MA.
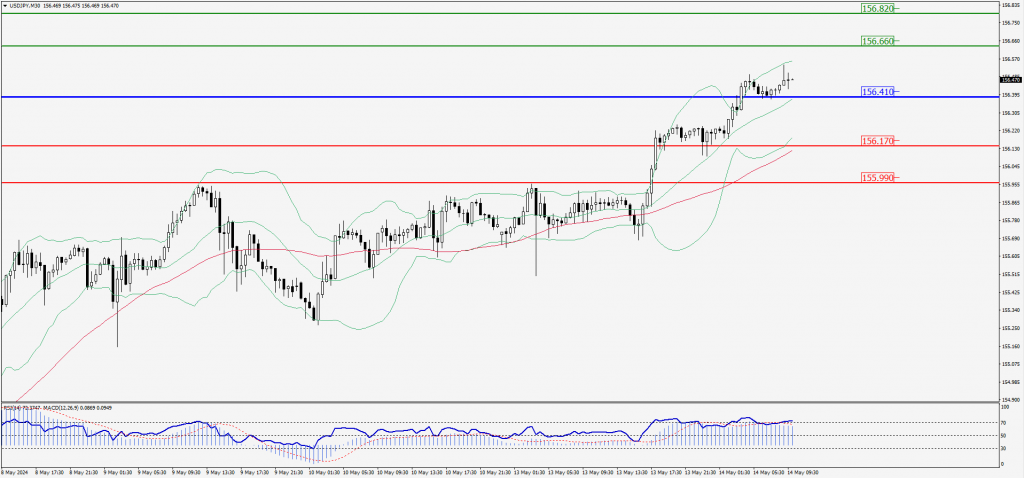
Green Lines Indicate Resistance Levels – Red Lines Indicate Support Levels
Light Blue is a Pivot Point – Black represents the price when the report was produced
AUD/USD Intraday: Resistance level at 0.66070
Our pivot point is at 0.66070
Preferable Price Action: Sell positions below pivot with targets at 0.65970 & 0.65880 in extension.
Alternative Price Action: Above pivot looks for a further upside with 0.66170 & 0.66260 as targets.
Comment: RSI is at 50 levels and pairs below its 55MA.
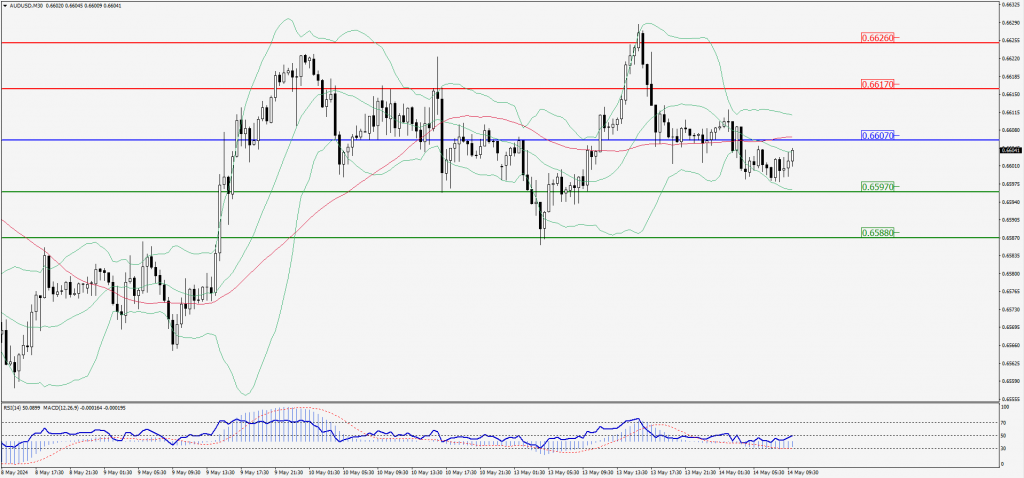
Green Lines Indicate Resistance Levels – Red Lines Indicate Support Levels
Light Blue is a Pivot Point – Black represents the price when the report was produced
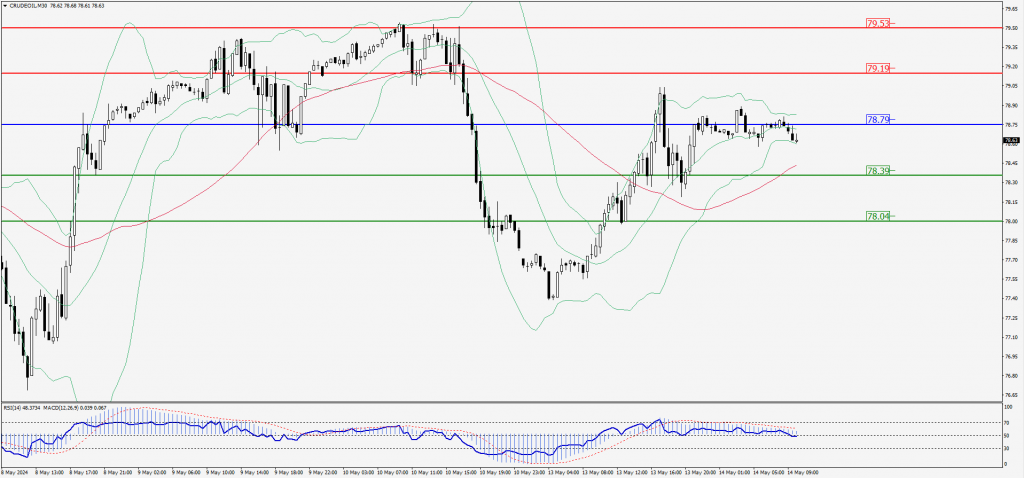
CRUDEOIL Intraday: In consolidation state at 78.79
Our pivot point is at 78.79
Preferable Price Action: Below pivot sell oil with 78.39 & 78.04 as targets.
Alternative Price Action: Buy crude above pivot with targets at 79.19 and 79.53 in extension.
Comment: MACD is flat territory and Pairs below its 20MA.
Green Lines Indicate Resistance Levels – Red Lines Indicate Support Levels
Light Blue is a Pivot Point – Black represents the price when the report was produced
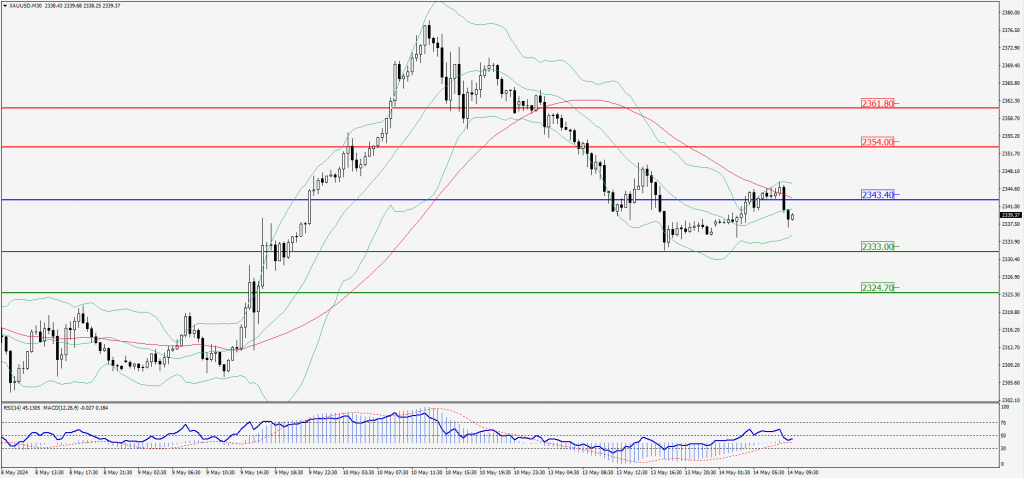
XAU/USD Intraday: Trend on the downside
Our pivot point is 2343.40
Preferable Price Action: Further downside to 2333.00 and 2324.70.
Alternative Price Action: If the price gives an upside breakout of a pivot, then the price extends to 2354.00 and 2361.80.
Comment: MACD is below 50 levels and pairs below its 20MA & 55MA.
Green Lines Indicate Resistance Levels – Red Lines Indicate Support Levels
Light Blue is a Pivot Point – Black represents the price when the report was produced
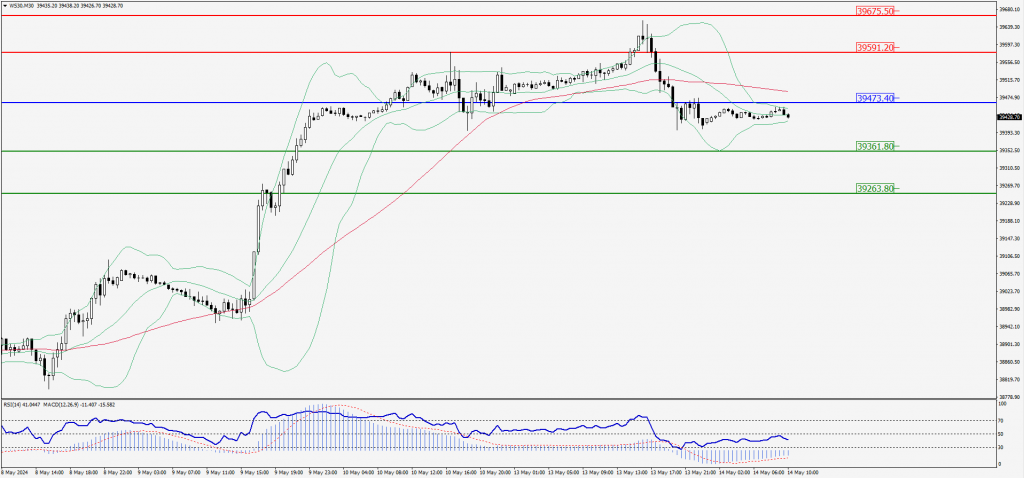
Dow Jones Intraday: Trend on the downside
Our pivot point is 39,473.40
Preferable Price Action: Take sell positions below the pivot with targets at 39,361.80 & 39,263.80.
Alternative Price Action: Below 39,473.40 looks for further downside to 39,591.20 & 39,675.50.
Comment: RSI is below 50 levels and pairs below its 55MA.
Green Lines Indicate Resistance Levels – Red Lines Indicate Support Levels
Light Blue is a Pivot Point – Black represents the price when the report was produced