Market Wrap: Stocks, Bonds, Commodities
US stocks gained ground on Monday and the yen surged amid suspected intervention as investors embarked on what promises to be an action-packed week.
The Dow Jones Industrial Average rose 146.43 points to 38,386.09, the S&P 500 gain 0.32% to 5,116.17 and the Nasdaq Composite ascend 55.18 points to 15,983.08.
MSCI’s index of Asia-Pacific stocks outside Japan is decline 0.01% to 663.66 levels. The Australian index was higher by 0.35% to 7,664.10. Japanese Nikkei Index surged 1.17% today.
European stocks were mixed on Tuesday, with the Stoxx Europe 50 Index decline 0.34% to 4,964.15, Germany’s DAX drop 0.40% to 18,059.75, and France’s CAC lower 0.15% to 8,052.96 and U.K.’s FTSE 100 gain 0.31% to 8,172.48.
Benchmark 10-year U.S. Treasury rose as demand for safe assets slipped again, today 10-year bond yields positive 0.43% to 4.633.
Oil prices fell by more than $1 a barrel on Monday as Israel-Hamas ceasefire talks in Cairo tempered fears of a wider Middle East conflict, while US inflation data dimmed the prospect of imminent interest rate cuts.
Spot Brent crude oil ascend 0.08% to $87.27 per barrel. US West Texas Intermediate crude is up 0.07% to $82.69 a barrel.
The yellow metal gold is decrease 1.30% to 2,327.10 dollars per ounce.
Market Wrap: Forex
The yen dropped against the dollar on Tuesday, giving up some of its sharp gains the previous day sparked by suspected intervention by Japanese authorities.
Today, the U.S. dollar index measures the Greenback against a trade-weighted basket of six major currencies, which surged 0.33% to 105.800.
The Euro US Dollar (EUR/USD) is a widely traded pair that is down 0.21% today. This left the pair trading around $1.0697.
The Japanese yen was negative against the U.S. dollar on Tuesday. Today USD/JPY is higher 0.34% to the 156.86 level.
Another commodity-related currency negative against the U.S dollar, AUD/USD fell 0.62% to 0.6525, and NZD/USD drop 0.71% to 0.5935 level.
EUR/USD Intraday: Trend on the downside
Our pivot point is at 1.07060
Preferable Price Action: Take sell positions below pivot level with targets at 1.06930 & 1.06830 in extension.
Alternative Price Action: Above pivot looks for a further upside to 1.07180 & 1.07280.
Comment: RSI is below 50 levels and pairs below its 20MA & 55MA.
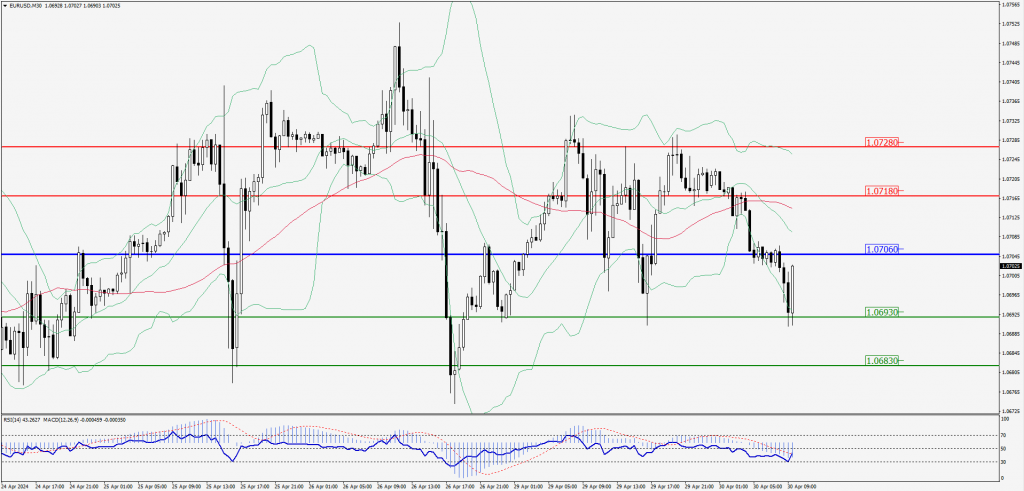
Green Lines Indicate Resistance Levels – Red Lines Indicate Support Levels
Light Blue is a Pivot Point – Black represents the price when the report was produced
GBP/USD Intraday: Trend on the downside
Our pivot point is at 1.25380
Preferable Price Action: Sell positions below pivot with targets at 1.25150 & 1.24970 in extension.
Alternative Price Action: The price above pivot would call for further upside to 1.25600 & 1.25770.
Comment: RSI is below 50 levels and pairs below its 55MA & 20MA.
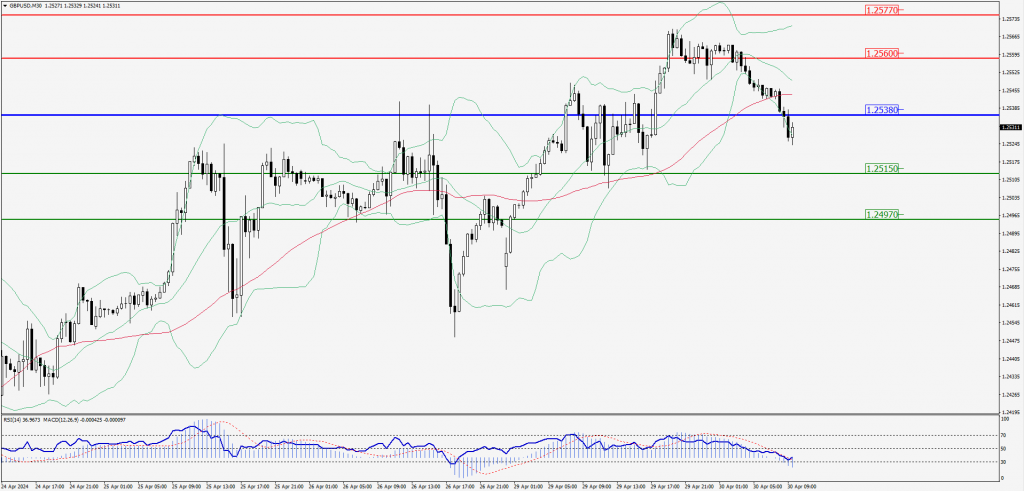
Green Lines Indicate Resistance Levels – Red Lines Indicate Support Levels
Light Blue is a Pivot Point – Black represents the price when the report was produced
USD/JPY Intraday: Trend on the upside
Our pivot point is at 156.680
Preferable Price Action: Buy position above pivot with the target at 157.460 and 158.120 in extension.
Alternative Price Action: The downside breakout of the pivot would call for 155.880 and 155.250.
Comment: MACD is above 50 levels and Paris above its 20MA & 55MA.
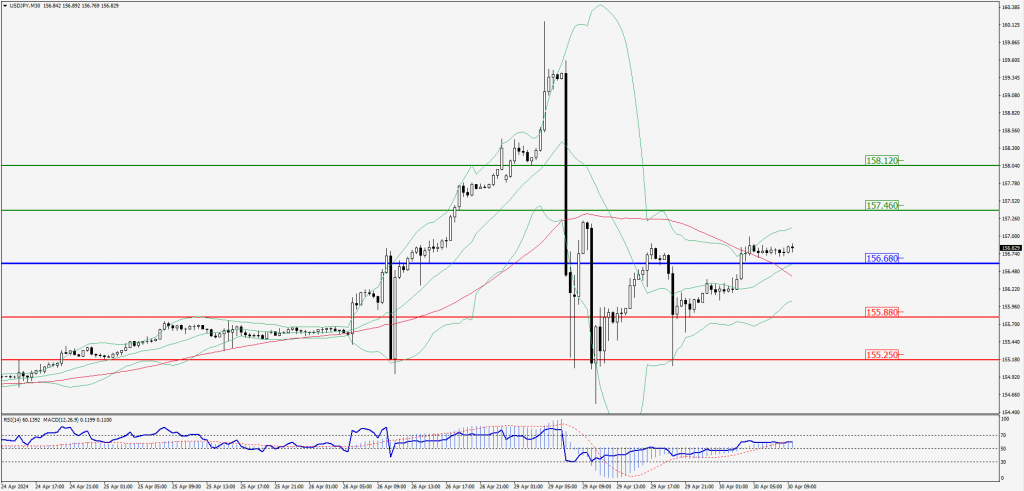
Green Lines Indicate Resistance Levels – Red Lines Indicate Support Levels
Light Blue is a Pivot Point – Black represents the price when the report was produced
AUD/USD Intraday: Major trend on the upside
Our pivot point is at 0.65280
Preferable Price Action: Sell positions below pivot with targets at 0.65120 & 0.64990 in extension.
Alternative Price Action: Above pivot looks for a further upside with 0.65440 & 0.65570 as targets.
Comment: RSI is below 50 levels and pairs below its 20 MA & 55MA.
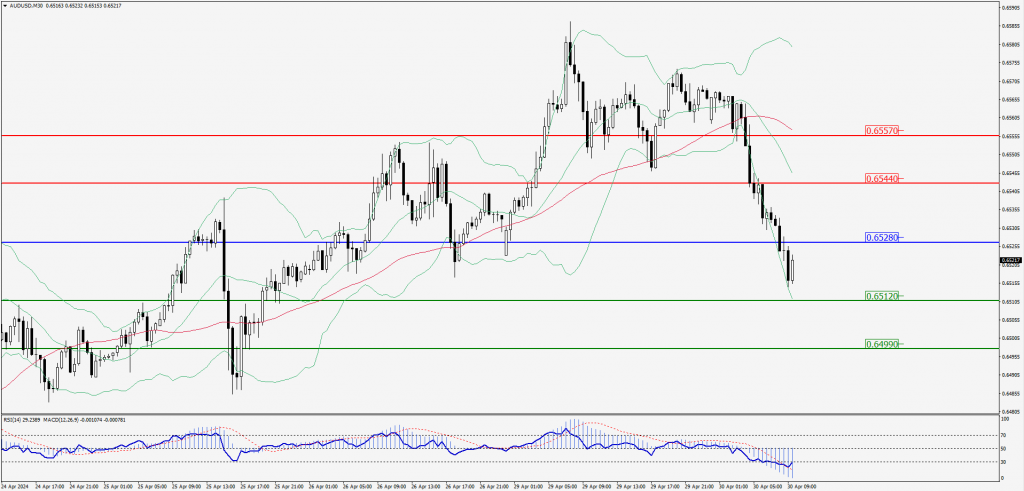
Green Lines Indicate Resistance Levels – Red Lines Indicate Support Levels
Light Blue is a Pivot Point – Black represents the price when the report was produced
CRUDEOIL Intraday: Trend on the downside
Our pivot point is at 82.27
Preferable Price Action: Below pivot sell oil with 81.89 & 81.58 as targets.
Alternative Price Action: Buy crude above pivot with targets at 82.63 and 82.95 in extension.
Comment: MACD is negative territory and pairs below its 20MA & 55MA.
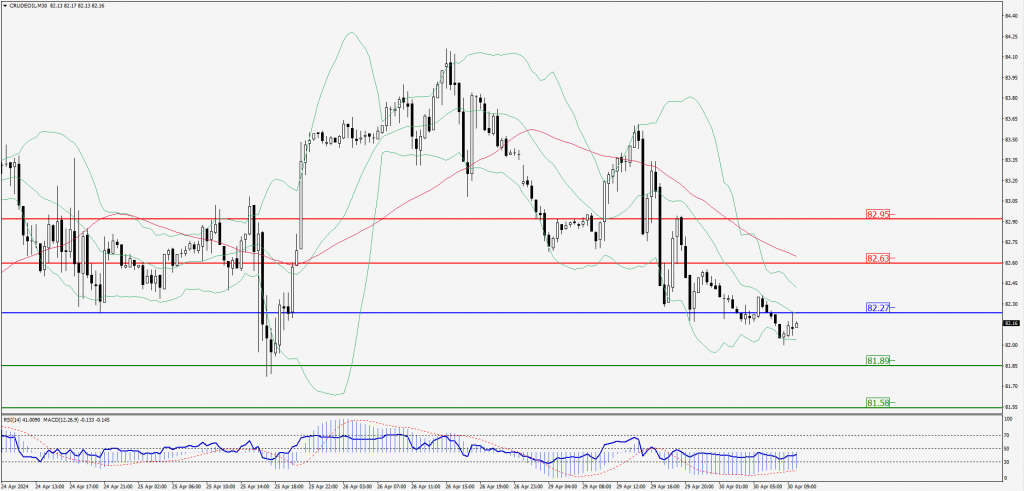
Green Lines Indicate Resistance Levels – Red Lines Indicate Support Levels
Light Blue is a Pivot Point – Black represents the price when the report was produced
XAU/USD Intraday: Major trend at the downside
Our pivot point is 2324.20
Preferable Price Action: Further downside to 2315.40 and 2308.80.
Alternative Price Action: If the price gives a upside breakout of a pivot, then the price extends to 2332.90 and 2339.60.
Comment: MACD is below 50 levels and pairs below its 20MA & 55MA.
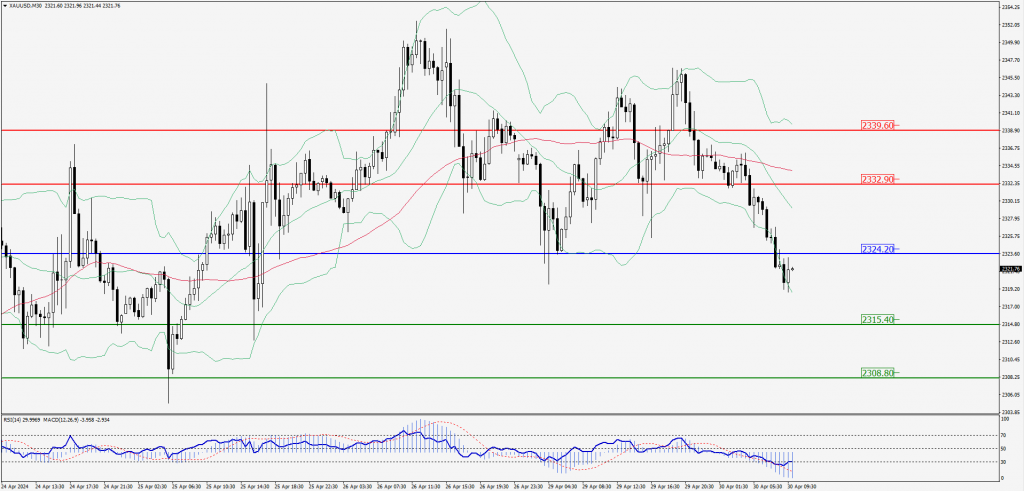
Green Lines Indicate Resistance Levels – Red Lines Indicate Support Levels
Light Blue is a Pivot Point – Black represents the price when the report was produced
Dow Jones Intraday: Support level at 38,339.60
Our pivot point is 38,339.60
Preferable Price Action: Take buy positions above the pivot with targets at 38,449.80 & 38,537.50.
Alternative Price Action: Below 38,339.60 looks for further downside to 38,227.20 & 38,133.90.
Comment: RSI is above 50 levels and pairs above its 20MA & 55MA.
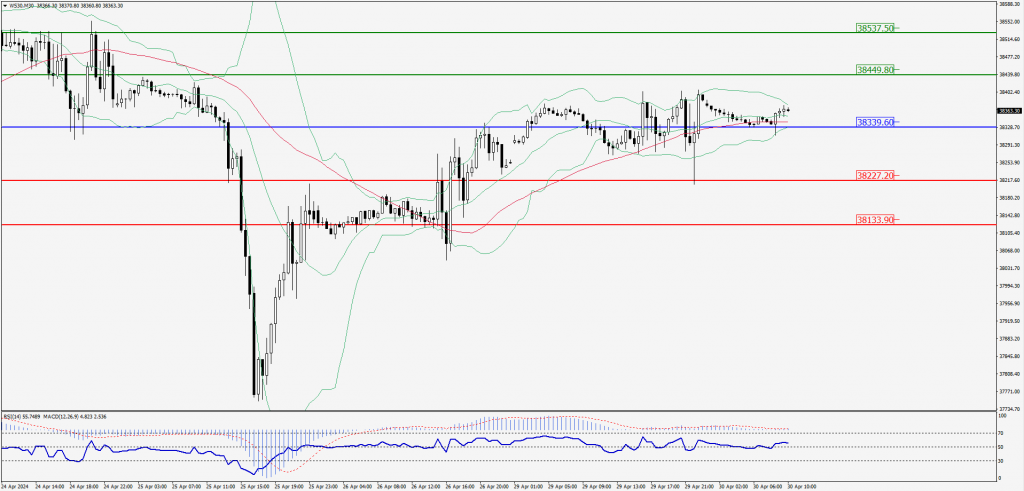
Green Lines Indicate Resistance Levels – Red Lines Indicate Support Levels
Light Blue is a Pivot Point – Black represents the price when the report was produced