Market Wrap: Stocks, Bonds, Commodities
Wall Street’s main stock indexes closed higher on Wednesday after the Federal Reserve eased investor jitters by keeping borrowing costs unchanged and reinforcing expectations that rates could be cut as many as three times this year.
The Dow Jones Industrial Average rose 401.37 points to 39,512.62, the S&P 500 gain 0.89% to 5,224.62 and the Nasdaq Composite surged 202.62 points to 16,369.41.
MSCI’s index of Asia-Pacific stocks outside Japan is advance 1.89% to 660.17 levels. The Australian index was higher by 1.12% to 7,782.00. Japanese Nikkei Index ascend 2.08% today.
European stocks were positive on Thursday, with the Stoxx Europe 50 Index rose 0.65% to 5,031.95, Germany’s DAX ascend 0.57% to 18,114.85, and France’s CAC advance 0.10% to 8,169.69 and U.K.’s FTSE 100 add 0.95% to 7,810.35.
Benchmark 10-year U.S. Treasury fell as demand for safe assets drop again, today 10-year bond yields negative 0.06% to 4.2410.
Oil prices fell on Wednesday after hitting multi-month highs in the previous session, as investors braced for the US Federal Reserve’s interest rate policy announcement later in the day.
Spot Brent crude oil drop 0.07% to $85.86 per barrel. US West Texas Intermediate crude is down 0.20% to $81.08 a barrel.
The yellow metal gold is advance 2.03% to 2,204.75 dollars per ounce.
Market Wrap: Forex
Most Asian currencies rose sharply on Thursday, while the dollar tumbled from two-week highs after comments from the Federal Reserve kept expectations of interest rate cuts largely in play.
Today, the U.S. dollar index measures the Greenback against a trade-weighted basket of six major currencies, which surged 0.20% to 103.250.
The Euro US Dollar (EUR/USD) is a widely traded pair that is down 0.17% today. This left the pair trading around $1.08990.
The Japanese yen was negative against the U.S. dollar on Thursday. Today USD/JPY is slipped 0.11% to the 151.090 level.
Another commodity-related currency positive against the U.S dollar, AUD/USD rose 0.35% to 0.66090, and NZD/USD surged 0.07% to 0.60850 level.
EUR/USD Intraday: Major trend on the upside
Our pivot point is at 1.09300
Preferable Price Action: Take buy positions above pivot level with targets at 1.09450 & 1.09580 in extension.
Alternative Price Action: Below pivot looks for a further downside to 1.09140 & 1.09010.
Comment: RSI is above 50 levels and pairs above its 20MA & 55MA.
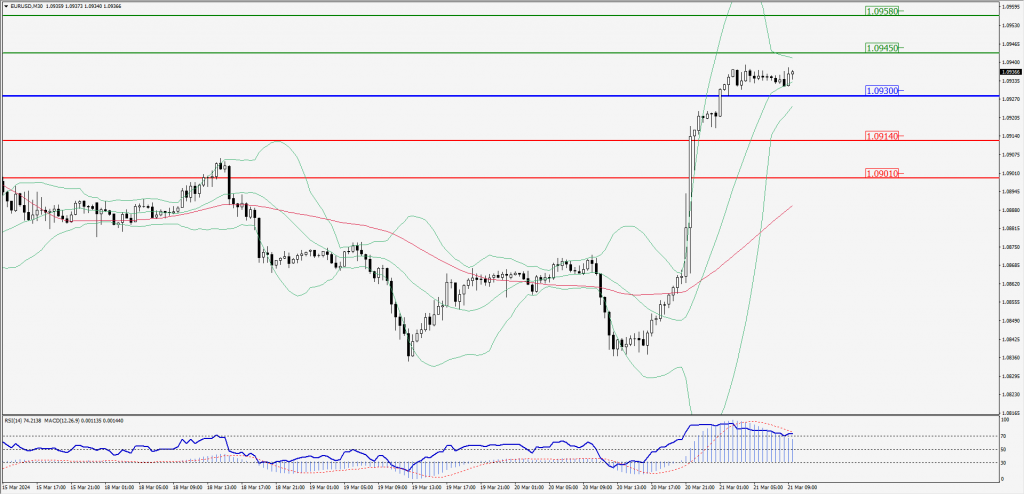
Green Lines Indicate Resistance Levels – Red Lines Indicate Support Levels
Light Blue is a Pivot Point – Black represents the price when the report was produced
GBP/USD Intraday: Support level at 1.27910
Our pivot point is at 1.27910
Preferable Price Action: Buy positions above pivot with targets at 1.28090 & 1.28230 in extension.
Alternative Price Action: The price below pivot would call for further downside to 1.27730 & 1.27580.
Comment: RSI is above 50 levels and pairs above its 20MA & 55MA.
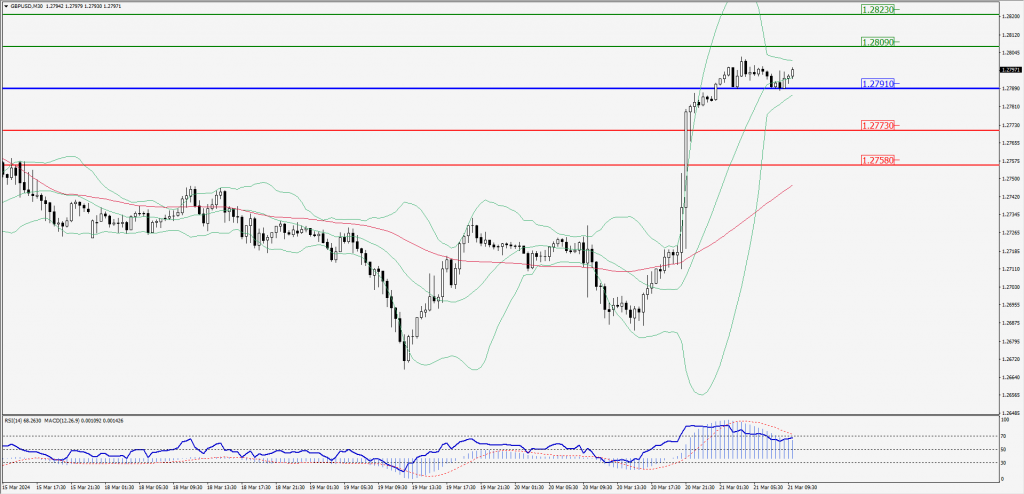
Green Lines Indicate Resistance Levels – Red Lines Indicate Support Levels
Light Blue is a Pivot Point – Black represents the price when the report was produced
USD/JPY Intraday: Trend on the upside
Our pivot point is at 150.810
Preferable Price Action: Buy position above pivot with the target at 151.260 and 151.610 in extension.
Alternative Price Action: The downside breakout of the pivot would call for 150.340 and 150.000.
Comment: MACD is above 50 levels and Pairs above 20MA.
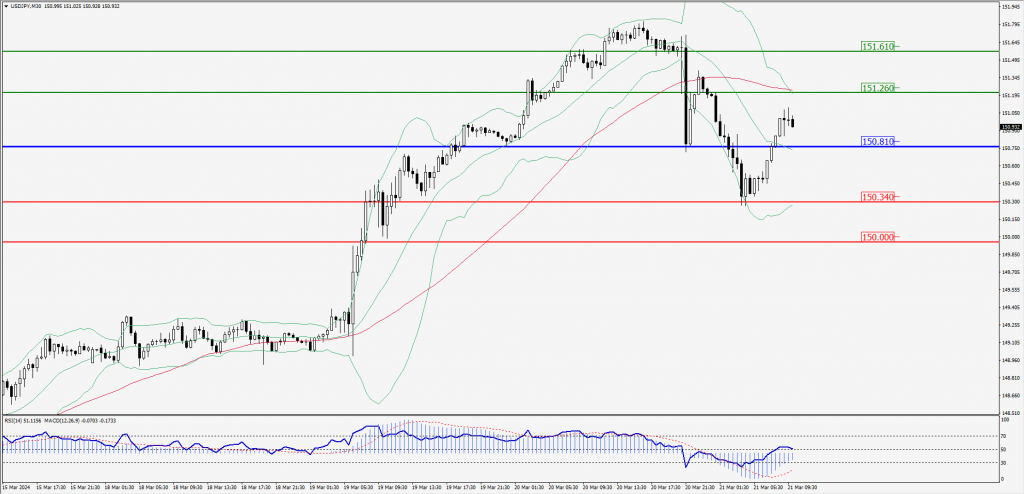
Green Lines Indicate Resistance Levels – Red Lines Indicate Support Levels
Light Blue is a Pivot Point – Black represents the price when the report was produced
AUD/USD Intraday: Major trend on the upside
Our pivot point is at 0.66230
Preferable Price Action: Buy positions above pivot with targets at 0.66440 & 0.66600 in extension.
Alternative Price Action: Below pivot looks for a further downside with 0.66030 & 0.65840 as targets.
Comment: RSI is above 50 levels and pairs above its 20MA & 55MA.
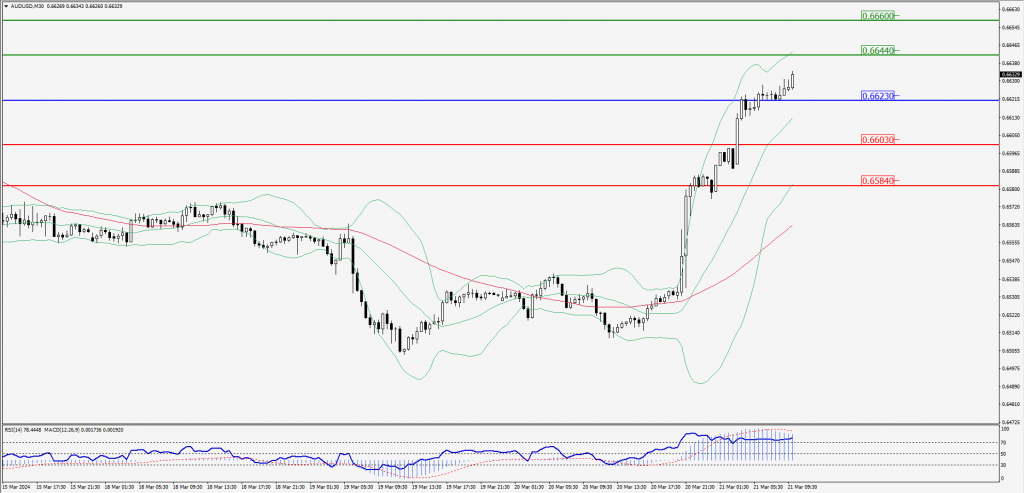
Green Lines Indicate Resistance Levels – Red Lines Indicate Support Levels
Light Blue is a Pivot Point – Black represents the price when the report was produced
CRUDEOIL Intraday: Trend on the upside
Our pivot point is at 81.46
Preferable Price Action: Above pivot buy oil with 81.87 & 82.19 as targets.
Alternative Price Action: Sell crude below pivot with targets at 81.05 and 80.71 in extension.
Comment: MACD is positive territory and Pairs above 20MA.
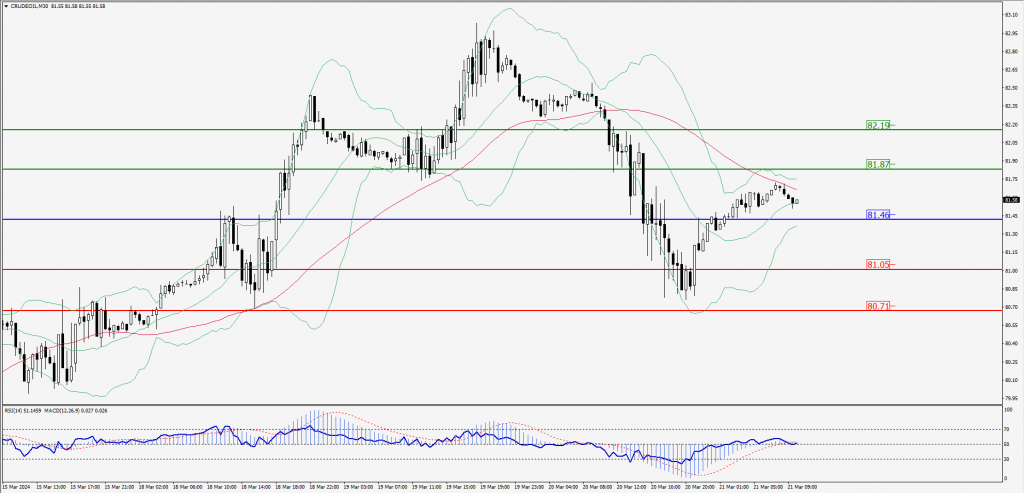
Green Lines Indicate Resistance Levels – Red Lines Indicate Support Levels
Light Blue is a Pivot Point – Black represents the price when the report was produced
XAU/USD Intraday: Major trend on the upside
Our pivot point is 2204.00
Preferable Price Action: Further upside to 2214.80 and 2222.40.
Alternative Price Action: If the price gives an downside breakout of a pivot, then the price extends to 2192.70 and 2183.60.
Comment: MACD is above 50 level and Pairs above its 20MA & 55MA
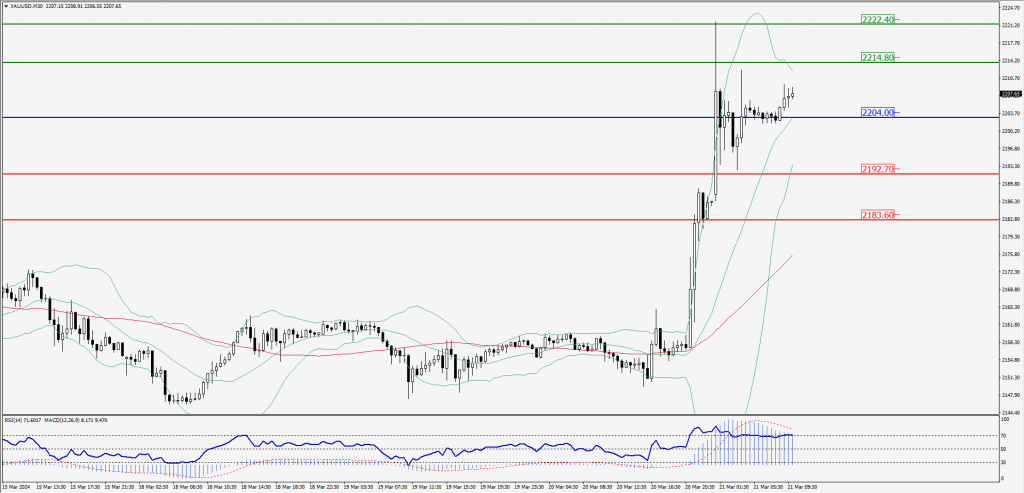
Green Lines Indicate Resistance Levels – Red Lines Indicate Support Levels
Light Blue is a Pivot Point – Black represents the price when the report was produced
Dow Jones Intraday: Major trend on the upside
Our pivot point is 39,590.80
Preferable Price Action: Take buy positions above the pivot with targets at 39,753.20 & 39,873.50.
Alternative Price Action: Below 39,590.80 looks for further downside to 39,428.40 & 39,286.00.
Comment: RSI is above 50 levels and pairs above its 20MA & 55MA.
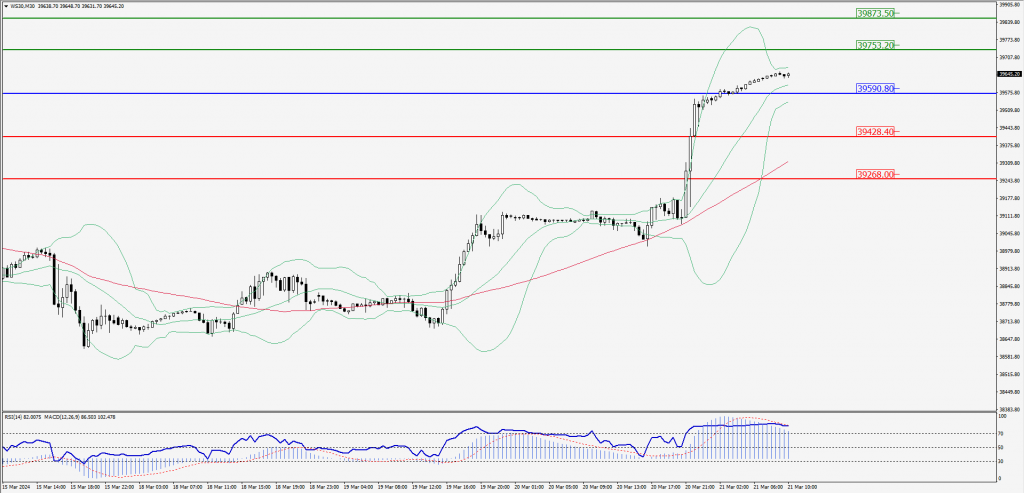
Green Lines Indicate Resistance Levels – Red Lines Indicate Support Levels
Light Blue is a Pivot Point – Black represents the price when the report was produced